GOVERNMENT BONDS YIELD. INVERTED CURVEWhat are GOVERNMENT BONDS YIELD?
Bonds are Fixed Income instruments that allow investors to anticipate the flow of funds they will receive.
What does an inverted yield curve mean?
Put simply, this means that short-term US debt is more profitable than long-term debt. Economic theory says that in a “normal” situation, long-term lending should be more profitable than short-term lending.
An inverted yield curve occurs when the yield on short-term bonds (US03MY, US06MY, US01Y) is greater than the yield on longer-term bonds (US30Y, US20Y) .
This is bad for the economy and worse if it is the United States because it means that they are relying on the economy in the short term since the "normal" thing is that long-term bonds give better yields.
Some economists and analysts see in this situation an indicator that a next economic crisis is coming, either in the form of a slowdown in GDP or even a recession.
Economy

Silver & Gold. Long? Short?Remain neutral/bearish on gold & silver until the US10Y, DXY, & Fed Funds Rates tops.
This is the first time since the de-pegging of USD/Gold (in 1975) that interest rates & the USD have been rising.
This creates an extremely tough environment for gold & silver to significantly rally being under pressure from high dollar & rising interest rates.
Despite strong headwinds, there are many tailwinds as well that will lead many commodities prices higher such as, the clean transition, & the dollar (usd) devaluing.
Chart:
FED FUNDS Rate = Blue Line

BTC - Almost Halfway Through The Accumulation E've been comparing recent BTC capitulation and now accumulation at the lows with the one in 2015. They are very similar in accumulation structure as well a how deep both capitulations went. Don't get me wrong, i don't thing this is a true bottom formation like it was in 2015 leading to the next bull run, but only forming a local bottom that just happens to be very similar as one in 2015. After completing this accumulation i still expect BTC will go into a retracement that can still take us slowly back in 45-50k area, before continuing the falL.
From the comparison with todays price action wth the 2015 one, we can also expect btc to still reach the top of the range, make even higher local high (green box) and still then fall down to the bottom of the range (orange box), before starting a long awaited retracement.
It all depends on a macro picture of the economy by itself. Will see what the stock market does first, but charts do show a local bottom being set for now.
DISCLAMER:
I am not a financial advisor so non of this should be taken as a financial advise. Be well.

S&P 500 Daily Chart Analysis For Week of October 14, 2022Technical Analysis and Outlook
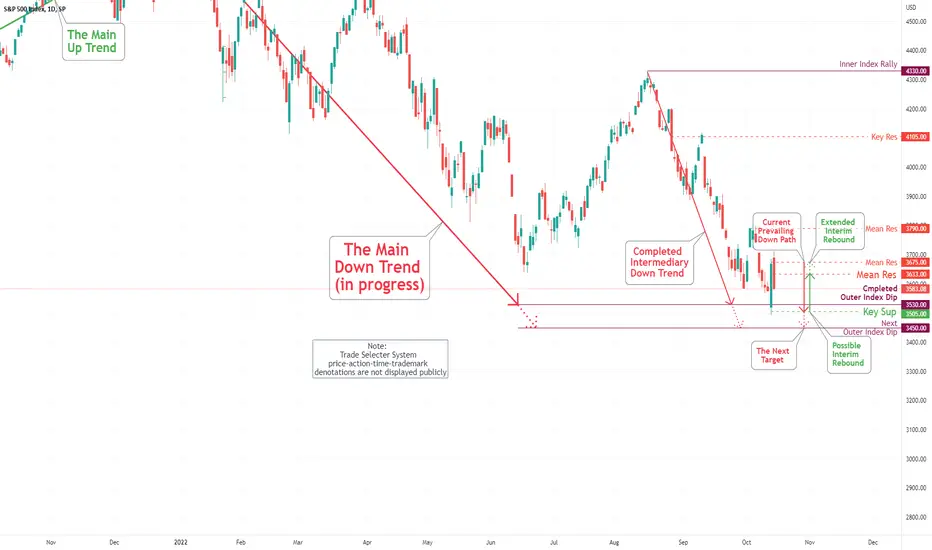
The immediate reversal on Friday of the vigorous upside rebound (Dead-cat ricochet) on Thursday was caused by the long-term specified Outer Index Dip 3530 (Oversold market): The downside target is the retest of the Key Sup 3505, Outer Index Dip 3530 with the Next Outer Index Dip 3450 is in the making. Following the completed above-specified targets, a short-term move leading to the newly created Mean Res 3633 is possible.
EUR/USD Daily Chart Analysis For Week of October 14, 2022Technical Analysis and Outlook:
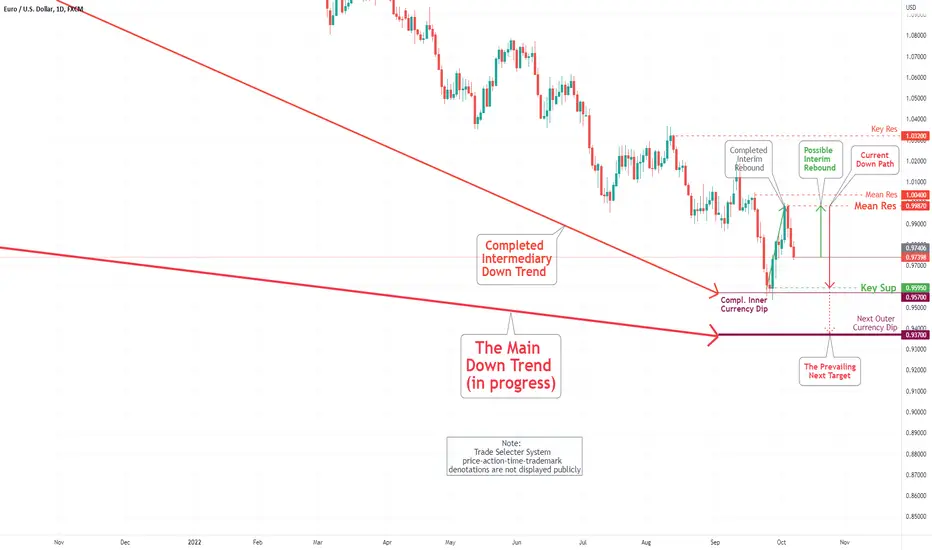
The Eurodollar's failed attempt to retest our Mean Res 0.9987 indicates high negative market sentiment; however, the retest of the newly created Mean Res 0.9780 is probable. As specified in the EUR/USD Daily Chart Analysis For Week of October 7, the main downside targets continue to be our Key Sup 0.9595 and completed Inner Currency Dip 0.9570. Continuation to the next Outer Currency Dip of 0.9370 is in the making.

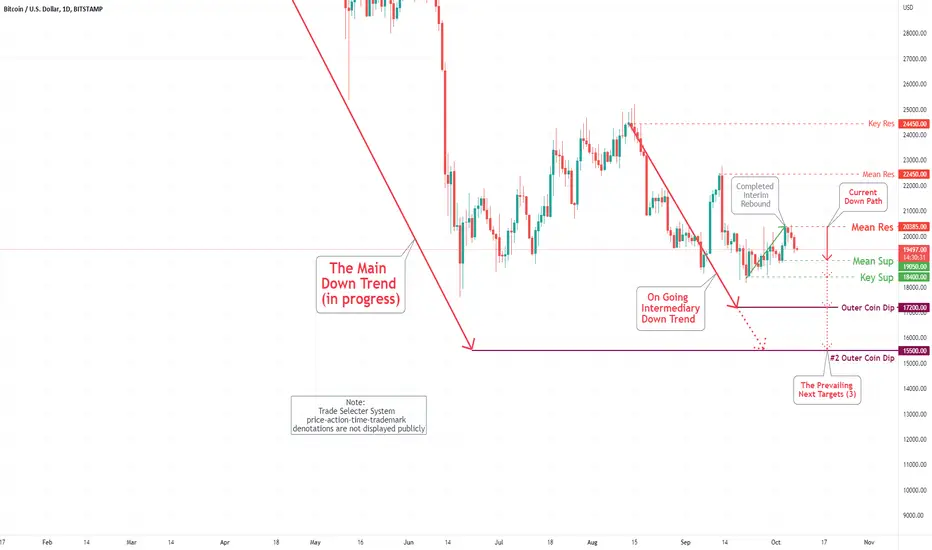
Bitcoin (BTC/USD) Daily Chart Analysis For Week of Oct 14, 2022Technical Analysis and Outlook:
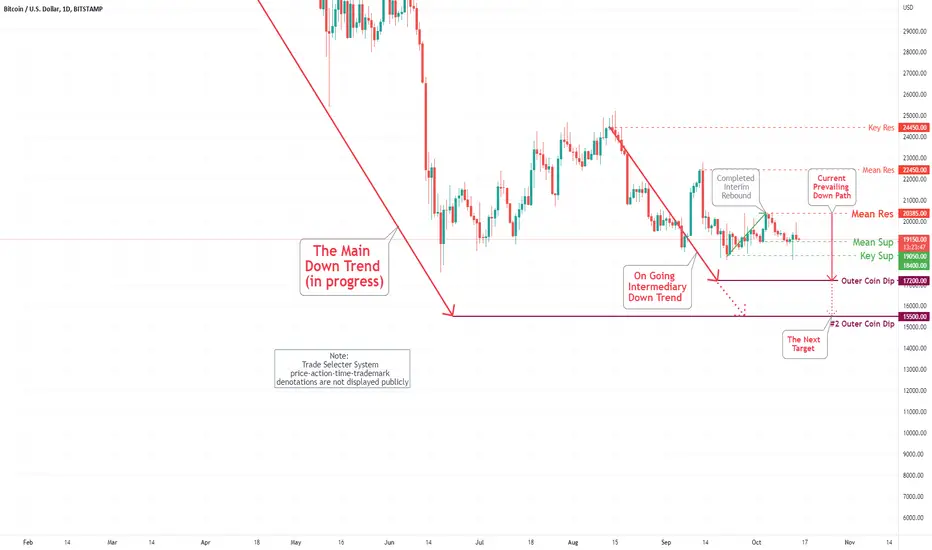
The Bitcoin completed down movements to targets of Mean Sup $19,050 and Key Sup $18,400 as specified Bitcoin (BTC/USD) Daily Chart Analysis For October 7, with the possibility of extending to the prevailing move to #2 Outer Coin Dip at $15,500 is much greater at the current market sentiment. The case of the short-term upside move to the Mean Res $20,385 is low.
Rates Rise Building Permits Decline Recession FollowsHere's a chart of the relationship between building permits (which come out this week) interest rates, and recessions.
When rates rise permits drop and recession follows.
This week's building permit numbers could be are not likely to be good.

NIFTY 50 NOT IN RECESSION!! DETAILED ANALYSISi have used a great colour to present my analysis.
so please go through the colours carefully.
INDIA is clearly not in recession, this makes us to understand its bottom point. lets start:
THE TWO BLUE LINES: represents the trend followed by NIFTY post corona's bull run.
and through drawing the PURPLE LINE, i have marked the bottom, and its area(sorry for the bad drawings :p)
i had followed the analysis by describing how that point i have marked is the recession point.
have a look at ORANGE LINE, its the bull run trend. after the bull run completed markets have consolidated(THE ORANGE CIRCLE)
FII entering in INDIAN markets made nifty to rise a more(till the orange circle)
DEFINING more about, THE ORANGE LINE, past from 23rd march till 12th April, nifty was on left side of the orange line, after that it came to other side. just a short observation of saying bull run got completed. (arrows are drawn have a good look).
THE TWO GREEN LINES are the support lines. now have a look at THE PURPLE ARCS. INDIA was not in a recession from the start so, it has just touched its support line, and never entered in recession. the same situation is now too.
check, THE DARK BLACK LINE, its the support line(which is supported many a times).
FINALLY, i conclude my analysis, where i have described how and where nifty 50 is in its position. i will post soon about its further trend lines(resistance and support).. stay connected!!

S&P 500 Daily Chart Analysis For Week of October 7, 2022Technical Analysis and Outlook
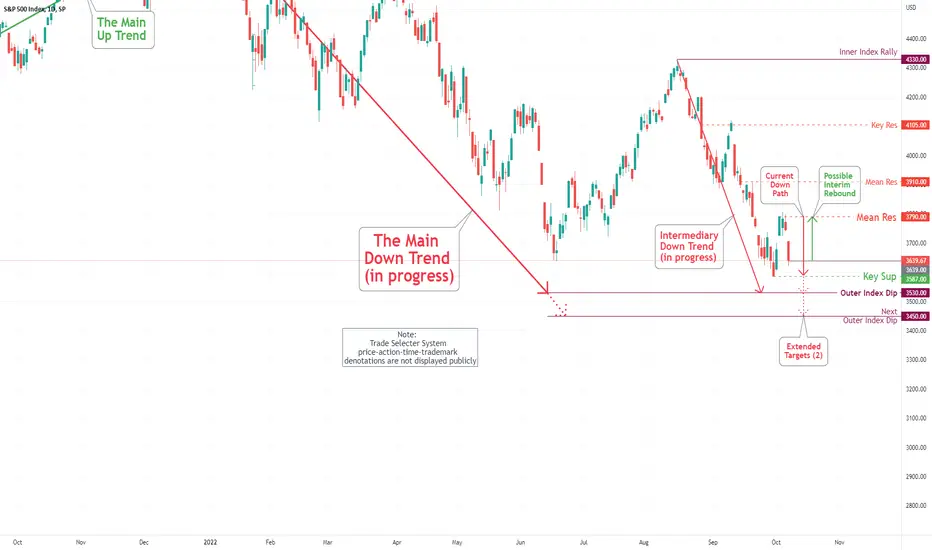
Repeated dead-cat moves to Mean Res 3720 and Mean Res 3775 - the letter partially fulfilled last week (as pointed out on S&P 500 Daily Chart Analysis For September 30) was in order throughout the trading week. Short-term moves leading to the newly created Mean Res 3790 are possible. Currently, on the downside, the main target is Key Sup 3587, and Outer index Dip 3530 - Next Outer Index Dip 3450 is in the making.
EUR/USD Daily Chart Analysis For Week of October 7, 2022Technical Analysis and Outlook:
The Eurodollar attempted to retest our Mean Res 1.0040 after breaking out thru Mean Res 0.9835. There is a possible short-term upside move to the newly created Mean Res 0.9987. On the downside, the main target is our Key Sup 0.9595 and completed Inner Currency Dip 0.9570. Continuation to the next Outer Currency Dip of 0.9370 is in the making.
Bitcoin(BTC/USD)Daily Chart Analysis For Week of October 7, 2022Technical Analysis and Outlook:
The Bitcoin completed our interim rebound as specified Bitcoin (BTC/USD) Daily Chart Analysis For September 30. On the downside, the main target is our newly created Mean Sup $19,050, Key Sup at $18,400, and the next Outer Coin Dip at $17,200, with the possibility of extending to the prevailing move to #2 Outer Coin Dip at $15,500 - There are possible short-term upside moves to Mean Res $20,385.
Bitcoin bull run when DXY tops out ⁉️Bitcoin bull run when DXY tops out ⁉️
Nice BTC behavior when the US Dollar Index left the overbought area on the weekly RSI
If DXY follows the downwards channel a Crypto bull run might occur 🟢
Comments & FOLLOW appreciated 🤗
*not financial advice
do your own research before investing

Tons of reasons to FEAR but some short term bounce signs show1/
There's a ton of fear atm
#CreditSuisse & #Deutsche_Bank all over $TWTR
How can anyone be bullish?
We warned from last year about the coming #MOAC(Mother of All Crashes) BUT short term there are signs of +, #crypto @ least is holding, needs to lead
$BTC #BTC #Bitcoin
Will only post partial

US10Y-US02Y - compare RVGI indicator❌cross and BitcoinUpdate on US10Y-US02Y...
compare RVGI indicator❌cross and Bitcoin
Not a cross yet in the extreme area of this indicator that would mark a quite good entry for BTC
But the next cross for a possible Entry point is ahead dear Crypto Nation 💥🚀😎
Comments & FOLLOW appreciated 🤗
*not financial advice
do your own research before investing

S&P 500 Daily Chart Analysis For September 30, 2022 Technical Analysis and Outlook
Repeated dead-cat moves around completed Inner Index Dip 3760 were in order throughout the week, along with the partial completion of our interim rebound target to Mean Res 3775. On Friday, the index penetrated the Inner Index Dip 3760 and is on its way to our next specified target Outer index Dip 3530 - Possible short-term moves are leading to Mean Res 3720. Next Outer Index Dip 3450 is in the making.

EUR/USD Daily Chart Analysis For September 30, 2022Technical Analysis and Outlook:
On Friday, the Eurodollar completed our Interim Rebound as specified on EUR/USD Daily Chart Analysis For September 23, after a repeated hit of our completed Inner Currency Dip of 0.9570. On the downside target is retesting the newly created major Key Sup 0.9595 and once again completed Inner Currency Dip 0.9570. Continuation to the next Outer Currency Dip 0.9370 is in the making - There are possible short-term dead-cat bounce moves.

Bitcoin (BTC/USD) Daily Chart Analysis For September 30, 2022Technical Analysis and Outlook:
The Bitcoin completed our interim rebound as specified Bitcoin (BTC/USD) Daily Chart Analysis For September 23. On the downside, the main target is our Key Sup at $18,400 and the next Outer Coin Dip at $17,200, with the possibility of extending to the prevailing move to #2 Outer Coin Dip at $15,500 - There are possible short-term upside moves.

Reverse of Bitcoin🟠and the Trimmed Mean PCE⚫️inflation rateUpdate:
The Trimmed Mean PCE inflation rate still rising
See the reverse of Bitcoin🟠and the Trimmed Mean PCE⚫️inflation rate
Love to keep you updated dear Crypto Nation?
Comments & Follow appreciated 🤗
*not financial advice
do your own research before investing

Bitcoin connection to United States Chicago PMI 💥😉Bitcoin connection to United States Chicago PMI - measuring performance of manufacturing and non-manufacturing sector in Chicago
Look how strong BTC behaved in PMI uptrends and partly even in downtrends
What to expect at next PMI uptrend ⁉️
COMMENTS & Follow appreciated💥😉
*not financial advice
do your own research before investing

ZB1! is Down 11.77% Since The last Selling Signal Dear investor, My idea of going against ZB on the 20th of July is to have a big win, since then the 10-year treasury bund is down more than 11% with 520 pips in the pocket.

DXY OUTRAGE!At the moments FED authorities are blowing in the fire,
but there is no more fuel remained, unless they would explode Economy!

Thailand vs USA- A good point for Tourism in Thailand, the country could get much more US/EU customers in 2022-23.
- in return it will be much more pain for Thai Peoples to visit USA and EU. (Euro is weak vs USD, but strong vs THB).
- Tourism still remain a big economic factor for Thailand, and much more important right now, after Covid Pandemic.
- The big problem is : Economy not only based on Tourism.
- Importations will be much more expensive for Thailand, and they will get much less profits for exportations.
- Thailand is the biggest exporter of natural rubber in the world ( around 14B annual ).
Scenarios :
- if DXY breakout his bullish trend and reach 120ish, we could expect to have 1$ = 39 to 41 THB
- A panic sell of riches peoples and companies could lead to transform their THB to USD. Then THB could back to 2001 situation, 1$ = 45ish THB.
Happy Tr4Ding !

USDCAD - ShortShort opportunity possibly coming up. We could break this zone subject to how poor the Canadian economy really get's to the end of this year and into the new year - US will also struggle BUT how much worse or better?
