MARCH MADNESS (Major historical event key dates and price areas)The patterns are there if you look close enough you will see them.
EVERY MAJOR ECONOMIC HISTORICAL EVENT HAPPENED IN MARCH.
EVERY SINGLE ONE.
- We are not in a recession. The recession has not started yet but it is imminent.
Something to keep in mind is when the economy is in a recession the dollar deflates not inflates and unemployment rises.
Something big is going to happen March of 2003. Just like March of 2020 (Corona Virus)
My guess is the planned "Russian hacks" will begin in the United States initiating a war crime agains the US thus commencing a new WWIII
***(Keep in mind the Russians have already hacked a MAJOR United States cyber security company as of mid 2021)***
All major historical events have always been and will continue to be orchestrated and planned.
Brace yourselves, .March of 2023 might be the start of the new Great Recession.
Reference the dates and historical events on the chart. I can't make this stuff up.
-Lomeli
Economy

S&P 500 Daily Chart Analysis For July 15, 2022 Technical Analysis and Outlook
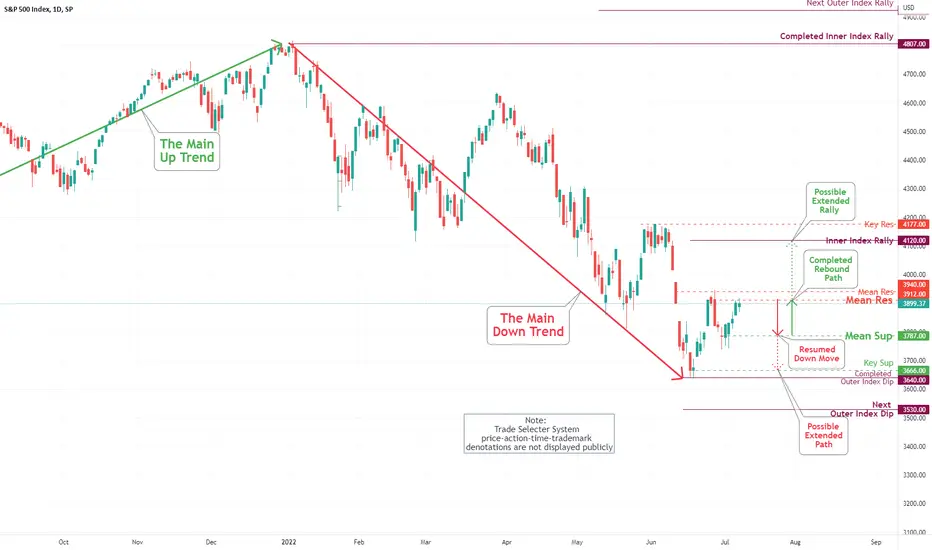
The S&P 500 market played out our down move to Mean Sup 3787 (See: S&P 500 Daily Chart Analysis For July 8). Currently, we have an upside momentum, and a retest of Mean Res 3912 is imminent, with a possible extended target to Mean Res 3940. Nonetheless, after that, the market will take us back to the Mean Sup 3787, completed Outer Index Dip 3728, Key Sup 3666, and very Next Outer Index Dup 3530 - this is a forward-looking mark.

EUR/USD Daily Chart Analysis For July 15, 2022Technical Analysis and Outlook:
The Eurodollar market completed Inner Currency Dip 0.9960. The market appears to be likely to retest our Mean Res 1.0185. Currently, Key Res 1.0270 is the major, primary upside target. An ultimate retest of Key Sup 1.0017 and Outer Currency Dip of 0.9960 is in the making.

Bitcoin (BTC/USD) Daily Chart Analysis For July 15, 2022Technical Analysis and Outlook:
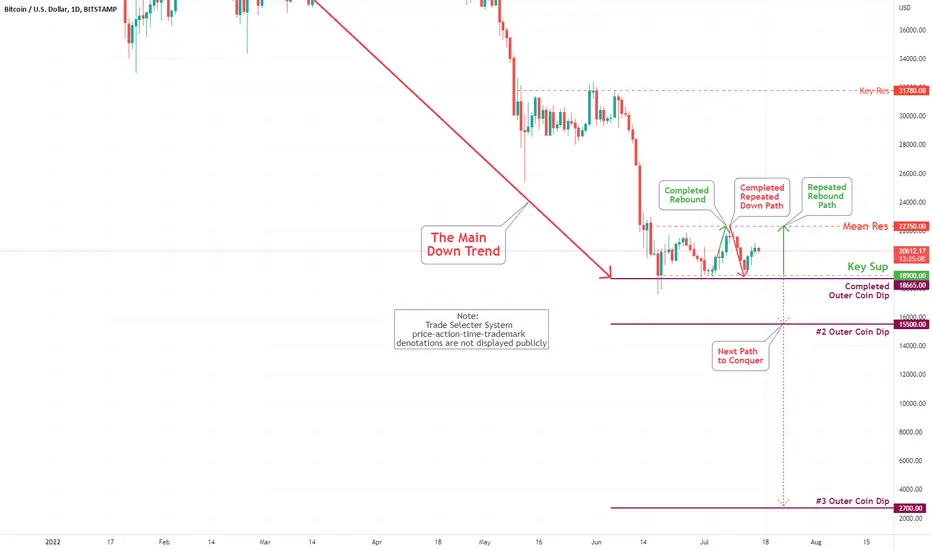
Bitcoin is trading above $20,000, bouncing off our Key Sup $18,900. The coin is facing up-take to the Mean Res $22,350 mark. If all fails, the coin will take us to the retest of Key Sup $18,900 and #2 Outer Coin Dip $15,500 mark once again, and down we go to #2 Outer Coin Dip $15,500.
Oof we probably in for a rough earning season and second half.Well CPI-U came in at 9.1%.
based on 1990s calculations that closer to 12.5% and
based on 1980s calculations that's closer to 17-18%
Just OOF. Guarantees FED won't go data dependent and then about face in their next meetings but honestly who thought they would...oh right everyone but bond traders.
Add to that the earning reports for Netflix, IBM, Twitter, Tesla, Google which have been hammered by the first half of the year already. It is not gonna be a fun few weeks.
So basically the FED probably hikes 0.75 or 1.00 and might actually break something this time France is forced to go non negative on rates leaving BOJ as the last sink hole of free money. I am still waiting on the data dependent turn around later this year to begin a new DCA and it just got delayed a few months while the employment numbers definitely don't get revised down from 370k at all.
Then once something breaks someones gonna have a nice little grabbed by the ear talk with JPOW before the November kerfuffle. But anyone remember how inflation and deflation in hyperinflationary scenarios comes in waves? This looks like wave #1.
Depending on reaction and overreaction of the FED, ECB, & BOJ in the next few years from just the fallout of the economic kerfuffle worldwide as it stands right now, is emense to say the least. Not to mention the effects come harvest when we actually figure out how deep the rabbit hole goes and knock on effects of fertilizer production for 2023.
All of which unsancrimoniously glazes over the Ukraine situation in a way that is dehumanizing to put it mildly. Sometimes I just hate people trying to make a buck. But welcome to the world someone built, wasn't me.
Hope that covers it for anyone living under a rock. Next two weeks = Baaaaaaaaad.
All the best stay sane we gonna need a few who aren't loony when the dust settles.

DXY (Dollar Index)Considering the political and economic situation of the world and also what the technical says, I expect the US dollar to continue to rise until the specified point. This will not bode well for the stock markets and they will likely continue their declines of the past few months.

EUR/USD Daily Chart Analysis For July 8, 2022Technical Analysis and Outlook:
The Eurodollar market completed Inner Currency Dip 1.0074. The market appears to be likely to fall to retest Key Sup 1.0100 and completed an Inner Currency Dip 1.0074. Currently, Mean Res 1.0270 is the primary upside target. An ultimate Outer Currency Dip of 0.9765 is in the making.

S&P 500 Daily Chart Analysis For July 8, 2022 Technical Analysis and Outlook
The S&P 500 market played out our down move from Mean Res 3912 (See: S&P 500 Daily Chart Analysis For July 1). Currently, we have a down move target specified at Mean Sup 3787, with a possible extended target to Key Sup 3665. However, if all fails, the market will take up the Inner Index Rally 4120 - Major Key Res 4177 is also a forward-looking mark.
Bitcoin (BTC/USD) Daily Chart Analysis For July 8, 2022Technical Analysis and Outlook:
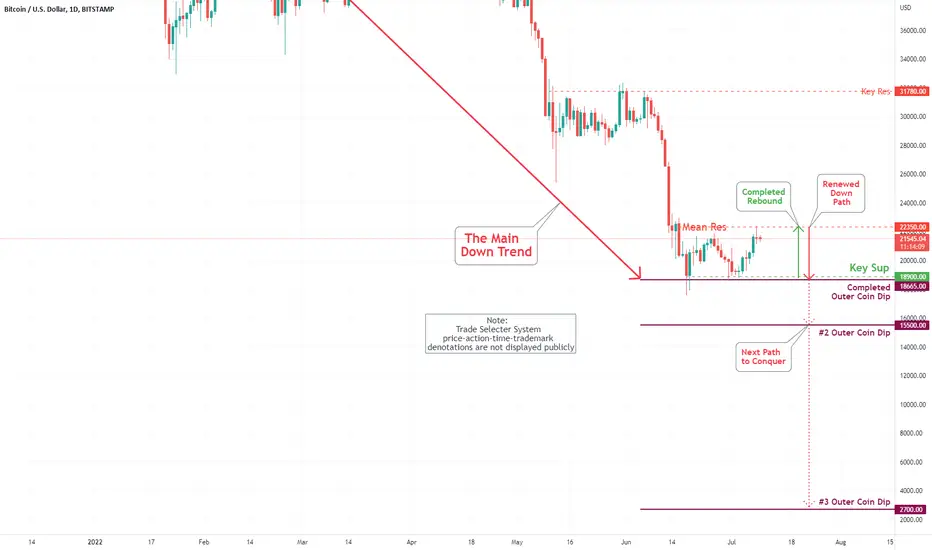
Bitcoin is trading under Mean Res $20,350 - the current path is to the downside revisiting our Key Sup $18,900 and completed Outer Coin Dip $18,665. The coin is facing take-down to the #2 Outer Coin Dip $15,500 mark.
oil !Hi again
I think oil will keep going down for a couple of weeks
the primary support is 92 daily close under it could take us to 88 or even 82.
I'm bearish for the short-term but bullish med and long term the oil target steel around 144 as I published before.

SPX - Calculating the odds of a RecessionUnderstanding the possibility and consequences of a recession by determine the strength of U.S Economy using key economic indicators
GDP - In order to sustain the economy consumption must be increased meanwhile, Fed trying to tame inflation by implementing policies that will
going to reduce the demand. Ergo, The GDP is expected to fall by 1.25 next quarter.
UNEMPLOYMENT RATE - Every time a huge trend of layoffs starts 45 days prior to a recession. at this point, No major corporate layoffs have taken
place and currently the unemployment rate is at historically low levels.
INFLATION RATE - High oil prices, Supply Chain disruption, Hyper inflation risks across the globe and most importantly higher interest rates, There
is no doubt that inflation rate will counting rising.
CONSUMER SENTIMENT INDEX - Current level is below 60 which reflects lower consumer confidence which will result in lower consumer spending
DOLLAR's PURCHASING POWER - U.S Dollar getting stronger against other fiat currencies, However it's purchasing power is eroding, High interest
rates have strengthened the U.S dollar and it's expected to continue rising.
10-Year Treasury Constant Maturity Minus 2-Year Treasury Constant Maturity - Short term vs Long term treasury inflows, Whenever yield nears the
zero or becomes negative then recession follows.
Federal Funds Rate - Interest rates are expected to hit 3.75% by the end of this year, There will be several rate hikes in the following months that will result in global economic slowdown.
Geopolitical Risk - Disruption of world order has already begun with Russia's Invasion of Ukraine, Growing risks of China and Taiwan conflicts, Shri Lanka's Crisis, Turkey's Hyperinflation risk and if U.S economy crashes then a new world order is imminent.
Conclusion: Current Health status of U.S economy is bearable However, projection for upcoming quarter is uncertain,
the most optimistic part is low unemployment rates, Financially strong businesses and Strong households
with higher savings rate, in turns following rate hikes cannot be associated with an inevitable recession.
Health care and defense sectors with high dividend yield stocks are greater alternatives to invest in.

S&P 500 Daily Chart Analysis For July 1, 2022 Technical Analysis and Outlook
The S&P 500 market played out our down move from Mean Res 3940 (See: S&P 500 Daily Chart Analysis For June 24). Currently, we have
bounced-up movement targeted at Mean Res 3912 and retest of 3940 - With the extended possibility to Inner Index Rally 4120. However, if all fails, the market will take us down to the newly created Mean Sup 3785, with the opportunity of retesting Key Sup 3666.

Bitcoin (BTC/USD) Daily Chart Analysis For July 1, 2022Technical Analysis and Outlook:
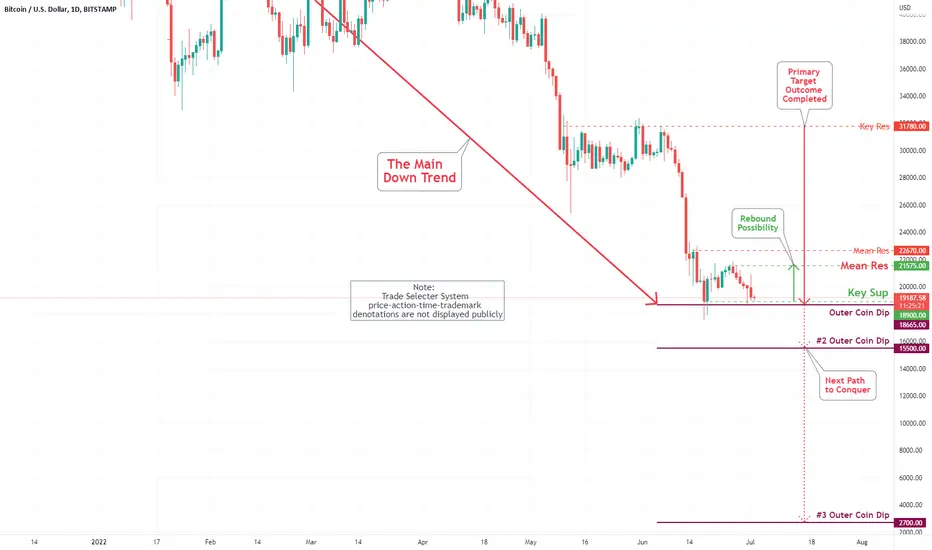
Bitcoin is trading at under $20,000 as it is waiting for oxygen therapy - with the possibility of making advancements to Mean Res $21,575 and a low probability additional rally to Mean Res of $22,670; currently sitting at our of Key Sup $18,900. The coin is facing take down to the #2 Outer Coin Dip $15,500 mark.
EUR/USD Daily Chart Analysis For July 1, 2022Technical Analysis and Outlook:
The Eurodollar market pushed the 1.04 mark on Friday - Our Key Sup 1.038 was the primary show stopper. The market appears to be likely to fall to an Inner Currency Dip of 1.031, and an ultimate Outer Currency Dip of 0.9765 is in the making.

Bitcoin (BTC/USD) Daily Chart Analysis For June 24, 2022Technical Analysis and Outlook:
Since the June 18th completion of our Outer Coin Dip of $18,665, the Bitcoin is advancing slowly to our Mean Res of $22,670; however, if all fails, the coin will take us to the retest of Key Sup $18,900 and #2 Outer Coin Dip $15,500 mark.

EUR/USD Daily Chart Analysis For June 24, 2022Technical Analysis and Outlook:
The Eurodollar market has been trading under our Mean Res 1.077 and is possibly poised to move higher to the Inner Currency Rally 1.0678. The top Key Res 1.077 is the main show stopper. However, the Inner Currency 1.031 and ultimate Outer Currency Dip 0.9765 is in the making.

SPY either outlier or on perfect course You can see there is a strong difference between the real cyclical bear market and the current correction. Also the primary bull market last 25 years last time from 75' till the 00'. We are now at around half cycle (13 years in). Last cycle SPX did 20x since cycle low the cycle before was around 13x (if data reliable), now we have just done 6x really underperforming. The 52 weeks MA has been the support of the bull market cycle as you can see in the chart. Hence I doubt the current correction will last for much more.

SPY trading made simpleInside bar is the western term for harami...which is a reversal pattern. The more inside towards the opening of the candle is the spinning candle the more significant and higher it is the probability of the reversal...however the suggestion is always to wait and buy/sell on the breakout of the high/low.
FOLLOW SHARE, LIKE AND COMMENT

DXY macroview for 2022 - Will the history repeat?This analysis has a lot to look at.
Lets begin with the DXY at the end of the 70s, those times my parents were just born, so I had to do research.
The US 70s crisis. According to the information I gathered, this crisis was due to the trade balance deficit. A strong speculation against the dollar appeared due to the American economic weakness.
In March of 1985 the DXY crashed 52% and by September of 1992 a bounce happened, this bounce took the DXY to the 0.5 Fib Retracement level, and when this level was reached, the .com bubble took place.
In January of 2002 until February 2008 the DXY crashed 41% very similar to the previous scenario.
(To make this easier to understand I drew a path using dotted lines, the pattern is similar except on the timing aspect.)
So I think that the DXY will reach the 0.786 level area and then … darker days will come.
I'm also considering the “The typical big cycle behind empires rises and declines” by Ray Dalio and also the fact that every 100 years empires suffer.
83 years have passed since the start of WWII, this war marked the beginning of the American empire, this means that we are 17 years away from the 100 anniversary, these 17 years coincide with the emergence of China as the 1st world power.
This is all I have to say for this analysis, I appreciate your attention

EMAS crossing once again, have we just had the BTC bottom>21 and 100 EMAs have located previous btc bottoms last cycles, is this time a signal to confirm this trend?

Btc potential moveif btc close below 19k this weekend, i can sey the next week will be historical.
there are to supports waiting for the btc fist one is between 18k-16900 , and the second is between 13900 and 11800.
Not forgetting what is going on in the global economy, the Federal Reserve continues to raise interest rates, which will cause investors to sell their positions in riskier assets ( crypto , stocks) and lead to a significant drop in these markets.
These investors will prefer to put their money into bonds that the federal government will print at higher yields.
that is my personal opinion.

S&P 500 Daily Chart Analysis For June 17, 2022 Technical Analysis and Outlook
In the week's trading, the S&P 500 market dropped 5.8 percent and completed our Outer Index Dip 3640. Upon verification (In progress), expect the rebound to Mean Res 3788; however, if all fails, the index will take us to the next Outer Index Dip 3530 mark.

Bitcoin (BTC/USD) Daily Chart Analysis For June 17, 2022Technical Analysis and Outlook:
This week was marked by sharp declines and panic in the Bitcoin market. Bitcoin's trending price action hit our Outer Coin Dip at $18,665. With this primary path completed, upon verification (In progress), expect the rebound to Mean Res $22,670; however, if all fails, the coin will take us to the #2 Outer Coin Dip $15,500 mark.
