Bitcoin(BTC/USD) Daily Chart Analysis For Week of April 18, 2025Technical Analysis and Outlook:
During the price movements observed throughout the week, Bitcoin has remained close to the previous Mean Support level of 85200 and appears poised to initiate an upward breakout, targeting the newly developed Mean Resistance level of 86400. This breakout may facilitate a retest of the completed Interim Coin rally at 88400, with additional expansions of targets also being a possibility. It is critical to acknowledge that potential for downward momentum may arise from a rechallenge of either the Interim Coin Rally at 88400 or the Mean Resistance at 86400.
Economy

WILL THE S&P 500 COME CRASHING DOWN? TRIPLE RSI DIVERGENCE?!S&P 500 (SPX) Is considered to be one of the primary benchmarks for the U.S economy. Recently it appears to be showing a triple bearish RSI divergence, DMI indicating bearish with ADX above 20, and a bearish MACD on the 1 Month chart. The technical analysis seems to have a highly bearish hypothesis in my opinion. If we give some thought to Ray Dalio's Principles for Dealing with the Changing World Order , some haunting indicators appear to be forming. Could this just be a minor correction? Or is this the beginning of an extended economic downturn?
Disclaimer: Not financial advice.

$EUINTR - ECB Lowers Interest Rates by 25bps (April/2025)ECONOMICS:EUINTR - ECB Lowers Interest Rates by 25bps (April/2025)
ECONOMICS:EUINTR
April/2025
source: European Central Bank
- The European Central Bank lowered interest rates by 25 basis points on Thursday, as expected, marking the sixth consecutive cut since June and bringing the key deposit rate down to 2.25%.
Policymakers noted that the disinflation process is progressing well and dropped previous references to a "restrictive" policy stance, while cautioning that the growth outlook has worsened amid escalating trade tensions.

$GBIRYY - U.K CPI (March/2025)ECONOMICS:GBIRYY 2.6%
March/2025
source: Office for National Statistics
- The annual inflation rate in the UK slowed to 2.6% in March 2025 from 2.8% in February and below market and the BoE's forecasts of 2.7%.
The largest downward contributions came from recreation and culture (2.4% vs 3.4%), mainly games, toys and hobbies (-4.2%) and data processing equipment (-5.1%). Transport also contributed to the slowdown (1.2% vs 1.8%), largely due to a 5.3% fall in motor fuel prices.
In addition, prices rose less for restaurants and hotels (3%, the lowest since July 2021 vs 3.4%), mostly accommodation services (-0.6%); housing and utilities (1.8% vs 1.9%); and food and non-alcoholic beverages (3% vs 3.3%).
In contrast, the most significant upward contribution came from clothing and footwear (1.1% vs -0.6%), with prices usually rising in March as spring fashions continue to enter the shops.
Compared to the previous month, the CPI edged up 0.3%, slightly below both the previous month’s increase and expectations of 0.4%.
Annual core inflation slowed to 3.4% from 3.5%.

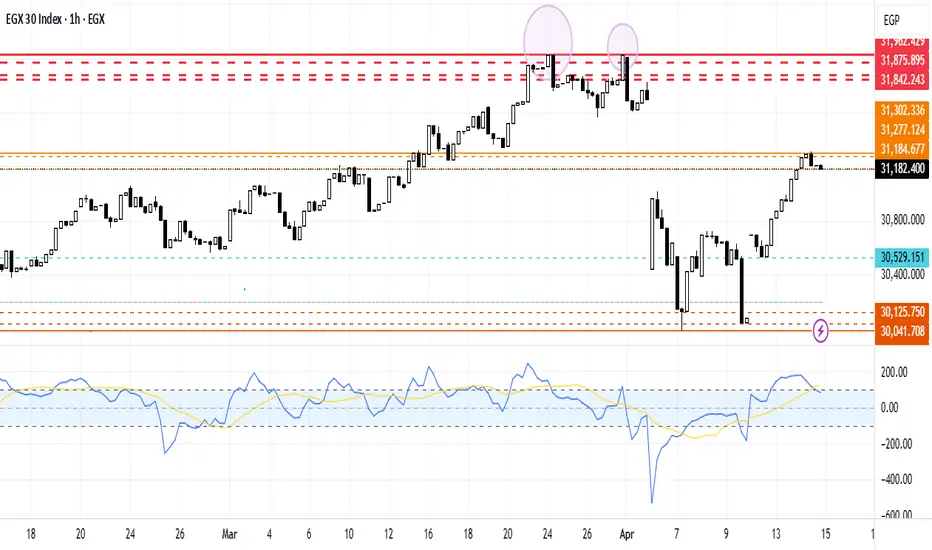
The Effect of US Tariff Exemptions on EGX30.EGX30 stock stabilized in a consolidation zone, failing to breach the 29991 support line. Despite breaking the 30041 support line to the downside, it corrected its upward trajectory between the 30529 support line and the 31302 resistance line, reflecting the bulls' dominance over the bears. This is because Egypt agreed to work towards a package of $7.5 billion in direct Qatari investments, according to a joint statement released by the Egyptian president's office on Monday. In addition, Egypt is pushing ahead with efforts to secure funding from Gulf neighbors and foreign partners as it seeks to tackle heavy foreign debts and a gaping budget deficit.
Price Action: S&P500 SPX Monday 4/14/2025In this video, we are looking at the S&P500 Index and its potential movement on the Daily Chart for Monday 4/14/2025.

SPX Fractal Expansion: New Highs Ahead Despite FearAs of April 14, 2025, the CBOE:SPX is exhibiting a clear fractal expansion, suggesting the beginning of a new bullish leg. The recent correction, which caused widespread panic, appears to have completed a fractal cycle reset, with price respecting historical support near 4704 and forming a new fractal edge around 5300.
Despite the fear-driven selloff, momentum indicators like RSI and MACD show signs of bottoming, and volume surged on rebound days, confirming strong institutional buying. The price is now testing temporary resistance at 5878, with a path open to reclaim all-time highs (6100+).
Global & Technical Tailwinds
Technical momentum is recovering across timeframes, with positive divergence on stochastic oscillators.
Breadth is improving: More stocks are participating in the rally, reflecting internal strength.
Sentiment has flipped: The VIX has cooled from panic levels (above 45), and investor fear is easing.
Macro support: Inflation is declining, and central banks are signaling potential rate cuts by late 2025.
Earnings outlook remains solid, and analysts forecast SPX to end 2025 around 6500–7100.
🔍Conclusion
The SPX is carving out a fractal mirror of past bullish reversals, reinforced by strong macro and technical context. Barring unexpected shocks, the index is likely to break above resistance and push toward new highs, even as residual fear lingers. The setup favors buying dips within this emerging structure.

S&P 500 Daily Chart Analysis For Week of April 11, 2025Technical Analysis and Outlook:
During the current trading session, the Index has recorded lower opening prices, thereby completing our key Outer Index Dip levels at 5026 and 4893, as previously highlighted in last week's Daily Chart analysis. This development establishes a foundation for a continuous upward trend, targeting the Outer Index Rally at 5550, with an interim resistance identified at 5455. Should this upward momentum persist, further extension may reach the subsequent resistance levels of 5672 and 5778, respectively. However, it is essential to note that a downward momentum may occur at the very significant completion target level of the Outer Index Rally at 5550, with the primary objective being a Mean Sup 5140 and retest of the completed Outer Index Dip at 4890.

EUR/USD Daily Chart Analysis For Week of April 11, 2025Technical Analysis and Outlook:
The Euro has demonstrated an exceptional rally during this trading week, revisiting and significantly enhancing its upper trading range by reaching an outer currency rally level of 1.142. Consequently, an intermediate price reversal has been identified, suggesting that the Eurodollar may continue to decline toward the support level at 1.128, possibly extending to the support level of 1.119. It is important to note that upward momentum may emerge from either of these support levels.

Bitcoin(BTC/USD) Daily Chart Analysis For Week of April 11, 2025Technical Analysis and Outlook:
In this eventful trading week, Bitcoin surpassed our key and completed Outer Coin Dip 78700 and another Outer Coin Dip 74500 target. As a result, we have robust rally development, and current development suggests a continuing rally as it aims to target a Mean Resistance level of 85200 and to retest the completed Interim Coin Rally 88400. There is also potential for additional target expansions. It is essential to note that a downward momentum may arise from the rechallenge of the Interim Coin Rally 88400 and/or the Mean Resistance at 75200.

$USIRYY -United States CPI (March/2025)ECONOMICS:USIRYY
(March/2025)
source: U.S. Bureau of Labor Statistics
- The annual inflation rate in the US eased for a second consecutive month to 2.4% in March 2025, the lowest since September, down from 2.8% in February, and below forecasts of 2.6%.
Prices for gasoline (-9.8% vs -3.1%) and fuel oil (-7.6% vs -5.1%) fell more while natural gas prices soared (9.4% vs 6%).
Inflation also slowed for shelter (4% vs 4.2%), used cars and trucks (0.6% vs 0.8%), and transportation (3.1% vs 6%) while prices were unchanged for new vehicles (vs -0.3%).
On the other hand, inflation accelerated for food (3% vs 2.6%).
Compared to the previous month, the CPI decreased 0.1%, the first fall since May 2020, compared to expectations of a 0.1% gain.
The index for energy fell 2.4%, as a 6.3% decline in gasoline more than offset increases in electricity (0.9%) and natural gas (3.6%).
Meanwhile, annual core inflation eased to 2.8%, the lowest since March 2021, and below forecasts of 3%.
On a monthly basis, the core CPI edged up 0.1%, below expectations of 0.3%.

$CNIRYY -China's CPI (March/2025)ECONOMICS:CNIRYY
March/2025
source: National Bureau of Statistics of China
- China's consumer prices fell by 0.1% year-on-year in March 2025, missing market expectations of a 0.1% increase and marking the second consecutive month of drop, as the ongoing trade dispute with the U.S. threatens to exert further downward pressure on prices.
Still, the latest drop was significantly milder than February’s 0.7% fall, supported by a smaller decline in food prices as pork prices accelerated and fresh fruit costs rebounded.
Meanwhile, non-food prices rose by 0.2%, reversing a slight dip of 0.1% in February, driven by increases in housing (0.1% vs 0.1%), healthcare (0.1% vs 0.2%), and education (0.8% vs -0.5%), despite a continued decline in transport costs (-2.6% vs -2.5%).
Core inflation, which excludes volatile food and fuel prices, rose 0.5% in March, rebounding from a 0.1% decrease in February. On a monthly basis, the CPI declined by 0.4%, a steeper fall than a 0.2% drop in February, marking the second straight month of contraction.

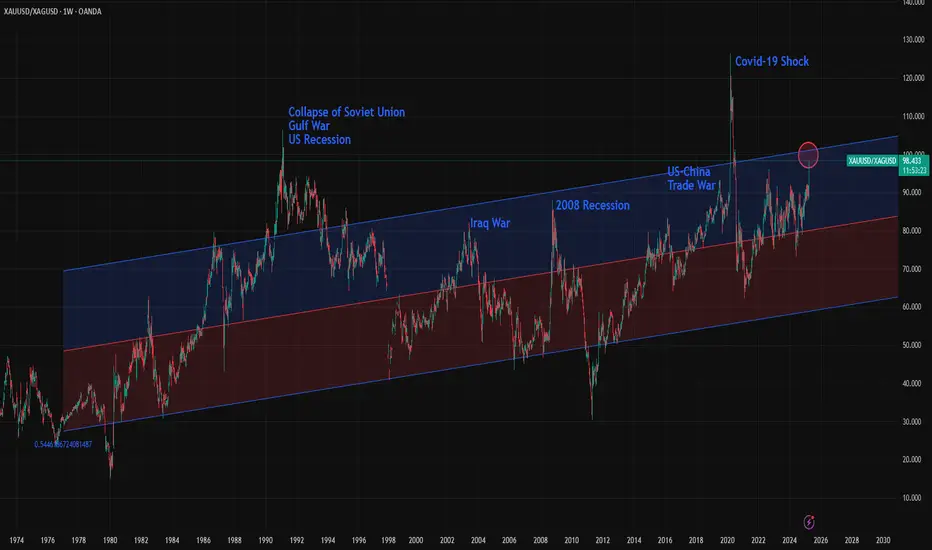
Gold/Silver Ratio Nears 100: What Does It Mean Historically?The Gold/Silver ratio is on the verge of reaching 100, an extremely rare level seen only at key historical turning points. The chart includes a 2,500-week linear regression channel, which shows that over the very long term, the ratio has been steadily rising, though at a slow pace. Occasionally, the ratio touches the 1.5 standard deviation line, and in rare, game-changing events, and sometimes it even breaks beyond that level.
Here are some of the key historical turning points marked by major spikes in the Gold/Silver ratio:
1- Early 1990s: The collapse of the Soviet Union, the Gulf War, and a U.S. recession pushed the ratio to 106. It remained above 1.5 standard deviations for more than two years.
2- 2002: Following the dot-com bubble burst, the 9/11 attacks, and the Iraq War, the ratio climbed to 82.6, nearing the 1.5 deviation line.
3- 2008 Recession: The global financial crisis triggered by the collapse of Lehman Brothers sent the ratio to 88.50. This spike sparked a major rally in both gold and silver, lasting until 2011 when the ratio reached one of its deepest bottoms.
4- 2019: The U.S.–China trade war under Trump’s first term pushed the ratio to 93, again nearing the 1.5 deviation threshold.
5- 2020 (COVID-19 Shock): The pandemic caused one of the biggest disruptions in modern economic history. Although relatively short-lived, its impacts were severe. The Gold/Silver ratio surged to 126 , marking the highest level in modern records, possibly the highest in all of history.
6- 2024–2025 (Global Trade War?): With the U.S. imposing major tariffs on key global trading partners, this could be another historic inflection point. The full impact is still unfolding, but risks of a serious global slowdown, or even a deep recession are rising. A full-scale trade war remains a real possibility.
Now, the Gold/Silver ratio is approaching 100 and nearing the 1.5 standard deviation line. It remains unclear whether this represents a powerful pair trade opportunity—"sell gold, buy silver"—or a structural breakout where the ratio stays elevated for an extended period. In either case market is showing that this is one of the rare turning point of global economy.
WILL GOLD MARK NEW ATH TRUMP TERRIF ALERT!🚨 GOLD UPDATE (XAU/USD)🚨
Gold is showing a strong bullish trend, and it’s expected to continue for the next month. 🌟 If you see any dips, buy in again and again! We could see gold touch 3200 soon, especially with the ongoing China & Trump tensions. The US economy remains strong, and fundamentally, gold is primed to soar even higher! 📈💥
After Trump's tariffs, gold may dip and sweep more liquidity before bouncing back stronger. ⚡ As China and Trump battle, US strength keeps pushing gold to new heights. 📊
Key Buying Zones 🔑:
- 3030 – 3035: Last zone for reversal 🔄
- 3000: Strong support zone 🚀
Targets 🎯:
- 3100 💰
- 3200 💎
- After 1 month: 3300 💥
⚠️ Always follow risk management⚠️

S&P 500 Daily Chart Analysis For Week of April 4, 2025Technical Analysis and Outlook:
During this week's trading session, the Index experienced lower openings, completing the Outer Index Dip at 5403, as highlighted in the previous week's Daily Chart analysis. This development lays a foundation for a potential decline targeting the Outer Index Dip at 5026, with the possibility of further extension to the subsequent target of the next Outer Index Dip, 4893. An upward momentum may materialize at either completed target level, with the primary objective being the Mean Resistance level of 5185.

EUR/USD Daily Chart Analysis For Week of April 4, 2025Technical Analysis and Outlook:
The Euro has experienced a notable increase, surpassing resistance levels at 1.086 and 1.095 in the current trading session, thereby completing the Inner Currency Rally of 1.114. However, an intermediate price reversal has been observed, suggesting that the Eurodollar will continue to decline towards the support level at 1.090, with a potential extension down to 1.075. An upward momentum could emerge from either of these support levels.

Bitcoin(BTC/USD) Daily Chart Analysis For Week of April 4, 2025Technical Analysis and Outlook:
In the course of this week's trading activities, we noted a successful retest of the Interim Coin Rally at 88400, with particular emphasis on the Mean Support at 82500. This development indicates the potential for an extension in a trajectory toward the previously established Outer Coin Rally at 78700. An upward momentum may originate from the Mean Support at 82500 and/or the Key Support at 79000/completed Outer Coin Dip at 78700.

UPS looking DOWNSNice head and Shoulders on the United Parcel Service
#UPS and FEDEX are the new dow transport indicator.
An underlying determinant of how the consumer is faring
Since the US is a consumer economy and Online shopping is the majority of retail
if we see new highs on the Indicies, and the home delivery carriers continue to deteriorate
it would give your non confirmation Top
Similar to Dow theory of new High's in the Industrials , but the transports lagging and indeed falling.

KRE Regional Banks In Trouble?KRE is starting to scream Danger! Wave 3 up ending. Multiple head and shoulders (one massive) the current uptrending is now starting to CRACK! signaling that the right shoulder will now start to form.
I see no benefit for bulls to hold on as risk is now very high. Furthermore, this is a bad sign for the overall economy and markets as regional banks are US domestic. Bad JUJU!
Don't be a dick for tick! ))

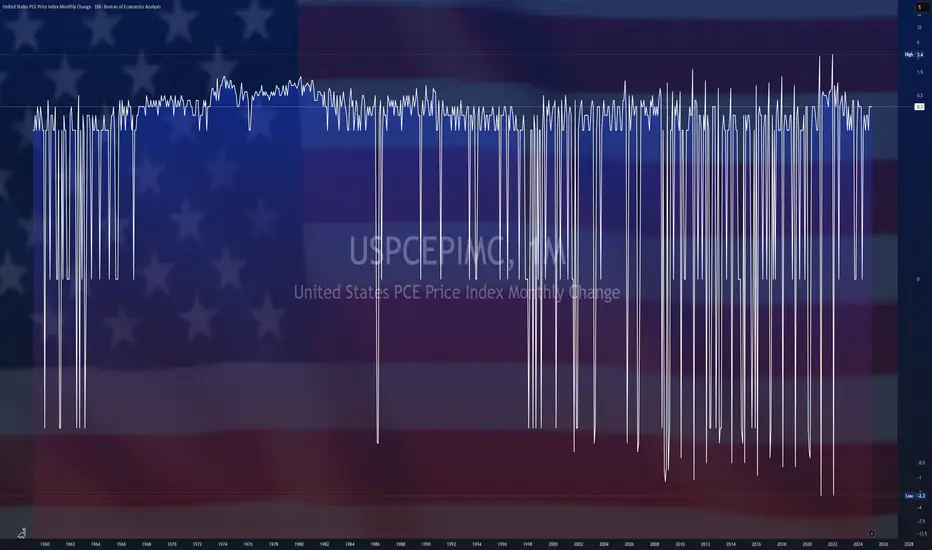
$USPCEPIMC -U.S Core PCE Inflation Rises More than ExpectedECONOMICS:USPCEPIMC
(February/2025)
source: U.S. Bureau of Economic Analysis
- The US PCE price index rose by 0.3% month-over-month in February, maintaining the same pace as the previous two months.
The core PCE index increased by 0.4%, the most since January 2024, surpassing the forecast of 0.3% and up from 0.3% in January.
On a year-over-year basis, headline PCE inflation remained steady at 2.5%, while core PCE inflation edged up to 2.8%, above the expected 2.7%.
S&P 500 Daily Chart Analysis For Week of March 28, 2025Technical Analysis and Outlook:
During this week's trading session, the Index gapped higher, passing our completed Inner Index Rally of 5712 and setting a Mean Resistance of 5768. This target was accompanied by considerable reversal, ultimately causing a downward movement. On the final trading day of the week, the Index underwent a pronounced decline, resulting in a substantial drop that surpassed the critical target of Mean Support set at 5603. The Index is positioned to retest the completed Outer Index Dip level of 5520. An extended decline is feasible, with the possibility of targeting the subsequent Outer Index Dip at 5403 before resuming an upward rally from either of these Outer Index Dip levels.

EUR/USD Daily Chart Analysis For Week of March 28, 2025Technical Analysis and Outlook:
The Euro has experienced a downward trend in the current trading session, surpassing the Mean Support level of 1.078, where an intermediate price reversal occurred. The analysis indicates that the Eurodollar is expected to retest the Mean Resistance level at 1.086, with a possible resistance level marked at 1.095. A downward momentum may be initiated from either the Mean Resistance of 1.086 or 1.095.

Bitcoin(BTC/USD) Daily Chart Analysis For Week of March 28, 2025Technical Analysis and Outlook:
Bitcoin underwent several significant peaks as it completed the Interim Coin Rally 88400. Subsequently, it experienced a decline, moving towards the Mean Support 82500, with the possibility of extending its trajectory to retest the previously completed Outer Coin Rally 78700. An upward momentum may be initiated from the Mean Support of 82500 or the Key Support of 79000/completed Outer Coin Dip of 78700.
