Bitcoin (BTC/USD) Daily Chart Analysis For April 15, 2022Technical Analysis and Outlook:
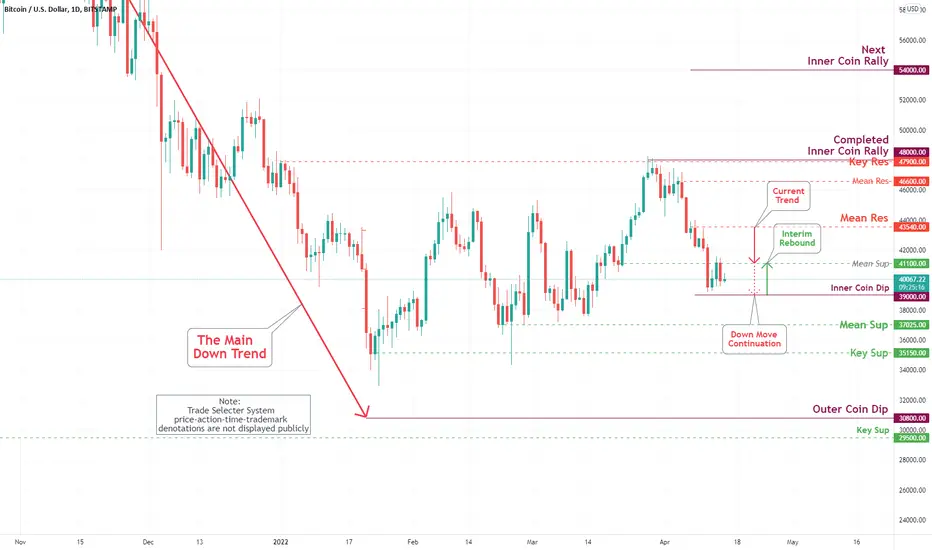
The bitcoin price experienced its most significant daily drop since February earlier this week and dipped below $40,000 on Monday, posting a low of $39,218; however, failing to fulfill our Inner Coin Dip 39,000 - the completion is anticipated. Bullish activities are possible within this movement.
Economy
S&P 500 Daily Chart Analysis For April 15, 2022 Technical Analysis and Outlook
The current downtrend is expected to continue to near-term Inner Index Dip 4337. Pending verification, the upside move to Mean Res 4447 is anticipated - some bullish activities are possible within this movement.

EUR/USD Daily Chart Analysis For April 15, 2022Technical Analysis and Outlook:
After retesting our Mean Res 1.093 and Inner Currency Dip, 1.082 since Monday price action did close lower to complete extended Current Completed Inner Currency Dip 1.077 suggesting a drop to Major Key Sup 1.069, and Next Inner Currency Dip 1.056 - to some extent bullish moves are possible within the current downtrend.

Recession warning on S&P500?The 2-year and 10-year Treasury yields inverted for the first time since 2019 . On Thu Mar 31st , the yield curve showed a possible warning signal that a recession could be happen at anytime, but the curve needs to stay inverted for a substantial amount of time before it gives a valid signal. People get excited about the yield curve because, historically it has been a good predictor of the onset of recession.
Against a backdrop of searing inflation, Russia’s War in Ukraine and a commodity shock, the relentless flattening of the yield curve and its predictive qualities has market watchers on edge.
Goldman Sachs Group Inc. sees the odds of a U.S. recession as high as 35% in the next year, while Grant Thornton’s Diane Swonk sees the twin blow of Fed tightening and higher oil prices potentially tipping the economy into a recession. The yield curve may serve Economists more than Investors, the key factor in the yield curve inversion is that, while it can often forecast darker days ahead for the economy, it is NOT a sell signal for those who invest in stocks

S&P 500 Daily Chart Analysis For April 8, 2022 Technical Analysis and Outlook
The current downtrend is interrupted with a mini-trend to Mean Res 4581 - some bearish moves are possible within this movement. The Near-term outlook is to complete Inner Index Dip 4337.

Bitcoin (BTC/USD) Daily Chart Analysis For April 8, 2022Technical Analysis and Outlook:
After embarking on a Key Res at $47,900 retest this month, Bitcoin has punctured coin sentiment by sliding into a direction to Mean Sup $41,100. After follow-thru to Inner Coin Dip, $39,000 is a high probability. Interim rebound to Mean Res $43,540 is also in play.

EUR/USD Daily Chart Analysis For April 8, 2022Technical Analysis and Outlook:
After the retest of our Key Sup 1.085, the Eurodollar is bound to rebound to Mean Res 1.093 and Mean Res 1.098 - some bearish moves are possible within the current uptrend.

4-8th April Economic Outlook!Hey traders,
Today we're going to be looking through this weeks economic calendar. We're going to look at what data is going to be released and what really is going to be affecting the market. I will also share my bias on the different pairs and the different data being released to see if any of these are going to be tradeable or whether or not we should just kind of stay out of the market during these times of uncertainty. I hope you enjoy this outlook into the week ahead. It's going to be a quiet week compared to recent times unless we get any breaking news coming out of Russia and Ukraine. In terms of economic data releases, it is going to be a little bit quieter than usual.
Monday - 4th April
We don't have too much happening in our favor on Monday. Here the biggest release is the unemployment change for Spain. While it may move the euro just a little bit, I'm not seeing a whole lot of tradeable opportunity. I think Monday is going to be a lot better just to kind of sit back and watch to see what happens.
Tuesday - 5th April
On Tuesday, we get a little bit more exciting. We have a fair bit of data being released for us.
🟨 AIG Construction Index
Early in the morning we have the AUD, AIG construction index. This index indicates how well the construction industry is actually running at the moment, it's not something we're going to trade, but rather it's good insight as looking ahead into the PMI, into our employment rates and then overall trade balance in the future. It is a good indication of how well the economy is running confined into that construction sector as it is a very large employer in Australia.
🟥 Cash Rate
Coming in a little bit later in the day, we have a very large, definitely tradeable event with the RBA rate statement and their overall cash rate. The forecast is for it to remain at 0.10%. I believe this will remain at 0.10%. I'm not expecting any shock announcements. However, in the event we do get a shock number come through, it's going to be a very volatile time and a possible opportunity to be able to catch a lot of pips on the Aussie dollar. If we do get a shock event on this, it will move for a few hours prior to entering into the European market so keep an eye on this release.
⬜ EUR
Looking ahead, we do get a lot of services PMI coming out for the euro, but not really looking to be trading that. I'd rather use that as an indication of how well the economy is running, looking ahead into future releases.
🟥 ISM Services PMI
The biggest standout is the ISM services PMI for the US dollar. Obviously the market is forecasting growth in the services industry. I'm not too sure how well that's going to stand. It's not something I usually trade. However, given the previous data releases, I'm unsure if it's going to be able to maintain its bullish forecast. We've been told that construction spending is down, the manufacturing PMI, while still expanding has slower growth than what it was first anticipated. Our nonfarm employment change was negative. There's a lot of different areas suggesting that we may not be as hawkish as what the forecast says. So I do expect this to come in a little less than what we're looking at currently but only time will tell.
Wednesday - 6th April
🟧 Crude Oil Inventories
This is going to be an interesting one. This is something I've been looking to try to look to how it affects the US dollar, but rather something I'm just overly intrigued about given the current circumstances in the world.
🟥 FOMC Meeting Minutes
FOMC meeting minutes is always volatile one. it is good to have a look through what the meeting discussed and how it went on. For users that don't know how this affects the market FOMC meeting minutes is a detailed record of the FOMC's most recent meeting, providing in-depth insights into the economic and financial conditions that influenced their vote on where to set interest rates.
Thursday - 7th April
🟨 AIG Service Index
Another AUD index release. We have the construction index earlier in the week, now we have the services index coming out. Once again it's not something I trade, however, it is fantastic insight into retail sales data. When we do get those retail sales announced next week, we can use this services index to give us a pivotal action point on where those retail sales are aiming, which is why I've noticed that in today's economic calendar, it's worth noting because we can make a preemptive play on the retail sales data release.
🟨 Retail Sales
The Euro retail sales expecting a little bit of an increase with the overall potential panic buying happening across Europe. It's going to be interesting to see what happens here. We massively missed the forecast in March. However, it is looking like they've been a little bit bearish while still forecasting growth of 0.6%. Banks are no longer aiming for the real high numbers, I think we're going to come in maybe around 1%, but I'm not putting money on that prediction, it is rather an assumption. I will have to do some more research and I recommend you do you same as well, having the services PMI come through this week from all the different countries within Europe is going to be a great insight into how well the economy is actually performing on the retail sales front.
Friday - 8th April
Nothing worth mentioning on Friday, the week is going to come to a slow stop. As I said, it is a bit of a slow week this week, only a few different data points worth noting, so we will end the week quite quiet. Obviously, we might have a bit more movement on the fundamental side of things next week but this week looks like it's lining to be a great technical analysis trading week. Always keep your eye on the whole Russia and Ukraine situation because anything can happen there and the market will react accordingly. Do keep your news streams live and in depth as you don't want to be caught off guard by anything going on over there.
These are personally just my outlooks having a look into the future week. Do note the data to keep an eye on when they are released and of course you can use the TradingView calendar as well to keep note on that. Have a fantastic trading week, I wish you all the best success.

S&P 500 Daily Chart Analysis For April 1, 2022 Technical Analysis and Outlook
The current downtrend is in play to Mean Sup 4455, while off-and-on uptrend to the newly created Mean Res 4630 is possible - This is a classic bi-directional price action movement.

EUR/USD Daily Chart Analysis For April 1, 2022Technical Analysis and Outlook:
After the retest of our Mean Res 1.1090, the Eurodollar continues its journey down as projected in March 25 chart to the newly created Mean Sup 1.0980. The continuous move down to Key Sup $1.0850 and completed Inner Currency Dip 1.0820 - some bullish moves are possible within the current downtrend.

The USD is showing strenghtThe US Dollar is showing strenght, being
over the 210, 70, and 14 MAs, with a strong
and bullish RSI (64+ weekly, 61+ daily) and
an important cross over in the weekly MACD
(210, 70, 14).
In terms of chartism, we are ending a bearish
trend channel that could be a fake break out,
so we will not necesarily find short-term bullish positions.
We could find bullish positions in leveraged ETFs
over the USD Index, but for now I will just take
into account the bullish trend of the most
important global asset and how could this affect
commodities, equities, bonds, and the global economy.

The Anatomy of a Bear MarketRecently, a lot of people have been talking about the possibility of a multi-year recession. I don't think that is a clear depiction of the current situation, but I am aware that the idea stems from a lack of understanding of bear market structures, and influence of market sentiment. So in this post, I'll be going over Ken Fishers' rules and conditions that must be met in order for a market to be clarified as a bear market, and how you can best position yourself to minimize downside risk.
This is not financial advice. This is for educational purposes only.
The Four Rules of a Bear Market
- The first rule is the two percent rule: a bear market typically declines by about 2% per month.
- Sometimes it declines by more than 2%, sometimes it’s less—but overall and on average, bear markets don’t often begin with the sharp, sudden drop some anticipate.
- If a bear does drop by more than 2% per month, there’s often a market counter-rally that can provide better opportunities for investors to sell.
- The three month rule: This rule advocates waiting three months after you suspect a peak has happened before calling a bear market.
- Rather than trying to guess when a market top might come, this rule ensures one has passed before taking defensive investment action.
- It provides a window of time to assess fundamental investment data, market action and possible bear market drivers.
- I often see lots of people call market tops and bottoms, and time the market perfectly, but it needs to be clearly understood that this isn't the right approach to understanding the market.
- Next, we have the the two-thirds / one-third rule.
- About one-third of the stock market’s decline occurs in the first two-thirds of a bear’s duration, and about two-thirds of the decline occurs in the final one-third.
- This was the case in the bear market caused by the financial crisis, as well as many other bear markets including that of 1973.
- Combining this with the three month rule, it also implies that if you have identified that a market has indeed begun its bear run, you might be better off taking profits/losses on your position, managing risk by increasing your cash holdings, and buying back when capitulation has happened.
- And finally, we have the 18-month rule.
- While bull market durations vary considerably, statistics demonstrate that the average bear market duration, since 1946, has only been 16 months.
- Very few in modern history last fully two years or longer.
- If you’re engaging a defensive investment strategy, you probably shouldn’t bet on one lasting so long.
- The longer a bear market runs, the more likely you’re waiting too long to re-invest.
- If you remain bearish for longer than 18 months, you may miss out on the rocket-like market ride that is almost always the beginning of the next bull run.
- Missing that can be very costly for investors.
So are we currently in a bear market?
- Based on the four rules above, there's a high probability that we are not in a bear market.
- Since I've uploaded this post, the market has bounced swiftly off the 100 moving average on the weekly.
- Just as the covid-induced drop of March 2020 turned out to be a 'buy the dip' opportunity, as opposed to the beginning of a bear market, the sharp correction we have seen since the beginning of this year goes against the first rule of the bear market.
- It’s critical not to call a bear market falsely, and this is a huge mistake that a lot of people make.
- If the market is just going through a correction (a short, sentiment-driven downturn of -10% to -20%), you’re better off riding through it and maintaining your portfolio.
- It is impossible to accurately and consistently time market corrections because of the way they behave.
- A correction can start for any reason or no reason. So if you believe that the economy is strong, and the fundamentals of the company you invest in remain solid, there's no need to sell off your holdings, especially when your actions are motivated by fear.
Conclusion
Bull market corrections are not fun, but it's important as an investor for you to be able to distinguish bear markets/recessions from bull market corrections. Choosing to undertake a bear market investment strategy and go defensive should be rare and shouldn’t be done by gut feel or by your neighbor’s opinion. Exiting the market is among the biggest investment risks you can take—if you’re wrong and you have a need for portfolio growth, missing bull market returns can be extremely costly.
If you like this educational post, please make sure to like, and follow for more quality content!
If you have any questions or comments, feel free to comment below! :)

S&P 500 Daily Chart Analysis For March 25, 2022 Technical Analysis and Outlook
The uptrend continues on its journey to retest our Mean Res 4590 while Mean Sup 4455 rests below with strong probabilities to be revisited afterward.

EUR/USD Daily Chart Analysis For March 25, 2022Technical Analysis and Outlook:
After the retest of our Mean Res 1.1090, the Eurodollar continues its journey down as projected in March 18 chart to Mean Sup 1.0900. The completed Inner Currency Dip 1.0820 is the latest extension - some bullish moves are possible within the current downtrend.

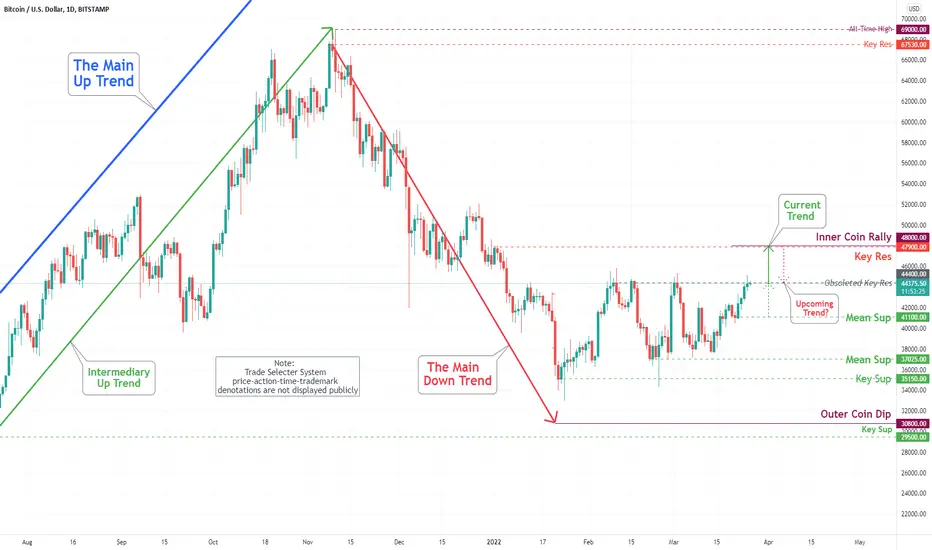
Bitcoin (BTC/USD) Daily Chart Analysis For March 25, 2022Technical Analysis and Outlook:
On Friday's session, the coin briefly traded above our Key Res $44,400 and obsoleted: a significant psychological price level, and continuously pushing to Key Res $47,900 and Inner Coin Rally $49,000.
S&P looking sketchyThis market has been pumping non stop for a couple years now, but it's foundations are just debt and printed money. I hope that the economy doesn't collapse because, well, that wouldn't be too fun, but with an RSI as high as this and a 25%+ gain YTD in the middle of a pandemic, I don't think this can go much further. Let's just hope that Jerome Powell stop's flushing the American economy down the drain.

TRON Grand Hackathon 2022 WINNERSTRON Grand Hackathon 2022 announced the winners of its Season 1 event. The panel of judges, which consists of eminent industry leaders, said they were pleased with the projects they received this season. They already await Season 2, where registration will begin on May 16, 2022.
Running from March 8 to March 11, Season 1 amassed over 120 submissions, all vying for the aggregate prize money of $500M spread between four tracks, Web 3.0, NFT, GameFi, and DeFi.
Season 1 Winners
In the GameFi Track, the winner is TronNinja Arcade by the TronNinja Team. TronNinja is an NFT GameFi project on the TRON blockchain where users will be able to use their NFTs as characters in-game while earning in-game tokens. Their goal is to bring back the social aspect that arcades had.
In the Web3 track, the winner is dCloud by Cctechmx. Their mission is to create an Open Source Web3 Cloud storage mobile app enabling its own ecosystem to enjoy a self-sustainable and shared economy.

S&P 500 Daily Chart Analysis For March 18, 2022 Technical Analysis and Outlook
The uptrend followed a four-day winning streak from our Mean Sup 4170, for the massive rise was stopped at Mean Res 4470, whereas the intermediate bullish move might continue to Mean Res 4590.

Bitcoin (BTC/USD) Daily Chart Analysis For March 18, 2022Technical Analysis and Outlook:
This week bitcoin climbed to Mean Res $42,000. Will the price finally break out to Key Res $44,400? - Stay tuned.

EUR/USD Daily Chart Analysis For March 18, 2022Technical Analysis and Outlook:
The Eurodollar retested our Mean Res 1.1090 and is prone to go down to Mean Sup 1.0900 - some bullish moves are possible to this retested and beat-up resistance level.

US500 Hello receive a cordial greeting. You have at your disposal a brief technical analysis of the S&P500 We have as the most likely scenario a lateral or slightly upward movement in the short term and in the medium term caution possible bearish movement. Key support and resistance are at your disposal.
Kind regards L.E.D.

US Dollar Falls after Hawkish Fed AnnouncemeToday's forex news: US Dollar Falls after Hawkish Fed Announcement
EUR/USD ⬆️
GBP/USD ⬆️
AUD/USD ⬆️
USD/CAD ⬇️
USD/JPY ⬆️
XAU ⬆️
WTI ⬇️
On Wednesday, the U.S. Federal Reserve raised interest rates to 2.5%, also preparing further measures to contain inflation. However, the hawkish attitude was not thorough enough to strengthen the dollar against most major currencies, with EUR/USD closing at 1.1032 and GBP/USD at 1.3145. Meanwhile, investors await the Bank of England’s Interest Rate Decision – which will be announced later today (17 March).
The AUD/USD pair saw a rise with the closing price at 0.7289, thanks to a positive job report indicating lower-than-expected unemployment rate at 4%, and an increase in gold prices at a closing price of 1,909.2, which is another response to the restrictive US monetary policy.
US dollar struck a six-year high at 119.12 against Japanese Yen, as the east Asian country experienced a 7.3 magnitude earthquake yesterday (16 March), investors look to a safe haven currency until the earthquake’s aftermath is settled.
Crude Oil, on the other hand, has settled lower at $95.04 per barrel. Since the US has increased its oil inventory, combined with optimism for other oil-producing OPEC members to increase supply, and China’s COVID outbreak slowing global consumption.
Major U.S. stock indexes have surprisingly rallied despite the Federal Reserve’s decision to increase borrowing costs.
United States 10-Year Bond Yield stabilized its rise, closing at 2.187%.
📱 Get instant market news delivered to you in real time on Mitrade

EUR/USD!Euro is weakening! What's NEXT?EUR/USD. The Euro began to fall against the Dollar due to Russia's attack on Ukraine. Conflict in Europe is a high risk and unpredictability of investment in the European economy leads to capital outflow to safer markets.
The outflow of capital from the EU goes to the U.S. market, which causes Euro to fall against the Dollar.
The price is now at 1.10 level and it is very close to the lows of 2016 when the price fell to a record low of 1.03.
If the key level of 1.06 will be broken, a false breakout of this level is very possible, as it shown on the chart.
Friends, push the like button, write a comment, and share with your mates - that would be the best THANK YOU.
P.S. I personally will open entry if the price will show it according to my strategy.
Always make your analysis before a trade.
