$JPINTR -Japan's Interest Rates (March/2025)ECONOMICS:JPINTR
March/2025
source: Bank of Japan
-The Bank of Japan (BoJ) kept its key short-term interest rate at around 0.5% during its March meeting, maintaining it at its highest level since 2008 and in line with market expectations.
The unanimous decision followed the central bank’s third rate hike in January and came before the U.S. Federal Reserve’s rate announcement.
The board took a cautious stance, focusing on assessing the impact of rising global economic risks on Japan’s fragile recovery.
The BoJ pointed to ongoing uncertainties in the domestic economic outlook amid higher U.S. tariffs and headwinds from overseas conditions.
While the Japanese economy had recovered moderately, some weaknesses remained.
Private consumption continued to grow, helped by wage hikes, even as cost pressures persisted.
However, exports and industrial output were mostly flat.
Inflation ranged between 3.0% and 3.5% yearly, driven by higher service prices.
Inflation expectations increased moderately, with underlying CPI projected to rise gradually.
Economy

Target | TGT | Long at $105.75Target NYSE:TGT
Strengths:
P/E: 11.82x
Earnings are forecast to grow 4.95% per year
Dividend: 4.24%
Better "value" compared to others (i.e. NYSE:WMT )
Insiders recently awarded options
May have double-bottomed (see weaknesses below...)
Weakness
Economic headwinds / recession concerns
Debt-to-equity: 1.09x (slightly high)
Several price gaps on the daily chart are open below the current price. If recession fears are valid and news to messages "tighter consumer spending", these gaps will likely be filled (all the way down to the GETTEX:50S ). One day these will be filled, but that would be a huge opportunity for long-term investors...
Thus, at $105.75, NYSE:TGT is in a personal buy zone.
Targets
$119.75
$137.00
$150.00

Credit Spreads - About to Blow?While credit spreads, which reached near-historic lows in 2024, remain tight, they have widened notably since the beginning of 2025. If this trend accelerates, it could put substantial pressure on the bond market, resulting in tighter financial conditions and corresponding headwinds for the domestic economy. The last 2-3 weeks have seen risk assets come under pressure, but the below chart suggests that the risk-off sentiment shift may still be early-stage... Whether viewed through a traditional technical lens or supply/demand, current levels could be considered supportive - risk is to the upside.
A few impacted ETFs: NASDAQ:IEF , NASDAQ:TLT , AMEX:HYG , AMEX:JNK
Jon
JHartCharts

S&P 500 Daily Chart Analysis For Week of March 14, 2025Technical Analysis and Outlook:
During the recent weekly trading session, the S&P 500 reached the designated target of the Outer Index Dip at 5576, showing considerable volatility. On the last day of the trading session, the index experienced a significant rebound, leading to an impressive upward trajectory from that position. As a result, it is now aiming for the Inner Index Rally target set at 5712, with a potential subsequent target identified at the Mean Resistance level of 5840. Therefore, upon reaching the Inner Index Rally target 5712, or if there is a decline from its current price level, the index is expected to retest the completed Outer Index Dip at 5521, potentially reinstating the upward rally.

Bitcoin(BTC/USD) Daily Chart Analysis For Week of March 14, 2025Technical Analysis and Outlook:
In the current week's trading session, Bitcoin has made multiple hits by retesting our completed Outer Coin Dip 78800 on Sunday and Monday. Consequently, the cryptocurrency has experienced a significant uptrend, reaching the inverse (Resistance) Mean Sup 84700 level. This upward oscillation indicates a potential for further price rally and suggests a likelihood of advancing toward the target designated as the Interim Coin Rally 88400. Such developments could facilitate an extension toward the supplementary target of Mean Res 94500 and beyond. If there is a decline from Interim Coin Rally 88400 or its current price level, the coin is expected to retest the completed Outer Coin Dip 78700, potentially reinstating the upward rally.

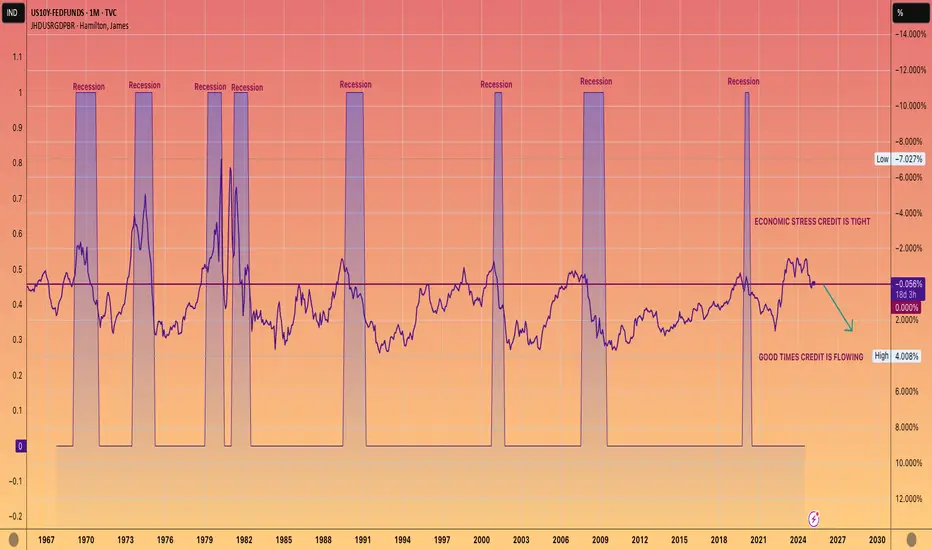
WE ARE COMING OUT OF A RECESSION. NOT GOING INTO ONE.This chart shows 10-year yield, which is closely tied to mortgage rates, minus the Federal funds rate.
When this figure is negative, it typically indicates that we are experiencing a recession or economic downturn.
Conversely, a positive number usually aligns with economic growth, often referred to as the good times.
While it's up to you to determine the reasons behind a official recession not being declared during the Biden administration, the undeniable data reflects a prolonged period of economic strain.
However, the current trend seems to be shifting towards a positive reading, which should lead to more accessible lending and economic growth.
AKA The good times are coming.
$USIRYY - U.S Inflation Rate Slows More Than ExpectedECONOMICS:USIRYY 2.8% YoY
(February/2025)
source: U.S. Bureau of Labor Statistics
- The annual inflation rate in the US eased to 2.8% in February below 3% in January and market expectations of 2.9%.
On a monthly basis, the CPI rose by 0.2%, slowing from 0.5% rise in January and below market expectations of 0.3%.
Core CPI also rose 0.2% on the month and was at 3.1% on a 12-month basis, both below consensus.

$CNIRYY - China's CPI DefelationaryECONOMICS:CNIRYY -0.7%
(February/2025)
source: National Bureau of Statistics of China
- China's consumer prices dropped by 0.7% yoy in February 2025, surpassing market estimates of a 0.5% decline and reversing a 0.5% rise in the prior month.
This was the first consumer deflation since January 2024, amid fading seasonal demand following the Spring Festival in late January.
Food prices fell the most in 13 months (-3.3% vs 0.4% in January), dragged by a steep decrease in cost of fresh vegetables (-12.6% vs 2.4%) and a sharp slowdown in pork prices (4.1% vs 13.8%).
Meanwhile, non-food prices edged lower (-0.1% vs 0.5%), as increases in housing (0.1% vs 0.1%) and healthcare (0.2% vs 0.7%) were offset by declines in education (-0.5% vs 1.7%) and transport (-2.5% vs -0.6%).
Core inflation, excluding volatile food and fuel prices, fell 0.1% in February, in contrast to a 0.6% rise in January.
Monthly, the CPI fell 0.2%, shifting from January's 11-month top of a 0.7% rise and marking the first drop since last November.
This fall was also steeper than consensus of a 0.1% decrease.

S&P 500 Daily Chart Analysis For Week of March 7, 2025Technical Analysis and Outlook:
In the recent weekly trading session, the S&P 500 successfully retested the Mean Resistance level of 5967; however, it subsequently experienced a significant decline. This decline brought the index back to the Mean Support level of 5860 and further down to the next major Key Support level of 5710. After this downturn, the index established a new critical support level at 5683. It is now positioned to target the Mean Resistance level of 5840. Should the index initiate an upward movement from its current position and successfully surpass this key resistance, it may continue to ascend toward the subsequent Mean Resistance level of 5955.
Conversely, suppose the index experiences a decline from the retested level of 5840. In that case, it will likely target the Mean Support level of 5683, with a further descent to an Outer Index Dip of 5576.

EUR/USD Daily Chart Analysis For Week of March 7, 2025Technical Analysis and Outlook:
In the preliminary phase of the Inner Currency Rally, the Euro achieved a significant milestone of 1.060 during the current week's trading session. Demonstrating an unprecedented surge in "dead-cat rally" sentiment, it subsequently completed our next targeted level of Inner Currency Rally of 1.086. As a result, the market has established a Mean Support target at 1.077, which the ongoing pullback indicates may be the next point of focus. This price movement may also lead to a further decline toward an additional Mean Support level of 1.057.
Conversely, should the anticipated downward trend fail to materialize, the Eurodollar may initiate an upward trend toward the Mean Resistance level of 1.091. This movement could aim for the ultimate Outer Currency Rally level of 1.124 in the near future.

Bitcoin(BTC/USD) Daily Chart Analysis For Week of March 7, 2025Technical Analysis and Outlook:
In the trading session for this week, we observed significant volatility characterized by considerable fluctuations, ultimately culminating in the completion of the coin Interim Coin Rally 94500. The coin experienced a substantial increase, reaching our Mean Resistance level of 92600, before encountering a steep pullback that resulted in its stabilization at the starting point of Mean Support of 84700.
This upward fluctuation indicates a potential for higher prices and suggests a likelihood of retesting the target Mean Resistance levels at 90600, coinciding with the conclusion of Interim Coin Rally 94500. Nonetheless, a retest of the Key Support level at 79000 and the completed of the Outer Coin Dip 78700 may occur prior to any further upward momentum.

$NIFTY: Nifty 50 – India’s Market Meltdown or Hidden Gem?(1/9)
Good Morning, folks! ☀️ NSE:NIFTY : Nifty 50 – India’s Market Meltdown or Hidden Gem?
Gift Nifty’s at 22,555, down 65 points, and the index is off 13% since October 2024! Is this a crash landing or a golden ticket in disguise? Let’s unpack the chaos! 🔍
(2/9) – PRICE PERFORMANCE 📊
• Gift Nifty: 22,555, down 65 points (Mar 6, 2025) 💰
• Recent Trend: 13% drop from Oct 2024 highs 📏
• Sector Mood: Autos, real estate dragging, per web reports 🌩️
It’s a bumpy ride, but bargains might be brewing! 🔧
(3/9) – MARKET POSITION 📈
• Index Weight: 50 top Indian firms, 65% of NSE market cap 🏅
• Scope: Spans 13 sectors, from banks to tech ⏳
• Trend: Bearish streak persists, down 13% since Oct 🎯
Still a heavyweight, but feeling the squeeze! 🌐
(4/9) – KEY DEVELOPMENTS 🔑
• Earnings Slowdown: Growth at 5%, down from 20%+ 🔄
• Macro Woes: U.S. tariffs, trade tensions spook investors 🌍
• Market Vibe: Gift Nifty signals a sour start 📋
Tough times, but sectors might shine through! 💡
(5/9) – RISKS IN FOCUS ⚡
• Geopolitics: U.S. tariff threats hit exports 🔍
• Sector Slump: Autos, real estate under pressure 📉
• Volatility: Bearish trend grips tight 🌪️
Rough waters ahead, but storms pass! 🛡️
(6/9) – SWOT: STRENGTHS 💪
• Diversity: 13 sectors, broad economic play 🏆
• Scale: Tracks India’s biggest players 📈
• Value: Potentially undervalued, per web buzz 🔩
A battered champ with fight left! 💼
(7/9) – SWOT: WEAKNESSES & OPPORTUNITIES ⚖️
• Weaknesses: 5% earnings growth, macro drag 📉
• Opportunities: Sector plays in banks, tech shine 📈
Can it dodge the punches and rally? 🤔
(8/9) – 📢Nifty at 22,555 (Gift), down 13%—your call? 🗳️
• Bullish: $24K soon, undervalued steal 🦬
• Neutral: Flatline, risks offset ⚖️
• Bearish: $20K next, bears rule 🐻
Vote below! 👇
(9/9) – FINAL TAKEAWAY 🎯
Nifty’s 13% slide and $116 Gift price signal trouble 📉, but undervalued sectors tease upside 🌱. Volatility’s our mate—dips are DCA fuel 🔥. Buy low, aim high! Hit or miss?

$EUINTR -Europe's Interest RatesECONOMICS:EUINTR
(March/2025)
source: European Central Bank
- The ECB lowered the three key interest rates by 25 basis points, as expected, reducing the deposit facility rate to 2.50%, the main refinancing rate to 2.65%, and the marginal lending rate to 2.90%.
This decision reflects an updated assessment of the inflation outlook and monetary policy transmission.
*The ECB acknowledged that monetary policy is becoming meaningfully less restrictive, easing borrowing costs for businesses and households.
Inflation is projected to average 2.3% in 2025, 1.9% in 2026, and 2.0% in 2027, with core inflation also nearing the 2% target.
Although domestic inflation remains elevated due to delayed wage and price adjustments, wage growth is moderating.
Economic growth forecasts were revised downward to 0.9% for 2025 and 1.2% for 2026, reflecting weak exports and investment.
*The ECB remains data-dependent and will adjust its policy as needed to ensure inflation stabilizes around its 2% medium-term target without committing to a specific rate path.

All Federal Employees To US PopulationI think it is important for people to full understand that the 172,000 job cuts from the Federal Government is more about showmanship than logic.
The federal gov employees as a % of the population has been falling for decades through the growth of the population and the economy.
This is the absolute best way to reduce gov. Debt, deficits, etc.. through growth, NOT cutting and causing a heart attack!
Slow mythological, calculated cuts if/when they are required are fine. chaotic, reactive, for the sake of showmanship is NOT!
This will not end well. There will be consequences, people have yet to realize and appreciate the severity of these actions.
These actions taken by the current administration will be felt in the markets.

Rate Cuts Are NOT BullishRate cuts in the US have never been bullish for equity markets in macro cycles. The idea that rates coming down from 5% to 4% suddenly making people more creditworthy is a farce because rates never move in anything other than large timeframe tides. These tides reflect growth/inflation expectations, not borrowing costs.
Were Jerome Powell to suddenly become very dovish at the next FOMC meeting it would be a clear signal that the SHTF protocol is in full effect. Powell is more likely to talk away the negative GDP prints as demand shocks due to tariffs/trade deficit imbalances while waiting for more data to make a decision. Labor market has been declining as well but he doesn't want to make a panic decision and also probably feels no personal loyalty to help President Trump out.
Historical average for US inflation is about 3.2% with the 2% target meaning deflation is a possible problem incoming. Current US inflation rate is about 3% which is well inline with the historical average. Powell will never say it but so far his mission has been accomplished. He may cut rates at the back end of the year if necessary but as of this post he has no reason to.

$USPCEPIMC -U.S Price Index (January/2025)ECONOMICS:USPCEPIMC 0.3%
(January/2025)
source: U.S. Bureau of Economic Analysis
- The US Personal Consumption Expenditures (PCE) price index increased by 0.3% month-over-month in January 2025, the same pace as in December, and in line with expectations.
Prices for goods increased 0.5%, following a 0.1% rise in December and prices for services rose at a slower 0.2%, after a 0.4% gain in the previous month.
Meanwhile, the core PCE index, which excludes volatile food and energy prices, rose 0.3%, slightly above the 0.2% gain recorded in the previous month, and also matching forecasts.
Food prices went up 0.3%, higher than 0.2% in December while cost of energy eased (1.3% vs 2.4%). On a year-over-year basis, headline PCE inflation eased to 2.5% from 2.6%, marking its first slowdown in four months. Similarly, core PCE inflation declined to 2.6%, its lowest level in seven months, from an upwardly revised 2.9%.

$USGDPQQ -United States GDP (Q4/2024)ECONOMICS:USGDPQQ 2.3%
Q4/2024
source: U.S. Bureau of Economic Analysis
- The US economy expanded an annualized 2.3% in Q4 2024, the slowest growth in three quarters, down from 3.1% in Q3 and in line with the advance estimate.
Personal consumption remained the main driver of growth, increasing 4.2%, the most since Q1 2023, in line with the advance estimate.
Spending rose for both goods (6.1%) and services (3.3%).
Also, exports fell slightly less (-0.5% vs -0.8%) and imports declined slightly more than initially anticipated (-1.2% vs -0.8%), leaving the contribution from net trade positive at 0.12 pp.
Government expenditure also rose more (2.9% vs 2.5%).
Private inventories cut 0.81 pp from the growth, less than 0.93 pp.
On the other hand, fixed investment contracted more (-1.4% vs -0.6%), due to equipment (-9% vs -7.8%) and as investment in intellectual property products failed to rise (0% vs 2.6%).
Residential investment however, rose more than initially anticipated (5.4% vs 5.3%).
Considering full 2024, the economy advanced 2.8%.

S&P 500 Daily Chart Analysis For Week of Feb 28, 2025Technical Analysis and Outlook:
In the recent weekly trading session, the S&P 500 did not succeed in retesting the Mean Resistance level of 6082. Instead, the index experienced a notable decline, reaching the Mean Support level of 5939 and narrowly approaching the Key Support level of 5827.
Following this downturn, a significant rebound occurred, resulting in the establishment of a new Mean Support level at 5860. The index is now positioned to target the Mean Resistance level of 5967. Should the index initiate an upward movement from its current level and successfully surpass the critical Mean Resistance of 5967, it may continue to rise toward the Mean Resistance level of 6032, potentially reaching the Key Resistance level of 6143.
Conversely, if the index declines from its present position, it may create a retest pullback to revisit the Mean Support level of 5860 before resuming further upward momentum.

EUR/USD Daily Chart Analysis For Week of Feb 28, 2025Technical Analysis and Outlook:
In the initial rally attempt in this week's trading session, The Euro failed to reach our target of Inner Currency Rally 1.060 due to prevailing bearish sentiment. As a result, the market established a Mean Resistance target of 1.041. The current trend suggests a continuation of the downward price movement toward our designated target of Mean Support at 1.030, and there may be a retest of the Completed Outer Currency Dip at 1.020 via Key Support at 1.024. Conversely, if the anticipated downward trend does not materialize, we may witness the Eurodollar retesting the Mean Resistance level of 1.041 and subsequently target the Inner Currency Rally level of 1.060.

Bitcoin(BTC/USD) Daily Chart Analysis For Week of Feb 28, 2025Technical Analysis and Outlook:
At the beginning of the week, Bitcoin was observed trading at a lower level, close to the Mean Support level of 95700. It could not reach our predetermined Mean Resistance level marked at 98300, which can be attributed to a substantial decline that occurred, resulting in the completion of our Outer Coin Dip between 89000 and 78700. Following this decline, Bitcoin experienced a robust rebound to the Mean Resistance level of 86200. This upward trend indicates the potential for higher prices as it will target Mean Resistance levels at 89200 and 92600, respectively. However, a retest of the Key Support level at 79000 must occur before further upward movement may take place.

Market Update & Crypto OutlookMarket Update & Crypto Outlook
Tariffs & Economic Impact
Trump is leveraging tariffs as a negotiation tactic to pressure adversaries into deals. While Europe is reluctant to concede outright, they have little choice. These tariffs are shaking the markets, and we all know how sensitive elites are about their portfolios. By hitting them where it hurts—their wallets—Trump is forcing them to the table.
In my opinion, this strategy will work. Over time, Europe, Ukraine, and even China will likely agree to compromises. As these agreements unfold, market uncertainty (FUD) will ease, restoring investor confidence.
Inflation & Market Sentiment
Markets are pricing in expected quantitative tightening , meaning no interest rate cuts for at least two years. However, I don’t believe tariffs will fuel inflation as much as feared. Reduced government spending and a stronger USD could offset price increases, maintaining purchasing power without printing money.
Until markets realize this, we’ll see uncertainty, but inflation numbers may not be as catastrophic as expected , helping stabilize sentiment.
Crypto & Market Cycle
The bull market isn’t over, but Bitcoin finally experienced real consolidation —without heavy ETF purchases propping it up. The ETF FOMO is over , and that’s actually a good thing. Now, Bitcoin can continue its rally naturally , setting up for its final, most parabolic leg.
Altcoins & The Spark for Altseason
As I mentioned before, a strong dollar combined with the upcoming $5,000 stimulus checks will ignite true altseason . This influx of cash will likely fuel a major altcoin rally later this year , after the new administration distributes the payments.
Conclusion
Yes, it’s been painful—altcoins are bleeding, portfolios are down, and sentiment is low. But capitulation marks the bottom .
Expect a bumpy March , but April and especially May* could be parabolic , making today’s struggles a distant memory. 🚀
(Everything is on the chart, check the arrows)

The stock market is not "Crashing"!I keep hearing people saying the stock market is crashing, a mild pullback is hardly a crash, we are not crashing, at least not yet, and maybe not for an extended period.
We use the S&P 500 because it is the best gauge of our markets with the most diverse representation of any of our indices.
A short history of the trend of our stock marker since 1992, correlated to presidencies.
1992-1999 Clinton: Stock market transitioned from fairly flat to a steady ascending path, we reduced our yearly deficit 6 years and had a budget surplus 2 years.
2000-2007 George Bush Jr: Descending or neutral trend most of the 8 years, we broke our 15 year ascending trend and started an overall descending trend. Deregulation led to the recession via predatory lending giving Walmart cashiers $300k loans, banks labeling bad debt as Grade A and banks leveraging 80% of all of Americans money on risky investments. 2008 was devastating for the US Stock market. Increased the yearly deficit 6 of 8 years.
2008-2015 Obama: Converted descending trend back to ascending trend and trended up in a tight ascending channel for the rest of his presidency, while implementing an array of regulations to prevent banks from doing this to America again. Decreased the yearly deficit 6 of 8 years.
2016-2020 Trump.v1: Maintained tight ascending channel and broke out of 15 year resistance, introduced a lot of lot of volatility and uncertainty, ultimately ended term with the market on the same trajectory it was when he took office. Diluted all US Dollars by 50%, 25% of the dilution was in 2020, coupled with $3T of quantitative easing in a single year (2020) and more than $2T direct stimulus, this dilution and excessive stimulus during a supply chain crunch directly conveyed into rising inflation the following 2 years. Increased our yearly deficit every year in office.
2021-2024 Biden: Broke out of ascending path to a much steeper and unsustainable ascending path, likely due to all the stimulus pumped into the market in 2020 & 2021. Hard pull back in 2021/2022 as Interest rates were increased to deter spending to reduce interest rates which skyrocketed to 10% in 2021 and was brought back down to just above 2% by 2024. We saw a volatile and sharp ascending channel form. At the end of his term, the market was at top of channel and well above all time highs with some of the most growth in the stock market ever witnessed anywhere on earth, ever, as seen in the charts, nearly doubling the S&P 500 in 4 years, the American economy was booming! Decreased the yearly deficit 2 of 4 years.
2025-2038 Trump.v2: Inherited the market at all time highs on the steepest incline we have witnessed to date, and at a point the market is expected to retract based on the charts. Currently it looks like the S&P could lose 15% or so of its value and still be in our ascending channel of 6 years now. As you can see recent pullbacks don’t even register on a weekly candle. Yes these tariffs and subsequent tariff wars will almost certainly wreak havoc on markets as we already see increase in unemployment, significant drops in consumer confidence, increase in debt ceiling, increase in debt through corporate tax breaks, uptick in inflation and uncertainty in policy but --- we still have a long way to fall before we can call this a bear market or a crash. If we do breakdown from the ascending channel, we can expect the S&P to eye around 3200, or nearly half of its current value. If this administration takes over the federal reserve, they can stimulate the economy to fight the decline and prolong the consequences but those measures will involve further dilution, further debt, further smoke in mirrors, further uncertainty and will likely ignite a ticking time bomb with even greater consequences then outlined here.
So in short, stop saying the market is crashing, it is not. But, be vigilant, there is a high probability of short term pullback and a long term crash based on the charts, historical precedence and current administrations activities.

SPX Finally Moves, Will 6000 Hold?SPX Finally Moves – But Will 6000 Hold? | SPX Market Analysis 24 Feb 2025
Last week’s market action was like watching a cat decide whether to jump off a shelf—hesitation, commitment, regret, and then chaos.
SPX pushed through the bull trigger on Wednesday, only to whip back through the hedge & bear trigger, finally showing some real movement on Friday. But before we get too excited, SPX is still stuck inside a larger range, with 6000 as the next key battleground.
Will we see a range breakout or another rejection?
Let’s dive in.
---
Deeper Dive Analysis:
SPX Moves – But Is It Just Another Range Play?
Last week gave us plenty of action, but SPX hasn’t truly escaped its larger range yet.
📌 What happened last week?
SPX broke the bull trigger on Wednesday 🚀
Immediately flipped back through the hedge & bear trigger 🤦♂️
Friday’s move finally opened things up 🔓
Now, we’re eying 6000 as the next decision point.
📌 Two potential setups:
✅ Range Reversal – Price rejects 6000 and moves back inside the range
✅ Breakout Trade – SPX clears 6000, confirming a new leg up
Either way, I’ll be watching closely for the next trade setup.
VIX Says ‘No Crash… Yet’
📉 The volatility index (VIX) remains below 20, meaning:
No imminent crash signals 🛑
Fear is elevated but not panicking
Still room for surprises, but not full-blown chaos (yet!)
If VIX jumps past 20 and keeps climbing, then we’ll talk about more extreme downside risk.
Overnight Futures – A Small Bounce, But No Turn Yet
🌅 Futures are slightly green, but they don’t confirm:
A major bullish turn ❌
A full-blown breakdown ❌
Right now, it’s more noise than signal.
What’s Next?
📌 I remain bearish on my income swing trades 📉
📌 Waiting for confirmation—either:
Bullish reversal (v-shaped price action shift) 🔄
Bearish breakdown (clean range break below 6000) 🚨
For now, it’s another waiting game—but one that could pay off big when the next major move arrives.
---
Fun Fact
📢 Did you know? In 2010, the Flash Crash wiped out nearly $1 trillion in market value in just 36 minutes, only to recover almost entirely by the end of the day. The culprit? A single trader’s algorithm running wild.
💡 The Lesson? Sometimes, market chaos isn’t about fundamentals—it’s just a rogue algorithm losing its mind.
