Why Should You Care About ER?🚀 Hey Traders! Have You Ever Felt Lost in the Chaos of Market Fluctuations?
What if I told you there’s a powerful tool that can help you cut through the noise and give you a statistical edge to predict SUPPORT and RESISTANCE movements with confidence?
Let me take 5 minutes of your time to introduce you to something that could transform your trading game: Expected Range Volatility (ER) .
What is Expected Range Volatility (ER)?
The Expected Range (ER) is a framework that helps traders understand how much an asset is likely to move within a specific timeframe. Based on CME market data and Nobel Prize-winning calculations, price movements within the expected volatility corridor have a 68% probability of staying within those boundaries.
💡 Key Insight: When the price approaching certain levels, there’s a 68% chance the price won’t break through those boundaries. This means you can use ER as a powerful filter to identify more precise entry and exit points for your trades.
Why Should You Care About ER?
When I first discovered the ER tool, it felt like stumbling upon a gold mine in the trading world. Here’s why:
It’s free and available on the CME exchange’s website.
It’s underutilized —95% of traders don’t even know it exists.
It provides statistical clarity in a world full of uncertainty.
I remember the first time I used ER in my analysis—it completely changed the way I approached intraday trading. Now, I never make a trade without checking the ER data. It’s become an essential part of my strategy.
How to Use ER in Your Trading
1️⃣ Input the Data: Head over to the CME website, plug in the necessary parameters, and get your ER values.
2️⃣ Set Boundaries: Use the ER range as a guide to set potential support and resistance levels.
3️⃣ Filter Trades: Only take trades that align with the ER framework to improve your precision.
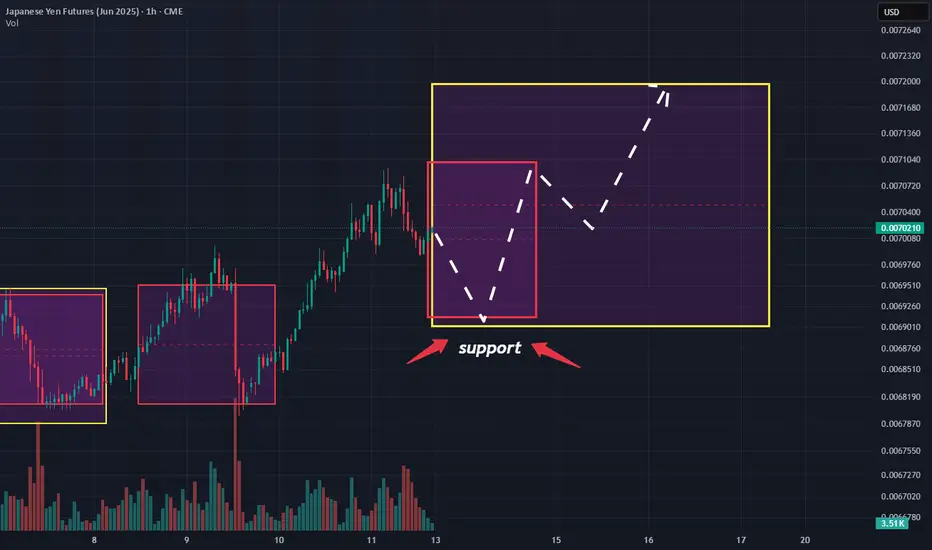
A recent example is the Japanese yen futures market.
Don't be confused by the fact that we take futures levels, it can easily be plotted on a spot chart for forex market (the dollar/yen).
Limitations to Keep in Mind
While ER is a powerful tool, it’s not a crystal ball. Here are some limitations:
Market Dynamics: Short-term price movements can be unpredictable due to sentiment, news, or economic events. ER provides a statistical estimate, but it doesn’t guarantee outcomes.
Assumptions: The formula assumes price movements follow a log-normal distribution , which may not hold true in all market conditions.
Your Turn: Are You Using ER in Your Strategy?
💭 Here’s the million-dollar question: Are you leveraging the power of Expected Range Volatility in your trading? If not, why not start today?
💬 Share your thoughts in the comments below:
Do you currently use ER or similar statistical tools?
Want to Dive Deeper?
If you’re ready to take your trading to the next level, don’t miss out on our all-in-one resource designed to help you master tools like ER and other valuable sources to gain market edge!
🔥 Remember:
No Valuable Data = No Edge!
Edgertradingsystem

Trading Smarter, Not Harder: Decoding Institutional MovesThere’s an old saying in trading: “Follow the smart money.” But how do you know where the smart money is going? The answer lies not in guesswork but in data—specifically, the kind of institutional-grade data that most retail traders overlook. If you’re serious about understanding market dynamics, it’s time to dive into the world of **COT (Commitment of Traders) reports** and **options flow data** from the **CME (Chicago Mercantile Exchange)**. These tools are like your personal radar, cutting through the noise to reveal what the big players are doing.
Step 1: Understanding the Big Picture – Why Market Sentiment Matters
Before we zoom into the specifics, let’s start with the basics. Markets are driven by sentiment—the collective mood of participants. When fear dominates, prices fall; when greed takes over, they rise. But here’s the catch: Retail traders often react to sentiment after it’s already priced in. By the time you see a headline screaming “Market Crashes!” or “Record Highs!”, the opportunity has likely passed.
This is where systematic analysis comes in. Instead of relying on emotions or lagging indicators, smart traders use raw data to anticipate shifts in sentiment. And two of the most powerful sources of this data are **COT reports** and **CME options flow**.
Step 2: The Commitment of Traders (COT) Report – Peering Into the Mind of Institutions
The **COT report**, published weekly by the Commodity Futures Trading Commission (CFTC), provides a breakdown of positions held by different types of traders: commercial hedgers, non-commercial speculators (like hedge funds), and small retail traders. Here’s why it’s invaluable:
- **Commercial Hedgers**: These are the “smart money” players—producers and consumers who use futures markets to hedge their risk. For example, a sugar producer might sell futures contracts to lock in prices. Their actions often signal future supply and demand trends.
- **Non-Commercial Speculators**: These are the momentum-driven players who bet on price movements. Tracking their positioning helps identify potential reversals.
- **Small Traders**: Often considered the “dumb money,” their positions frequently coincide with market tops or bottoms.
By systematically analyzing the COT report, you will discover your ability to identify patterns and positioning levels of participants that signal trend reversals or the onset of corrections. Seriously, this will blow your mind! The insights you gain will be so groundbreaking that they will change your trading game forever.
Step 3: Options Flow – Real-Time Insights Into Institutional Activity
While the COT report offers a macro view, **options flow** gives you real-time insights into institutional activity. Directly through CME data feeds, you can track large block trades in options markets. Here’s why this matters:
It will take some time, observation, and comparison with price charts to learn how to uncover insights that lead to trades with a risk-reward ratio of 1:10 or even higher. This isn’t about needing to make options trades; that’s not a requirement. It’s about being able to trade the Forex market much more effectively by using entry points highlighted by options and futures market reports.
For example, over the past few weeks, the USD/JPY pair has been in a downtrend. Long before this happened, major players were accumulating positions in call options on the futures for the yen (which is equivalent to a decline in the yen). We discussed this before the drop occurred (you can easily find those analyses on our page ).
What’s remarkable is that there are many such insights available. For certain instruments (like precious metals and currency pairs), these insights appear with a certain regularity and provide excellent sentiment for opening positions or reversing positions in the opposite direction.
Step 4: Connecting the Dots – From General Trends to Specific Trades
Now that we’ve covered the tools, let’s talk about how to apply them systematically. Imagine you’re analyzing the sugar futures market (a favorite among commodity traders):
1. **Check the COT Report**: In the precious metals market, commercials are often positioned short, hedging against the risk of a decline in the underlying asset's value. When their net position hovers around zero , it typically signals a bullish trend for gold prices in the vast majority of cases.
2. **Analyze Options Flow**: when filtering options by sentiment, there are several key factors to consider:
- Size and value of the option portfolio
- Distance from the central strike (Delta)
- Time to expiration
- Appearance on the rise/fall of the underlying asset
Option portfolios with names such as vertical spread, butterfly, and condor (iVERTICAL SPREAD, IRON FLY/FLY, CONDOR/IRON CONDOR) have predictive sentiment regarding the direction of the asset's price movement. While "naked" options (PUT or CALL options) with above-average volume can signal that the price is encountering a significant obstacle at that level, leading to a potential bounce off that level (support or resistance).
3 **Combine with Retail Positions Analysis**: Look for opportunities to trade against the crowd. If retail sentiment is overwhelmingly bullish, consider a bearish position, and vice versa.
This layered approach ensures you’re not just reacting to headlines but making informed decisions based on valuable data.
Step 5: Why Systematic Analysis Sets You Apart
Here’s the truth: Most traders fail because they rely on intuition rather than evidence. They chase tips, follow social media hype, or get swayed by emotional biases. But markets reward discipline and preparation. By mastering tools like COT reports and options flow, you gain a competitive edge—a deeper understanding market breath! The path of least resistance!
Remember, even seasoned professionals don’t predict every move correctly.However, having a reliable structure allows you to maximize profits from transactions, eliminate noise and unnecessary (questionable) transactions.
Final Thoughts: Your Path to Mastery
If there’s one takeaway from this article, let it be this: The best traders aren’t fortune-tellers; they’re detectives. They piece together clues from multiple sources to form a coherent picture of the market. Start with the big picture (COT reports), zoom into real-time activity (options flow), and then refine your strategy with technical analysis.
So next time you open chart, don’t just look at price. Dive into the reports/data before. Ask questions. Connect the dots. Because in the world of trading, knowledge truly is power.
What’s your experience with COT reports or options flow? Share your thoughts in the comments below—I’d love to hear how you incorporate these tools into your trading routine!
**P.S.** If you found this article helpful, consider bookmarking it for future reference.

Quotes Dropping? Here’s How to Find Support & Gain Best DealHave you ever found yourself wondering how to make sense of fluctuating quotes?
What if I told you that the powerful key lies in understanding the power of expected range volatility?
Ready? Let me 5 min to introduce you how understanding expected range volatility can give you the edge you need to succeed.
The expected range volatility (ER) provides a framework for understanding how much the asset could move within a specific timeframe. Statistically, price movements within the expected volatility corridor have a 68% probability, based on CME market data and a Nobel Prize-winning calculation formula. This means that traders can rely on these insights as a powerful filter for making more precise entry points into trades.
Key insight: when the market is quiet, and we approach certain price levels, there’s a 68% chance that the price won’t break through those boundaries.
The ER formula is available on the CME exchange's website, and in just a few minutes, you can input the data to get incredible results. It’s truly amazing!
I remember the first time I stumbled upon the ER tool. It felt like finding a gold mine in the trading world! I was amazed that such a powerful resource was available for free, yet it remained unnoticed by 95% of traders.
At that moment, I began to explore the trading community and was shocked to see how underestimated this tool was. I couldn’t find a single author who utilized such valuable data in their analysis.
But once I began to focus on expected range volatility and the data provided by the CME, everything changed. Since that I never make intraday trades without ER data was checked.
Limitations:
• Market Dynamics: Short-term price movements can be unpredictable due to various factors like market sentiment, news, and economic events. The Expected Range provides a statistical estimate but does not guarantee outcomes.
• Assumptions: The formulas assume that price movements follow a log-normal distribution , which may not hold true in all market conditions.
So, what about you? Do you utilizing the power of expected range volatility in your trading strategy? Share your thoughts in the comments below! And if you want make deeper insights , don’t forget to subscribe us.
In the world of trading, knowledge is power.
No Valuable Data - No Edge!🚀💰
Unlocking the Power of Option Analysis for Forex TradingFiltering Options by Sentiment: A Key to Profitable Trading
As traders, we're constantly on the lookout for ways to gain an edge in the markets.
Option portfolios analysis is not a magic solution for success itself, but it can and should be a great tool to add to your trading strategy.
Learning how to analyze the option portfolios of big and successful players on one of the world's biggest exchanges can really improve your market awareness and give you more confidence when reading the current market trends.
The Power of Option Analysis
Option analysis is not just about identifying bullish or bearish sentiment. It's about understanding the nuances of market psychology and identifying opportunities that others may be missing. By filtering options by sentiment, we can identify portfolios that are more likely to result in profitable trades.
Key Factors to Consider
When filtering options by sentiment, there are several key factors to consider:
1. Size and value of the option portfolio
2. Distance from the central strike (Delta)
3. Time to expiration
4.Appearance on the rise/fall of the underlying asset
By considering these factors, we can identify option portfolios that are more likely to result in profitable trades.
As mentioned above, option portfolios with names such as vertical spread, butterfly, and condor (in English - VERTICAL SPREAD, IRON FLY/FLY, CONDOR/IRON CONDOR) have predictive sentiment regarding the direction of the asset's price movement. However, it is critically important to be able to filter out such sentiment, since similar portfolios are widely used and appear almost daily in CME exchange reports, but only a small percentage of them have predictive value.
Portfolios that are traded during a price movement with an obvious trend have low value. On the other hand, if a portfolio appears in a sideways market before the start of a trend and meets other conditions, which will be discussed later, it is reasonable to fix such a portfolio on the chart and subsequently track its correction (closure/partial closure/re-sale).
If you "caught" such a portfolio that is already generating profit for its owner, i.e., the price is moving in the desired direction, you get an additional bonus: by tracking changes in this portfolio, you can understand whether the price movement will continue in the chosen direction or whether the movement is fading or has exhausted its potential and it's time to close your position.
It is necessary to track changes daily using QuickStrike and GlobexTradeBrowser by CME GROUP.
If you track less frequently, you can lose the thread of sentiment. I recommend performing analysis on a regular basis.
Some examples:
On July 17th, there was a really big beat on the Japanese yen in the options market for October. The bed was based on the idea that the yen futures would go up (or the dollar/yen forex rate would fall). As we saw, the bat started to pay off almost immediately, and the yen came really close to the target in just a few days!
Could we have used this information for forex trading? Absolutely. The risk-reward ratio on this trade was about 1 : 3, but importantly , when we made this trade, we had real insider information. Insiders are required by the exchange to disclose their trades, just like other market participants.
Not using this free information in your trades would be a big mistake for a serious trader who doesn't want to gamble in market.
Another example:
In April this year, we saw a strong bullish option sentiment for Silver prices rising between $32 and $35, based on a large options portfolio stated at around $27.5. We released our forecast for Silver, and you can find a copy of it with our reasoning at the link
Cooper example:
The forecast was made after analyzing option activity on the CME exchange on April 2. You can check the results yourself and see if the time we spent studying option sentiment and analyzing was worth it.
In conclusion, as you can see, incorporating option analysis into your toolkit can really help you make more informed trading decisions.
To all serious traders, I wish you patience and dedication on your journey to trading success. Remember that mastering the art of trading takes time, effort, and perseverance. Don't be discouraged by setbacks or losses, but instead, use them as opportunities to learn and improve. Stay focused, stay disciplined, and stay committed to your goals.

US30 LONG ON DAILY TFMarket tanked from the anticipated supply / OB / Retail resistance.
We are waiting for the price to come to our demand / Bullish OB / Support.
The market has huge momentum towards the downside, however if in the coming week we see a decrease in volatility and the market goes to the OB and the market might respect out entry level.
However, if this activates i recommend to always make the position risk free at 1:1 RR.

AUD/CHF LONG MOMENTUM POSITION ON 4H CANDLEThis is the position based on Edger trading system on 4H time frame,
This setup is 1:1 RR, entry has to be done on the candle close, the entry can be refined by your own knowledge.
This is only for educational purpose and no financial advice.
ENTRY : 0.69276 STOP LOSS : 0.68650
TAKE PROFIT 25% :0.69432
TAKE PROFIT 50% : 0.69589
TAKE PROFIT 75% : 0.69746
TAKE PROFIT 100% : 0.69902
FOLLOW RULES:
1. IF TAKE PROFIT 25% HITS, THEN MOVE THE STOP LOSS AT BREAK EVEN AND CLOSE 25% OF THE POSITION.
2. IF TAKE PROFIT 50% HITS, THEN MOVE THE STOP LOSS AT 25% TP LEVEL AND CLOSE 50% OF THE POSITION.
3. IF TAKE PROFIT 75% HITS, THEN MOVE THE STOP LOSS AT 50% TP LEVEL AND CLOSE 50% OF THE POSITION.
4. IF FULL TAKE PROFIT HITS, THEN CLOSE THE TRADE AND ENJOY.
ALSO, HIT LIKE, SHARE AND FOLLOW FOR MORE IDEAS. YOU CAN ALSO RAISE QUESTIONS ON TRADINGVIEW.

GBP/CHF SHORT MOMENTUM SIGNAL BASED ON EDGER TRADING SYSTEMThis is the position based on Edger trading system on daily time frame,
This setup is 1:1 RR, entry has to be done on the candle close, the entry can be refined by your own knowledge.
This is only for educational purpose and no financial advice.
ENTRY : 1.20222 STOP LOSS : 1.21395
TAKE PROFIT 25% : 1.19929
TAKE PROFIT 50% : 1.19636
TAKE PROFIT 75% : 1.19342
TAKE PROFIT 100% : 1.19049
FOLLOW RULES:
1. IF TAKE PROFIT 25% HITS, THEN MOVE THE STOP LOSS AT BREAK EVEN AND CLOSE 25% OF THE POSITION.
2. IF TAKE PROFIT 50% HITS, THEN MOVE THE STOP LOSS AT 25% TP LEVEL AND CLOSE 50% OF THE POSITION.
3. IF TAKE PROFIT 75% HITS, THEN MOVE THE STOP LOSS AT 50% TP LEVEL AND CLOSE 50% OF THE POSITION.
4. IF FULL TAKE PROFIT HITS, THEN CLOSE THE TRADE AND ENJOY.
ALSO, HIT LIKE, SHARE AND FOLLOW FOR MORE IDEAS. YOU CAN ALSO RAISE QUESTIONS ON TRADINGVIEW.

GBP/CAD SHORT MOMENTUM POSITION ON DAILY TIME FRAMEThis is the position based on Edger trading system on daily time frame,
This setup is 1:1 RR, entry has to be done on the candle close, the entry can be refined by your own knowledge.
This is only for educational purpose and no financial advice.
SELL STOP ENTRY : 1.58663 STOP LOSS : 1.62010
TAKE PROFIT 25% : 1.57827
TAKE PROFIT 50% : 1.56990
TAKE PROFIT 75% : 1.56132
TAKE PROFIT 100% : 1.55316
FOLLOW RULES:
1. IF TAKE PROFIT 25% HITS, THEN MOVE THE STOP LOSS AT BREAK EVEN AND CLOSE 25% OF THE POSITION.
2. IF TAKE PROFIT 50% HITS, THEN MOVE THE STOP LOSS AT 25% TP LEVEL AND CLOSE 50% OF THE POSITION.
3. IF TAKE PROFIT 75% HITS, THEN MOVE THE STOP LOSS AT 50% TP LEVEL AND CLOSE 50% OF THE POSITION.
4. IF FULL TAKE PROFIT HITS, THEN CLOSE THE TRADE AND ENJOY.
ALSO, HIT LIKE, SHARE AND FOLLOW FOR MORE IDEAS. YOU CAN ALSO RAISE QUESTIONS ON TRADINGVIEW.

USD/CAD LONG MOMENTUM ON DAILY TIME FRAMEThis is the position based on Edger trading system on daily time frame,
This setup is 1:1 RR, entry has to be done on the candle close, the entry can be refined by your own knowledge.
This is only for educational purpose and no financial advice.
ENTRY : 1.29087 STOP LOSS : 1.27137
TAKE PROFIT 25% : 1.29574
TAKE PROFIT 50% : 1.30062
TAKE PROFIT 75% : 1.30549
TAKE PROFIT 100% : 1.31037
FOLLOW RULES:
1. IF TAKE PROFIT 25% HITS, THEN MOVE THE STOP LOSS AT BREAK EVEN AND CLOSE 25% OF THE POSITION.
2. IF TAKE PROFIT 50% HITS, THEN MOVE THE STOP LOSS AT 25% TP LEVEL AND CLOSE 50% OF THE POSITION.
3. IF TAKE PROFIT 75% HITS, THEN MOVE THE STOP LOSS AT 50% TP LEVEL AND CLOSE 50% OF THE POSITION.
4. IF FULL TAKE PROFIT HITS, THEN CLOSE THE TRADE AND ENJOY.
ALSO, HIT LIKE, SHARE AND FOLLOW FOR MORE IDEAS. YOU CAN ALSO RAISE QUESTIONS ON TRADINGVIEW.

USD/JPY LONG MOMENTUM ON DAILY TIME FRAMEThis is the position based on Edger trading system on daily time frame,
This setup is 1:1 RR, entry has to be done on the candle close, the entry can be refined by your own knowledge.
This is only for educational purpose and no financial advice.
BUY STOP ENTRY : 130.858 STOP LOSS : 126.952
TAKE PROFIT 25% : 131.834
TAKE PROFIT 50% : 132.810
TAKE PROFIT 75% : 133.786
TAKE PROFIT 100% : 134.764
FOLLOW RULES:
1. IF TAKE PROFIT 25% HITS, THEN MOVE THE STOP LOSS AT BREAK EVEN AND CLOSE 25% OF THE POSITION.
2. IF TAKE PROFIT 50% HITS, THEN MOVE THE STOP LOSS AT 25% TP LEVEL AND CLOSE 50% OF THE POSITION.
3. IF TAKE PROFIT 75% HITS, THEN MOVE THE STOP LOSS AT 50% TP LEVEL AND CLOSE 50% OF THE POSITION.
4. IF FULL TAKE PROFIT HITS, THEN CLOSE THE TRADE AND ENJOY.
ALSO, HIT LIKE, SHARE AND FOLLOW FOR MORE IDEAS. YOU CAN ALSO RAISE QUESTIONS ON TRADINGVIEW.

CAD/JPY LONG MOMENTUM POSITION 4H TIME FRAMEThis is the position based on Edger trading system on 4 Hour time frame,
This setup is 1:1 RR, entry has to be done on the candle close, the entry can be refined by your own knowledge.
This is only for educational purpose and no financial advice.
ENTRY : 102.258 STOP LOSS : 101.277
TAKE PROFIT 25% : 102.503
TAKE PROFIT 50% : 102.748
TAKE PROFIT 75% : 102.993
TAKE PROFIT 100% : 103.239
FOLLOW RULES:
1. IF TAKE PROFIT 25% HITS, THEN MOVE THE STOP LOSS AT BREAK EVEN AND CLOSE 25% OF THE POSITION.
2. IF TAKE PROFIT 50% HITS, THEN MOVE THE STOP LOSS AT 25% TP LEVEL AND CLOSE 50% OF THE POSITION.
3. IF TAKE PROFIT 75% HITS, THEN MOVE THE STOP LOSS AT 50% TP LEVEL AND CLOSE 50% OF THE POSITION.
4. IF FULL TAKE PROFIT HITS, THEN CLOSE THE TRADE AND ENJOY.
ALSO, HIT LIKE, SHARE AND FOLLOW FOR MORE IDEAS. YOU CAN ALSO RAISE QUESTIONS ON TRADINGVIEW.

CAD/JPY LONG MOMENTUM POSITION DAILY TIME FRAMEThis is the position based on Edger trading system on daily time frame,
This setup is 1:1 RR, entry has to be done on the candle close, the entry can be refined by your own knowledge.
This is only for educational purpose and no financial advice.
ENTRY : 98.947 STOP LOSS : 97.101
TAKE PROFIT 25% : 99.408
TAKE PROFIT 50% : 99.87
TAKE PROFIT 75% : 100.331
TAKE PROFIT 100% : 100.793
FOLLOW RULES:
1. IF TAKE PROFIT 25% HITS, THEN MOVE THE STOP LOSS AT BREAK EVEN AND CLOSE 25% OF THE POSITION.
2. IF TAKE PROFIT 50% HITS, THEN MOVE THE STOP LOSS AT 25% TP LEVEL AND CLOSE 50% OF THE POSITION.
3. IF TAKE PROFIT 75% HITS, THEN MOVE THE STOP LOSS AT 50% TP LEVEL AND CLOSE 50% OF THE POSITION.
4. IF FULL TAKE PROFIT HITS, THEN CLOSE THE TRADE AND ENJOY.
ALSO, HIT LIKE, SHARE AND FOLLOW FOR MORE IDEAS. YOU CAN ALSO RAISE QUESTIONS ON TRADINGVIEW.

EUR/CHF SHORT MOMENTUM POSITION ON 4HThis is the position based on Edger trading system on four time frame,
This setup is 1:1 RR, entry has to be done on the candle close, the entry can be refined by your own knowledge.
This is only for educational purpose and no financial advice.
PLACE SELL STOP
ENTRY : 1.01268 STOP LOSS : 1.02058
TAKE PROFIT 25% : 1.01071
TAKE PROFIT 50% : 1.00872
TAKE PROFIT 75% : 1.00676
TAKE PROFIT 100% : 1.00478
FOLLOW RULES:
1. IF TAKE PROFIT 25% HITS, THEN MOVE THE STOP LOSS AT BREAK EVEN AND CLOSE 25% OF THE POSITION.
2. IF TAKE PROFIT 50% HITS, THEN MOVE THE STOP LOSS AT 25% TP LEVEL AND CLOSE 50% OF THE POSITION.
3. IF TAKE PROFIT 75% HITS, THEN MOVE THE STOP LOSS AT 50% TP LEVEL AND CLOSE 50% OF THE POSITION.
4. IF FULL TAKE PROFIT HITS, THEN CLOSE THE TRADE AND ENJOY.
ALSO, HIT LIKE, SHARE AND FOLLOW FOR MORE IDEAS. YOU CAN ALSO RAISE QUESTIONS ON TRADINGVIEW.

NZD/USD SHORT MOMENTUM POSITION ON 4 HOURThis is the position based on Edger trading system on 4 Hour time frame,
This setup is 1:1 RR, entry has to be done on the candle close, the entry can be refined by your own knowledge.
This is only for educational purpose and no financial advice.
PLACE SELL STOP
ENTRY : 0.68267 STOP LOSS : 0.68564
TAKE PROFIT 25% : 0.68193
TAKE PROFIT 50% : 0.68119
TAKE PROFIT 75% : 0.68045
TAKE PROFIT 100% : 0.6797
FOLLOW RULES:
1. IF TAKE PROFIT 25% HITS, THEN MOVE THE STOP LOSS AT BREAK EVEN AND CLOSE 25% OF THE POSITION.
2. IF TAKE PROFIT 50% HITS, THEN MOVE THE STOP LOSS AT 25% TP LEVEL AND CLOSE 50% OF THE POSITION.
3. IF TAKE PROFIT 75% HITS, THEN MOVE THE STOP LOSS AT 50% TP LEVEL AND CLOSE 50% OF THE POSITION.
4. IF FULL TAKE PROFIT HITS, THEN CLOSE THE TRADE AND ENJOY.
ALSO, HIT LIKE, SHARE AND FOLLOW FOR MORE IDEAS. YOU CAN ALSO RAISE QUESTIONS ON TRADINGVIEW.

EUR/JPY LONG MOMENTUM POSITION DAILY TIME FRAMEThis is the position based on Edger trading system on daily time frame,
This setup is 1:1 RR, entry has to be done on the candle close, the entry can be refined by your own knowledge.
This is only for educational purpose and no financial advice.
ENTRY : 135.191 STOP LOSS : 133.728
TAKE PROFIT 25% : 135.551
TAKE PROFIT 50% : 135.91
TAKE PROFIT 75% : 136.269
TAKE PROFIT 100% : 136.654
FOLLOW RULES:
1. IF TAKE PROFIT 25% HITS, THEN MOVE THE STOP LOSS AT BREAK EVEN AND CLOSE 25% OF THE POSITION.
2. IF TAKE PROFIT 50% HITS, THEN MOVE THE STOP LOSS AT 25% TP LEVEL AND CLOSE 50% OF THE POSITION.
3. IF TAKE PROFIT 75% HITS, THEN MOVE THE STOP LOSS AT 50% TP LEVEL AND CLOSE 50% OF THE POSITION.
4. IF FULL TAKE PROFIT HITS, THEN CLOSE THE TRADE AND ENJOY.
ALSO, HIT LIKE, SHARE AND FOLLOW FOR MORE IDEAS. YOU CAN ALSO RAISE QUESTIONS ON TRADINGVIEW.

GBP/JPY LONG MOMENTUM POSITION ON 4HThis is the position based on Edger trading system on daily time frame,
This setup is 1:1 RR, entry has to be done on the candle close, the entry can be refined by your own knowledge.
This is only for educational purpose and no financial advice.
BUY STOP ENTRY : 160.985
STOP LOSS : 159.443
TAKE PROFIT 25% : 161.37
TAKE PROFIT 50% : 161.756
TAKE PROFIT 75% : 162.141
TAKE PROFIT 100% : 162.527
FOLLOW RULES:
1. IF TAKE PROFIT 25% HITS, THEN MOVE THE STOP LOSS AT BREAK EVEN AND CLOSE 25% OF THE POSITION.
2. IF TAKE PROFIT 50% HITS, THEN MOVE THE STOP LOSS AT 25% TP LEVEL AND CLOSE 50% OF THE POSITION.
3. IF TAKE PROFIT 75% HITS, THEN MOVE THE STOP LOSS AT 50% TP LEVEL AND CLOSE 50% OF THE POSITION.
4. IF FULL TAKE PROFIT HITS, THEN CLOSE THE TRADE AND ENJOY.
ALSO, HIT LIKE, SHARE AND FOLLOW FOR MORE IDEAS. YOU CAN ALSO RAISE QUESTIONS ON TRADINGVIEW.

EUR/SEK SHORT MOMENTUM POSITION ON 4HThis is the position based on Edger trading system on daily time frame,
This setup is 1:1 RR, entry has to be done on the candle close, the entry can be refined by your own knowledge.
This is only for educational purpose and no financial advice.
SELL STOP ENTRY : 10.2635
STOP LOSS : 10.4049
TAKE PROFIT 25% :10.31653
TAKE PROFIT 50% : 10.29885
TAKE PROFIT 75% : 10.28118
TAKE PROFIT 100% : 10.2635
FOLLOW RULES:
1. IF TAKE PROFIT 25% HITS, THEN MOVE THE STOP LOSS AT BREAK EVEN AND CLOSE 25% OF THE POSITION.
2. IF TAKE PROFIT 50% HITS, THEN MOVE THE STOP LOSS AT 25% TP LEVEL AND CLOSE 50% OF THE POSITION.
3. IF TAKE PROFIT 75% HITS, THEN MOVE THE STOP LOSS AT 50% TP LEVEL AND CLOSE 50% OF THE POSITION.
4. IF FULL TAKE PROFIT HITS, THEN CLOSE THE TRADE AND ENJOY.
ALSO, HIT LIKE, SHARE AND FOLLOW FOR MORE IDEAS. YOU CAN ALSO RAISE QUESTIONS ON TRADINGVIEW.

CHF/JPY LONG MOMENTUM POSITION ON 4HThis is the position based on Edger trading system on 4H time frame,
This setup is 1:1 RR, entry has to be done on the candle close, the entry can be refined by your own knowledge.
This is only for educational purpose and no financial advice.
BUY STOP ENTRY : 132.608
STOP LOSS : 131.429
TAKE PROFIT 25% : 132.901
TAKE PROFIT 50% : 133.195
TAKE PROFIT 75% : 133.488
TAKE PROFIT 100% : 133.787
FOLLOW RULES:
1. IF TAKE PROFIT 25% HITS, THEN MOVE THE STOP LOSS AT BREAK EVEN AND CLOSE 25% OF THE POSITION.
2. IF TAKE PROFIT 50% HITS, THEN MOVE THE STOP LOSS AT 25% TP LEVEL AND CLOSE 50% OF THE POSITION.
3. IF TAKE PROFIT 75% HITS, THEN MOVE THE STOP LOSS AT 50% TP LEVEL AND CLOSE 50% OF THE POSITION.
4. IF FULL TAKE PROFIT HITS, THEN CLOSE THE TRADE AND ENJOY.
ALSO, HIT LIKE, SHARE AND FOLLOW FOR MORE IDEAS. YOU CAN ALSO RAISE QUESTIONS ON TRADINGVIEW.

NZD/CAD SHORT MOMENTUM POSITION ON 4HThis is the position based on Edger trading system on daily time frame,
This setup is 1:1 RR, entry has to be done on the candle close, the entry can be refined by your own knowledge.
This is only for educational purpose and no financial advice.
SELL STOP ENTRY : 0.86505
STOP LOSS : 0.87227
TAKE PROFIT 25% : 0.86325
TAKE PROFIT 50% : 0.86145
TAKE PROFIT 75% : 0.85964
TAKE PROFIT 100% : 0.85783
FOLLOW RULES:
1. IF TAKE PROFIT 25% HITS, THEN MOVE THE STOP LOSS AT BREAK EVEN AND CLOSE 25% OF THE POSITION.
2. IF TAKE PROFIT 50% HITS, THEN MOVE THE STOP LOSS AT 25% TP LEVEL AND CLOSE 50% OF THE POSITION.
3. IF TAKE PROFIT 75% HITS, THEN MOVE THE STOP LOSS AT 50% TP LEVEL AND CLOSE 50% OF THE POSITION.
4. IF FULL TAKE PROFIT HITS, THEN CLOSE THE TRADE AND ENJOY.
ALSO, HIT LIKE, SHARE AND FOLLOW FOR MORE IDEAS. YOU CAN ALSO RAISE QUESTIONS ON TRADINGVIEW.

US30 LONG AND SHORTI am long for the first phase and waiting for market to short from the marked up area or point of interest.
Sell would only open if there is confirmation of bias after RTOB.

US30 WYCKOFF DISTRIBUTION FIRST LONG AND THEN SHORT.Hello everyone, I am posting here my analysis about what could happen next on US30 and why.
on 4 hour time frame we can see the PSY, BC , AR, ST , SOW and UT have already been formed.
The price has shown indecision and hence gave a reversal after breaking the RETAIL support (Providing break of structure or activating pending stop orders), it can be seen that the price is deflecting after breaking the retail support and now reversing.
To which I believe price will form a new weekly high this or next week where we could have a UTAD (Formation of Order Block) and on the restest of UTAD I would go short.
On this analysis, there are few Liquidity lines marked up above UT, which means , the price might break any of these liquidity lines (Break Of Structure) and then form UTAD (Order Block).
Please feel free to comment, like or share. Also, If you are against this idea, please raise a valid point.
Thank you..
TheEdger.

NEW ATH US30???As far as i can see with the help of orderflow , manipulation and overall price action on US30 aka DJ.
I would stay long until we see ATH, probably retracement or correction might be seen in the coming weeks, which might liquidate more positions before making the final ATH.
Please feel free to comment, share your ideas in the chat and also share this idea with other if you think likewise.
