Pyramid of Trading: a step-by-step guide to successHey, fam! Happy Saint Valentine's Day and welcome on another educational post. The topic is the following: a step-by-step guide to success in trading.
We all start somewhere, right? Something grabs our attention and builds instant interest that makes us persuade a specific thing. If you decide to interview a number of traders and ask them reasons why they had decided to become a trader, they will all give you various answers. One will tell you that his motivational driver was a random guy on Instagram that drives a Lamborghini Urus and claims that he is a day-trader. Another one will state that he has always been aiming towards building a great career and becoming financially independent and so forth.
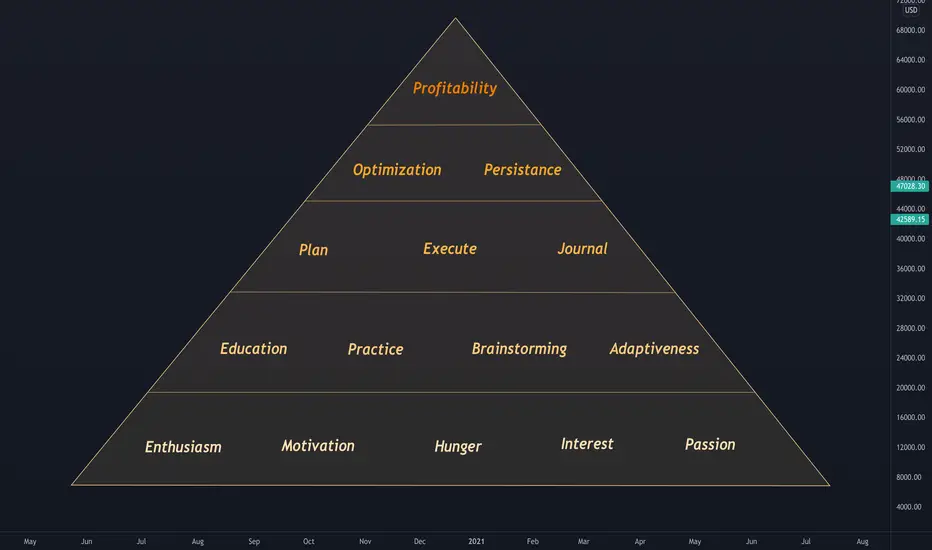
Regardless of the background, all of them had started their trading journeys having the same drive, enthusiasm, passion, hunger, and motivation. One cannot simply succeed in this sector without being ambitious and eager enough.
While the above stated characteristics serve as basis of motivation, the next tier is one of the most important ones, as it sets the ground for all upcoming success and profitability. It is crucial to keep constantly learning, brainstorming, making yourself familiar with new stuff, applying the learned in practice, and adapting to the changes that take place both in your life and in the market.
After the fundament has been set, it is time to move to the main part: Planning, Executing, Journaling. First of all, if we have reached this particular tier, it means that we already have e strategy that we stick to and refrain from changing every week/month. We use this strategy to plan our trades and execute them once all criteria have been met. We journal all of the taken trades, both winners and losers.
Journaling helps us optimize our strategy and make some chages in it if neccessary. As market conditions change quite rapidly, our strategy and business plan should be modified as well in order to account for those changes. In addition, regardless of anything, we remain patient, cold-blooded, and trust the process.
After climbing all those tiers and reaching the very top of it, we can finally say that we are profitable and consistent, and we can enjoy the fruits of our own labour.
Of course, it is never as easy as it may sound, but long-term vision, patience, and ambition can take him or her to the doors of profitability. Thus, we encourage all fellow traders to keep grinding and strive for prosperity!
With love,
Investroy Family
Educationalcontent
Basic Steps Of Growing As A Trader / Investor“ You don't set out to build a wall.
You don't say 'I'm going to build the biggest,
baddest, greatest wall that's ever been built.
You don't start there.
You say 'I'm gonna lay this
brick as perfectly as a brick can be laid,
and you do that every single day,
and soon you have a wall.”
- Will Smith -
NEVER INVEST IN SOMETHING YOU DO NOT HAVE KNOWLEGE OF.
Choose What Kind Of Markrt You Wanna Be Involved In, I Peronally Trade In The Forex Market.
Introducing Forex
- What Is the Forex Market?
- An Overview of Forex Markets
- Uses of the Forex Markets
- Forex for Speculation
- How to Start Trading Forex
- Forex Terminology
- Basic Forex Trading Strategies
- Charts Used in Forex Trading
- Pros and Cons of Trading Forex
- What is Forex?
- Where is Forex Traded?

EURUSD FED Interest Rate Decision. EURUSD FED Interest Rate Decision (Possible Movement)
Please Read The Disclaimer First Which Is Below The Setup Criteria
Now This Is One Of My Classic Trades ( NOT THE FOUNDER), I Just Like This Trade Setup
Components Of A AMD TRADE SETUP
Asian Session Box
Reversal OR M - Pattern ( In This Case We Had A M-Formation In The Asian Box Before A Small Consolidation Box)
We Had A Micro View Of The Pattern Inside A Asian Box
London Open - We Had The Bearish Movement , Moving Towards Our BuOB
We Expecting The Market To Form A Reversal Pattern , We Woould Like A Nice W- Formation To The Upside
Execution
Stop Loss = - 30 Pips
Take Profit = +90 Pips
Risk To Reward = 1:3
DISCLAIMER :
Before using this Tradingview account setups, please make sure that you note the following important information:
Do Your Own Research ( DYOR)
Our content is intended to be used and must be used for information and education purposes only. It is very important to do your own analysis before making any investment based on your own personal circumstances. You should take independent financial advice from a professional in connection with, or independently research and verify, any information that you find on our Website and wish to rely upon, whether for the purpose of making an investment decision or otherwise.
No Investment Advice
Our Tradingview account is a financial data and news portal, discussion forum and content aggregator. Circle Forex Institution is not a broker/dealer, we are not an investment advisor, we have no access to non-public information about publicly traded companies, and this is not a place for the giving or receiving of financial advice, advice concerning investment decisions or tax or legal advice. We are not regulated by the Financial Services Authority.
We are an educational forum for analysing, learning & discussing general and generic information related to stocks, investments and strategies. No content on the site constitutes - or should be understood as constituting - a recommendation to enter in any securities transactions or to engage in any of the investment strategies presented in our site content. We do not provide personalised recommendations or views as to whether a stock or investment approach is suited to the financial needs of a specific individual.

Trading Myths vs Reality. Beginners, this one is for you!Hey, wizards! Happy Thursday and welcome on another Educational Post. The topic is the following: Myths and Reality of Trading.
As you may already know, there are so many false statements that beginners run into before starting their trading journey. Those statements are illustrated on the layout and interpreted below:
1) Most people think that trading is easy and they can quit their job or whatever they do and start making a living off trading straight away. In fact, in order to be profitable, consistent, and be a full-time trader in general, he or she MUST have a backtested strategy and be experienced enough in this sector. Remember that it takes a while to be successful, but it is fully worth it!
2) “Trading is like a casino”- we hear this one quite often. Only two types of people use this expression a lot: those who have never been able to become successful in this industry, and those that have no plan or idea about what they are doing. One should never open a positions based on a coin flip or what others are saying. Ideas and analyses of other can be used as a confluence and inspiration for a trader to open a positions on a specific security.
3) Whether it is trading or any other industry, one can never be rich over the course of a night. It takes 10-14 for someone to become a licensed surgeon, at least 6 years to become a professional lawyer. What makes you think that you will become a professional trader in just a few weeks or months?
4) No matter what the situation is, always use a Stop Loss to avoid deep losses. Whether liquidity hunt exists or it does not, it is always important to stay safe and sound.
5) Risk management is always more important than the win rate. Imagine having a 1:3 Risk-to-Reward ratio on your next 10 trades and the win rate is only 50%. That means you will win 5 and you lose 5. Now, let’s say that we decide to risk 1% of our total capital per trade. If we do quick maths, we will see that with only 50% win rate and 1:3 RR, we will result in making a juicy 10% return from the total of our next 10 trades. Of course, this is not always the case, as there are some factors that should be considered, such as spreads, fees, pip value etc. However, this is a perfect example to help you get the overall idea.
6) There is a big number of traders who do not like the “Retail Way” and would rather trade the “Smart Money” concept, which is apparently the closest thing that we have to the Institutional Trading. The bottom line is this: choose a strategy that suits you the best, and go with it while optimizing along the way. Changing strategies every week/month will not make one consistent. It is crucial that you stick with one trading plan and be loyal to it.
7) Many beginning traders tend to increase their risk in attempts to make more profits. This approach is so risky and totally wrong. If one is willing to make more money trading, it is important that he or she increases the input, and not the risk.

EDUCATIONAL CHART WITH LIVE MARKET Here is the example for head and shoulder pattern in gold , So learn from this chart , just watch the market movement in gold , it will work perfectly . Read fully and comment your opinion down , thank you

XAU/USD EDUCATIONAL CONTENT
#xauusd
Educational Content
Whenever the price is trying to break the support and trying it for the 5 th time , well it will break the support or what will happen ?
Comment down

Trade like a casino! 🎰🎲💵Yep you heard me right you need trade like a casino 🎰
Key bit here is trade like the casino operates their business model.
Don't trade like the clients that frequent the casinos.
Why should you trade like a casino?
Profitable traders understand how casinos are successful.
Casinos are profitable and make money because they have an edge which they let play out.
They know probability is in their favour.
How many times have we all been at a roulette table thinking we have a 50% chance of winning betting on red or black.
We all seem to forget about that green zero on the table and here in lies the casinos edge.
With having an edge they let play out it's impossible for them not to make money.
The casino is comfortable with every outcome on the bets placed knowing the edge will play out.
Losses are seen as a cost of business, risk is controlled and emotions to are in check.
This is why the house always wins! 🎰🤑
If you as a trader apply the same logic's to your trading strategies the end results will be the same as the casino.
If you choose to trade like one of the clients in the casino with no fixed rules you essentially are gambling with you trading.
Subjectivity and emotions will come in to play.
Random winning and losing runs will occur which will impact trading psychology.
This way of trading will only end in one way and that's by giving everything to the house or in this case your broker!
Development of a strategies with proven mathematical edges ensures you will become the house 🏦💰
Once an edge is established trust your strategy and let that edge play out.
-----------------------------------------
Please hit the 👍 LIKE button if you like my ideas🙏
Also follow my profile, then you will receive a notification whenever I post a trading idea - so you don't miss them. 🙌
No one likes missing out, do they?
Also, see my 'related ideas' below to see more just like this.
Thank you.
Darren

The Structure of the Financial Market:Soon, i will going to post here to explain that special session, choose my favorite par, my plans for the next years and how to be prepared for the next burble cycle of cryptocurrencies and more to discuss like my plan to invest in stocks, gold, silver and more. But I'm interesting to invest and trade stocks soon more later But soon trade the rest of market like forex, commodities as gold, silver and oil and index
Soon this will be moved to educational content!!!
Still alert today, in the next hours this comment box will be update!!!

[EDUCATIONAL] BULL Flag on ETH/USD - Full ExplanationIn this technical analysis we are reviewing the price action on Ethereum. The confirmed bull flag is a very powerful signal and I will be explaining how you can trade it.
Both flags and Pennants are quite similar to each other and have proven to be powerful chart patterns in technical analysis. They are considered 'continuation patterns'. First of all it is important to understand where the name is coming from.
If you look at the picture to the left you should get a pretty good idea. The price goes up strongly (in case of a bullish pattern, downwards for bearish) and then enters a moment of soft consolidation with a slight bearish trend (or in case of a bear flag it should be bullish, you get the point).
The price is expected to continue in the direction of the move it had seen before (in this case the strong upwards momentum) after it breaks out of the flag. Ethereum has JUST confirmed the breakout on the bull flag, which should indicate a bullish continuation according to this pattern.
Follow me for consistent high quality updates, with clear explanations and charts.
Please like this post to support me.
- Trading Guru
--------------------------------------------------------------
Disclaimer!
This post does not provide financial advice. It is for educational purposes only!

[Educational Content] - How to trade RSI DivergencesIn this technical analysis I will go into depth on how to trade an RSI Divergence taking this beautiful textbook example here on NWC.
RSI Divergences help to mark reversal points. In this trade set-up I suggest a long position on NWC / BTC after we spotted an RSI Divergence and already have confirmed it at the horizontal level.
The horizontal level gets an insane confluence here after seeing three indicators align. First of all, the price is near the golden zone of the 0.618 fibonnaci retracement, second of all the price is near a strong horizontal zone and thirdly the price has seen a confirmed rsi bullish divergence.
*So, what are RSI Divergences*?
Regular divergences are reversal signals. When a regular divergence occurs, it indicates that the trend is strong but its momentum has weakened. It provides an early warning that a trend reversal (or at least a pull back) is likely to follow soon.
Regular divergences can be powerful and reliable entry triggers. In fact, as far as oscillators go (and technical indicators in general), regular divergences are considered the most reliable early signs of a local bottom or top.
Especially when confluence is present, regular divergences can provide “high probability” trading setups. Therefore, strategies involving divergences tend to be relatively forgiving when traded using a low Risk Reward Ratio.
For smaller marketcap coins it is also important to check fundamental principles. As you noticed over the last weeks I am a huge fan of NWC. As a trader myself, I am looking forward to the functionality that NWC will add. Interesting knowledge is that the roadmap of NWC is publicly available on their website, which means you can easily predict whenever major events are going to happen and trade accordingly. I found that in Q4 the mobile app is likely to be released, which adds to the bullish sentiment of NWC right now.
Follow me for consistent high quality updates, with clear explanations and charts.
Please like this post to support me.
- Trading Guru
--------------------------------------------------------------
Disclaimer!
This post does not provide financial advice. It is for educational purposes only!
