The Road to Trading Mastery: the Pyramid of SuccessGreetings, esteemed members of the @TradingView and all Vesties out there!
The Pyramid of Trading Success, a conceptual model designed to guide you through the essential principles and steps for success in the dynamic trading world. This pyramid serves as a roadmap, helping you build a robust foundation and ascend to proficiency and profitability in your trading experience. Let's explore the key layers that make up this pyramid:
1. Emotional Well-being / Financial Stability / Trustworthy Broker (Base of the Pyramid)
At the foundation, prioritize emotional well-being, self-awareness, and financial stability. Constructive self-evaluation and rational thinking are your allies. Choosing a trustworthy broker adds integrity to your trading experience.
2. Robust Safety System
Implement a robust safety system by practicing swift loss-cutting, avoiding unreliable assets, refraining from gambling, and adopting a long-term mindset for sustainable success.
3. Portfolio Management
Rely on statistics, discard ineffective approaches, monitor market trends, consider long-term goals, and stay informed about economic indicators for effective portfolio management.
4. Asset Allocation
Diversify your investments strategically to spread risk, drawing on years of experience in trading financial markets for optimal decision-making.
5. Tools
Utilize the right tools by conducting strategy backtesting and considering automation. Backtesting refines your approach, while automation streamlines execution, minimizing emotional biases.
Steps for Strategy Backtesting:
Define strategy parameters, financial market, and chart timeframe.
Search for trades based on the specified strategy, market, and timeframe.
Analyze price charts for entry and exit signals.
Record and calculate returns, considering commissions and trading costs.
Compare net return to capital for a percentage return over the specified timeframe.
6. Remaining
Focus on essentials covered in the first five points. Avoid distractions like social trading or complex indicators. A disciplined approach, grounded in fundamental principles, is key for tangible results in your trading journey.
By following the Pyramid of Trading Success, you're adopting a comprehensive and methodical approach to trading, increasing your chances of achieving sustainable success in the dynamic world of financial markets.
We welcome your valuable feedback on our article about the Trading Pyramid. Your opinion matters, and your insights can help us tailor our content to better meet your needs.
Educationalidea

Bitcoin: The World Reserve CurrencyIntroduction:
The World Reserve currency is a currency that is widely used in international trade and finance. It is held by central banks around the world as part of their foreign exchange reserves. The United States dollar (USD) has been the world reserve currency since the end of World War II.
In recent years, there has been growing interest in Bitcoin as a potential world reserve currency. Bitcoin is a digital currency that is decentralized, meaning that it is not controlled by any government or financial institution. It is also highly secure and transparent.
Advantages of Bitcoin as a World Reserve Currency
There are several advantages to using Bitcoin as a world reserve currency. These include:
Decentralization: Bitcoin is decentralized, which means that it is not controlled by any government or financial institution. This makes it resistant to manipulation and censorship.
Security: Bitcoin is highly secure, thanks to its use of cryptography. This makes it a safe and reliable store of value.
Transparency: All Bitcoin transactions are recorded on a public blockchain, which is a transparent and tamper-proof record of all transactions. This makes Bitcoin a very transparent currency.
Scarcity: Bitcoin has a limited supply of 21 million coins. This makes it a scarce asset, which can help to protect its value.
Global reach: Bitcoin can be used by anyone in the world, regardless of their location or financial status. This makes it a truly global currency.
Challenges to Bitcoin as a World Reserve Currency
Despite its advantages, there are also some challenges to using Bitcoin as a world reserve currency. These include:
Volatility: Bitcoin is a volatile asset, meaning that its price can fluctuate wildly. This makes it a risky investment for central banks.
Adoption: Bitcoin is still not widely adopted by businesses and governments. This makes it difficult to use as a world reserve currency.
Regulation: There is currently no clear regulatory framework for Bitcoin. This could pose a challenge for central banks that are considering using Bitcoin as a reserve currency.
**Overall, Bitcoin has the potential to be a successful world reserve currency. However, there are still some challenges that need to be addressed before it can be widely adopted.
Future of Bitcoin as a World Reserve Currency
The future of Bitcoin as a world reserve currency is uncertain. However, there are a number of factors that could contribute to its adoption, including:
The continued growth of the digital economy: The digital economy is growing rapidly, and Bitcoin is well-positioned to play a major role in this economy.
The increasing adoption of Bitcoin by businesses and governments: As more businesses and governments adopt Bitcoin, it will become more difficult to ignore its potential as a world reserve currency.
The development of new Bitcoin-based financial products and services: The development of new Bitcoin-based financial products and services could make Bitcoin more attractive to central banks.
It is still too early to say whether Bitcoin will become the world reserve currency. However, it is a serious contender, and it is worth considering the potential benefits and risks of using Bitcoin as a reserve currency.
Thanks
Hexa

How to determine a trend direction and when it reverse this is a full on vid explaining how to spot and mark (HH)(HL)(LL)(LH) which they come to be a key part in setting directions on the chart and to know where will the trend go be sure to follow me for more of this content

Risk/Reward Ratios 101In trading, the risk/reward ratio stands as the beacon guiding every trader's decisions. But what exactly is this ratio, and how does it define your success in the market?
In this article we will describe how risk/reward ratio affects your trading performance.
If you appreciate our charts, give us a quick 💜💜
Understanding the Risk/Reward Ratio:
At its core, the risk/reward ratio quantifies the balance between the potential gain and the potential loss in a trade. It’s a critical tool that aids traders in choosing trades wisely, ensuring they opt for opportunities that promise high rewards while keeping risks minimal.
Calculating the Ratio:
The calculation itself is straightforward. By dividing the potential loss by the potential profit, traders can gauge the attractiveness of a trade. For instance, if a trade has a potential loss of $5 and a potential profit of $15, the risk/reward ratio would be 1:3, indicating that for every unit of risk, there's the potential for three units of reward.
Implementing the Ratio in Trading:
Successful traders plan their trades, setting predetermined entry and exit points. This strategy allows to calculate the risk/reward ratio accurately, ensuring trades with favorable ratios.
For instance, consider a scenario where a trader aims for a 15% profit and sets a stop-loss at 5%. By maintaining a discipline of setting targets based on market analysis rather than arbitrary numbers, traders can achieve a consistent profits.
The Synergy with Win Rates:
Combining the risk/reward ratio with win rates elevates a trader's strategy. A higher win rate indicates more successful trades, further enhancing the overall profitability. For instance, a trader with a 60% win rate can afford a lower ratio, say 1:1 minumum, as the majority of their trades are profitable.
The Power of the Risk/Reward Calculation:
The true power of the risk/reward ratio lies in its ability to provide traders with an asymmetric opportunity. This means that the potential upside is significantly greater than the potential downside, leading to more profitable trades over the long term.
Keeping Records for Improvement:
Maintaining a trading journal is crucial. By documenting trades, traders gain a comprehensive understanding of their strategies' performance. Analyzing these records aids in adapting strategies for different market conditions and asset classes, leading to refined decision-making.
In conclusion, mastering the risk/reward ratio is paramount for every trader aiming for consistent profitability. By understanding, calculating, and implementing this ratio alongside win rates, traders can make informed decisions, mitigate risks, and ensure sustainable success in the volatile world of trading. So, remember, in the world of trading, it's not just about how much you win; it's about how much you win concerning what you risk.

How to Use Divergence
Hey traders!
RSI divergence, a key concept in technical analysis, occurs when the relative strength index (RSI) of an asset shows different patterns compared to its price movements.
If you like my graphics, share some 💙💛
Bullish Divergence:
In a bullish divergence, the RSI indicates the asset is oversold, forming higher lows, while the price action forms lower lows. This signifies a shift from selling pressure to buying interest. The sellers' last attempt to control the market is met with increasing buying volume.
Bearish Divergence:
Conversely, in a bearish divergence, the price achieves higher highs, reflecting the final push from buyers, while the RSI forms lower highs. This classic overbought scenario signals potential reversal as buyers lose momentum.
These divergence patterns provide reversal signals, whether in trending or ranging markets. It's essential to note that relying on a single strategy is not sufficient for consistent profits, however combining various strategies and setups enhances your win rate. Always trade with a risk level that aligns with your financial capacity.
Share Your Insights! Which indicator do you prefer for identifying divergence? Let me know in the comments below.

Basics of Elliott Wave TheoryWelcome to the world of Elliott Waves.
If you appreciate our charts, give us a quick 💜💜
Elliott Wave Theory revolves around three key elements:
Impulse waves (in the direction of the trend)
Corrective waves (against the trend)
Wave degrees
Impulse waves consist of five sub-waves, while corrective waves comprise three. These waves form cycles, representing market psychology in action.
Key Rules of Elliott Waves
Wave 2 cannot retrace beyond the starting point of wave 1.
Wave 3 must be longer than both wave 1 and wave 5.
Wave 4 cannot exceed the end point of wave 1.
Elliott Waves and Fibonacci Retracement
Incorporating Fibonacci retracement levels refines Elliott Wave analysis. The fourth wave often hovers between 23.6%, 38.2% and 50%, while correction waves C often unfold within the 50% to 61.8% range.
Elliott Waves as Guides, Not Guarantees
It’s crucial to view tools like Elliott Wave Theory as guiding lights, not crystal balls. While they don’t assure foolproof predictions, they offer a framework to decipher market cycles. As patterns repeat, understanding market psychology becomes the trader’s edge.

USOIL DAILY TIME FRAME The Structure looks good to us, waiting for this instrument to correct and then give us these opportunities as shown on this instrument (Price Chart).
Note: Its my view only and its for educational purpose only. Only who has got knowledge about this strategy, will understand what to be done on this setup. its purely based on my technical analysis only (strategies). we don't focus on the short term moves, we look for only for Bullish or Bearish Impulsive moves on the setups after a good price action is formed as per the strategy. we never get into corrective moves. because it will test our patience and also it will be a bullish or a bearish trap. and try trade the big moves.
we do not get into bullish or bearish traps. We anticipate and get into only big bullish or bearish moves (Impulsive Moves). Just ride the Bullish or Bearish Impulsive Move. Learn & Know the Complete Market Cycle.
Buy Low and Sell High Concept. Buy at Cheaper Price and Sell at Expensive Price.
Keep it simple, keep it Unique.
please keep your comments useful & respectful.
Thanks for your support....
Tradelikemee Academy

EXPLAINED BASIC CONCEPTS OF TRADE📊📈 Unleash Your Trading Potential with These Proven Strategies! 🚀
Hello, Aspiring Traders!
Are you ready to embark on the exciting path to trading success? Trading isn't just about making profits; it's a disciplined business, an art form, and a psychological challenge. The keys to success are deceptively simple but often overlooked.
✨ Trading is NOT Gambling!
Bid farewell to unrealistic expectations and the notion that trading is akin to rolling the dice. To steer your journey in the right direction, follow these steps:
🚀 Set and Maintain Risk-Reward Ratios.
Never risk more than 1% of your deposit on a single trade. Ensure control over your risk exposure by using variable lot sizes, regardless of market conditions.
🚀 Steer Clear of the "All-In" Approach.
Resist the urge to place your entire account balance on a single trade in the hopes of recouping losses. Trading is about learning, not desperation.
🚀 Safeguard Your Capital with Stop Loss Orders.
Utilize Stop Loss (SL) orders consistently. Avoid relying on manual closures, as emotions can lead to costly decisions.
🚀 Establish Daily and Weekly Loss Limits.
Set sensible limits. If you encounter three consecutive losses in a day, take a break. If your losses exceed 10% of your account within a week, step back for the following week. This break is crucial for your growth as a trader.
✨ Maintain a Calm and Collected Demeanor
Successful traders exhibit a unique blend of discipline akin to a robot and the intuitive faculties of a human. Remember, entering the market too early or too late is just as detrimental as being wrong. Maintain your composure:
🧘 Keep Emotions in Check.
Euphoria and panic are your adversaries. Emotions belong in the casino, not in trading.
🧘 Steer Clear of FOMO (Fear of Missing Out).
Don't trade out of fear or impatience. Premature entries driven by FOMO can lead to losses.
🧘 Forge Your Own Path.
Resist the temptation of herd mentality. Successful traders are independent thinkers.
🧘 Cultivate a Diverse Watchlist.
Focus on instruments with setups you understand work. Avoid inventing trades that don't align with your strategy.
✨ Consistency is the Key to Triumph
Steady gains are far superior to volatile boom-bust performances. Here's your roadmap to consistency:
📊 Discover Your Trading Strategy.
Thoroughly research and select a trading strategy that aligns with your personality and comprehension.
📊 Employ Paper Trading and Backtesting.
Test your strategy in real-time and refine it through paper trading and the analysis of historical data.
📊 Monitor Your Trades.
Maintain meticulous records to pinpoint your strengths, weaknesses, and recurring patterns in your trading.
📊 Codify Your Rules.
Establish a precise algorithm for your trading strategy to minimize emotional decision-making.
🚀 In Conclusion: Embrace the Journey!
Trading is a long-term endeavor, not a shortcut to wealth. Along the way, you'll face challenges, losses, and setbacks, but when you succeed, you'll unlock the path to financial freedom!
🙌 Show your support for these strategies with a LIKE and share your thoughts in the COMMENTS! Let's navigate the world of trading and reach success together! 🌟

Understanding Euro Zone Economic NewsEuro Zone Economic News Explained:
Purchasing Managers Index Manufacturing:
The Purchasing Managers Manufacturing report is a survey of manufacturing providers in the Eurozone (EZ) and focuses in on issues such as costs and demand.
Essentially, a strong PMI, in which costs are low and demand is improving is bullish for the Euro, whereas a survey that results in increasing costs and decreasing demand implicates speculation against the Euro.
Manufacturing is a significant component of the EZ economy, and thus a survey that indicates optimism or pessimism about the sector can really get the markets moving, the Euro in particular.
A reading of 50 is a critical measure in the PMI index with a number below 50 indicating contraction and a number above 50 indicating expansionary conditions. Taking a strong position based solely on the PMI Manufacturing Survey though could prove to be regretful.
Purchasing Managers Index Services:
The Purchasing Managers Services report is a survey of service providers in the EZ and focuses in on issues such as costs and demand.
Essentially, a strong PMI, in which costs are low and demand is improving is bullish for the Euro, whereas a survey that results in increasing costs and decreasing demand implicates speculation against the Euro.
A reading of 50 is critical measure in the PMI index with a number below 50 indicating contraction and a number above 50 indicating expansionary conditions.
The services sector is very important to the EZ and any significant gains or shortcomings could set the Euro climbing or falling.
Retail Trade:
Retail Trade is the measure of retail sales, and thus the willingness of the consumer to spend.
An upswing in this figure could result in Euro buying whereas a shortfall could cause Euro selling.
This number is very important to the trader because it correlates to consumer conditions and outlook within the EZ region.
If the Retail Trade figure comes in strong it means that consumers are spending money and thus are probably well off, hinting that EZ consumer confidence and the CPI may also be strong.
However, if Retail Trade figures are low, it could suggest that interest rates are too high, consumer confidence is sinking, or businesses are suffering. Clearly, a worse than expected Retail Trade figure offers more information (though ambiguity hand-in-hand) than does a strong figure because a strong figure seeks reinforcement from other indicators (such as the CPI and Consumer Confidence survey) and thus lags, whereas a less-than-expected figure immediately suggests that the EZ economy is most likely turning sour in one respect.
Traders will often react immediately to this release, but much caution is exercised due to the wide array of implications this number carries with it. It is inadvisable to trade solely on this figure.
German Retail Sales:
German Retail Sales are very similar to the Retail Trade figure but differ in that they report an aggregate number of sales at retail outlets to provide for a better estimate of German private consumption.
Like in Retail Trade, traders will often look to long the Euro should the figure be impressive, and short the European currency should it fall below expectations.
Much like Retail Trade, traders will use the Retail Sales figure to better understand the direction of the economy in terms of other key economic releases. One of the few advantages the German Retail Sales has over Retail Trade is the time of release. Because the German figure is reported before the EZ number, traders can “jump the gun” should they wish, though acting in such a manner is not usually advisable in the Forex market.
Eurozone Gross Domestic Product:
The general rule of thumb when using GDP as a fundamental signal to trade is that an improved number means Euro positive whereas a lesser or unchanged figure translates into Euro stagnancy or bearishness.
The Eurozone Gross Domestic Product is a measure of the progress of the Eurozone economy as a whole.
The figure is very important to traders because it gauges the level of performance with which the Europeans are proceeding as well as harbingers and undermines the set of economic data that is expected to be reported from the region during a certain time period.
Generally, the disclosure of a number that’s either expected or ahead of forecasts sets off bullish signals for the Euro; a number that falls below predictions invokes the Euro bears. GDP data for Germany, France, Italy, and the collective Eurozone region tend to be most closely followed.
Current Account:
The Current Account Deficit is probably the most comprehensive measure of international transactions for Europe as it is the measure of net exports, (total exports minus total imports).
If the figure falls below expectations, slight movements against the Euro should be expected. But it is also important to keep in mind that a number that outperforms or either falls short of expectations is not necessarily going to get the traders to act hastily.
The release of this number is monthly and tends to be in accord with the Trade Balance numbers that are generally reported a day or two in advance of the Current Account figure.
The Current Account Deficit is usually interpreted in one way; a large negative number is damaging to the European currency. This is because the Current Account is a reflection of the net exports, and if it is negative, it shows that the Eurozone is importing more than it is exporting; a bad sign for industries at home and means that more Euros are going out of than coming into the region.
However, the negativity of the number is not what traders pay attention to, but rather the change in it; the marginal change in the Current Account. The logic is very similar to that behind the GDP in that if a number comes in below expectations, it could hurt the Euro, whereas if it out performs forecasts, it could prove bullish for the European currency (despite its negativity).
However, this number cannot be solely “judged by its cover” because the number says a lot more than meets the eye. For instance, a more negative figure does indeed signal a decrease in net exports, but at the same time could also serve to patron other economic releases, such as consumer spending.
If the Europeans are spending a lot of money, and that money is leading them to buy things from abroad as their fiscal conditions are allowing them to do so, then a decrease in net exports doesn’t seem so “damaging” to the Eurozone economy; it could simply mean people are buying things exotic to them because they are better off. Generally though, the trend in industrialized western nations (Eurozone included) has been that a more negative Current Account is damaging to industries at home. So if the figure falls below expectations, at least slight movements against the Euro should be expected.
Unemployment Data:
Unemployment is a very significant indicator for Eurozone performance.
It is reported in the beginning of every month and measures the percentage of the workforce that is currently out of a job but is actively seeking to be employed.
Generally, traders understand slight improvements in the unemployment figure (as monthly figures generally vacillate by tenths of percentages) to be positive for the Eurozone economy and will buy Euros, whereas a no-change or increase in the unemployment numbers could lead to Euro stagnancy or dumping across the board.
The figure is important because it signals how hard the Eurozone is actually working and helps to foreshadow consumer spending. High unemployment generally leads to lower consumer spending which can be bearish for the Eurozone economy as well as the Euro. The flip scenario is also true, weak Eurozone employment is bearish for the economy as well as the Euro.
Generally speaking, unemployment raises concerns about the performance of firms, questioning whether businesses are either not hiring because they do not need more help, or are not hiring because they cannot afford to do so. If the latter is the case, then it could prove even more bearish for the Euro as it could be forecasting sour economic data regarding the productivity of businesses.
German Unemployment:
The German Unemployment figure is expressed in thousands and measures the change in unemployment in Germany; a positive figure says that more people are unemployed, thus leading to Euro selling, whereas a negative figure is indicative of decreasing unemployment and thus leads to Euro buying.
Germany is important because it is the Eurozone’s largest economy.
Any big or unexpected movements in this country have significant consequences for the Euro. This figure usually coincides with the Unemployment rate, but offers “greater detail” as it reports actual numbers, so that traders may have substance to trade off of if the rate itself remains unchanged.
Consumer Price Index:
The Consumer Price Index measures the change in price for a fixed basket of goods and services purchased by consumers.
The higher the CPI, the more positive it is for the Euro, whereas the opposite is also true.
The ECB has a 2% inflation target, so whenever consumer prices grow by more than 2%, the ECB becomes concerned and contemplates the need for rate hikes.
If consumer prices grow by much less than 2%, the central bank has more flexibility to adjust monetary policy and interest rates. If the CPI has substantial gains, then the ECB would have the incentive to raise interest rates to keep inflation in check, thereby benefiting the Euro.
However, if the CPI remains idle, or prices decrease, then even a rate cut is possible.
CPI itself though consists of a few major components: one that includes energy prices, and one that includes food prices.
These two constituents are very volatile and thus tend to sometimes “exaggerate” the CPI.
Though they are undoubtedly considered when considering inflationary concerns, many times traders will also focus in on the “core CPI” to see how the change in prices in other sectors measured up to the changes in these two key areas.
Either way, a sharp increase would generally prompt Euro buying, and a decrease would call for Euro dumping.
German ZEW Survey:
The German ZEW economic survey reflects the difference between the number of economic analysts that are optimistic and the number of economic analysts who are pessimistic about the German economy for the subsequent six months.
Obviously, a positive figure bodes well for the Euro, while a negative number foreshadows Euro selling.
The ZEW survey is important because firstly, it gauges the economic productivity of Germany, the Euro-Zone’s largest economy. Secondly, it forecasts the string of economic releases concerned with the different sectors of the economy. For instance, something like Factory Orders, Industrial Production, or even Retail Sales could be implicated (or at least their negative or positive changes) in the ZEW survey.
Therefore, the survey is one of the key economic indicators that move the Euro during its time of release; the sentiment that results usually fuels the Euro strongly in one direction (at least in the short-term intra-day period).
German IFO Survey:
The Germany IFO economic survey is much like the ZEW economic survey in that it measures the sentiment, the confidence, in the German economy, but differs in that it includes the market-moving words of business executives.
Usually, an improvement in the figure leads to Euro bullishness whereas a decrease or an unchanged number leads to either Euro stalemating or dumping.
The IFO survey usually follows the ZEW and reflects sentiment along the same lines.
However, should there exist a discrepancy between the ZEW and the IFO, traders tend to give the ZEW a bit more favoritism because it lacks the bias of business executives.
Trading on either the ZEW or IFO survey isn’t usually very lucrative, unless both of these numbers are in line with each other and reinforce other key fundamental indicators as well.
Industrial Production:
The Industrial Production figure is a measure of the total industrial output of them Euro-Zone either on a monthly or yearly basis.
The number is very significant as an improvement in the figure could lead the Euro to make significant gains whereas a decline or stagnant number could lead to weakness in the European currency.
The reason Industrial Production is important is because it is a confirmation of its type of preceding economic releases (PPI, CPI, Retail Sales, etc.); the only key data following the IP figure being the Eurozone CPI estimate.
This is why many times, by the time the Industrial Production data is due for release, traders will argue that the market has already “priced in” industrial productivity in the previous economic releases.
Therefore, though large gains or losses in this figure could spark some immediate movement in the market, the market has more or less, factored in the expected Industrial Production data.
German Industrial Production:
German Industrial Production is a composite index of German Industrial Output that accounts for about 40% of GDP.
This figure is very important because it measures the level of German Industrial Production; an improvement usually signals a “buy” in the Euro, whereas a decline in the figure constitutes a “sell” to many traders.
The reason this particular IP report is more important is because not only does it measure the industrial output of Germany, the EZ’s largest economy, but also because of the fact that though it comes out late in the month, it is one of the first IP reports, and thus serves as a harbinger to the EZ IP report; if Germany saw decline, then the EZ IP report probably won’t be too bright, at least from the perspective of the trader.
In a sense, the EZ IP continues to get priced in before its release.
The German release has four significant components: manufacturing, which constitutes 82% of the figure, construction, which accounts for 9.5%, energy that has a 5.9% share, and mining which has the smallest share at 2.7%. Though all four components are important for Germany, movement in its largest constituent, manufacturing, usually carries the weight of the figure and has the attention of traders.
German Factory Orders:
German Factory Orders is an index of the volume of orders for manufactured products in Germany.
This is a key figure for many traders, as an improvement in the number signals buying of the Euro, while a shortcoming signals a sell-off.
The reason this reading is important is because Factory Orders not only reflect the strength of businesses but also help forecast other key economic releases such as retail sales.
If orders are high, then businesses need more inventory, meaning that consumers are probably purchasing more.
Traders key in on this figure, especially its components, before reacting towards the Euro.
The four major constituents of German Factory Orders include intermediate goods (45.6%), capital goods (35.1%), consumer durables (11.8%), and consumer non-durables (7.4%). All four are very significant, but for different reasons.
Traders will take the first two figures, the intermediate goods and capital goods, as an understanding of the strength of businesses within Germany.
If there is an increase in these categories, then subsequent economic releases such as the PMI could also look very bright.
The second two say much about consumer confidence and retail sales; if these two sectors are outperforming expectations, then the Euro could see significant gains.
However, traders are usually wary when interpreting the German factory orders, because given some economic scenarios, gains in some sectors may very well offset losses in others whereas during certain time periods a different emphasis may be given to the different components. Therefore prudent traders will usually first consider the weight of each component before the release comes out and then act accordingly.
Eurozone Labor Costs:
The Eurozone Labor Costs (inclusive of both direct and indirect) figure reports the expenditures endured by employers in the EZ region in order to employ workers.
Traders will generally understand higher costs to be negative for the EZ and consequently short the Euro, whereas decreasing costs may result in buying the Euro. However, it is advisable to understand the complexities involved in labor costs.
On one hand, labor costs could be interpreted as a negative for businesses, but on the other hand they could be viewed as a positive stimulus for the economy. This is because firms may simply be hiring more qualified and thus more “expensive” individuals to increase specialization.
If this is the case, then individuals within the economy may be better off, signaling that optimism is rising in the EZ; the Euro may see more gains. Also, there exists the possibility that while costs are rising, revenue is also rising, thus keeping total profit for businesses constant, and at the same time increasing payouts to workers, a signal that the EZ is expanding.
In this case, the Euro may also be bought. However, understanding this complexity is again subject to the current economic scenario surrounding the EZ; if it is in a situation where expansionism is fertile or businesses have excess capital, then only can the increasing costs in labor justify a long position in the Euro. If that is not the case then increasing labor costs will result in Euro shorting.

EURUSD sellEur usd is has broken its daily significant support level and now heading toward to daily level also moving in down trend under a trendline from H4 now we have entered a trade as we have spotted a bearish Engulfing on H4 time frame now we see

The Relative Strength Index Explained [RSI]Hello traders and investors! If you appreciate our charts, give us a quick 💜. Your support matters!
The Relative Strength Index (RSI) is a powerful tool used in technical analysis to gauge the momentum and potential overbought or oversold conditions of an asset. Here's a breakdown of how it works:
Time Period and Calculation:
By default, the RSI measures the price changes of an asset over a set period, which is usually 14 periods.
These periods can represent days on daily charts, hours on hourly charts, or any other timeframe you choose. The formula then calculates two averages: the average gain the price has had over those periods and the average loss it has sustained.
Momentum Indicator:
RSI is categorized as a momentum indicator. It essentially measures how quickly the price or data is changing. When the RSI indicates increasing momentum and the price is rising, it signals active buying in the market. Conversely, if momentum is increasing to the downside, it suggests that selling pressure is intensifying.
Momentum Explained:
Momentum in trading is like measuring how fast a car is speeding up or slowing down. In the case of RSI, it's all about understanding if a cryptocurrency or stock is picking up speed in its price changes or slowing down.
RSI as a Trend Strength Indicator:
Think of RSI as a meter that shows you how strong the current trend is in the world of trading. It's like checking the engine power of a car to see how fast it can go.
Shifting Frame Analogy:
Imagine RSI as a shifting picture frame. This frame covers a certain number of periods, say 14 days, just like a moving window in time. When a day with a significant loss falls out of this frame, and days with substantial gains come into view, it's as if the frame is shifting to reveal a brighter picture. This shift in the frame is reflected in the RSI. If the new days are bringing in more gains than losses, the RSI goes from being low (indicating a weak trend) to high (indicating a strong trend).
RSI and Momentum:
RSI acts like a swinging pendulum, moving back and forth between 0 and 100. It tells you the current speed of price changes in the market.
When RSI is going up, think of it like a rocket taking off – it indicates bullish momentum, meaning prices are likely rising.
Conversely, when RSI is going down, it's like a balloon deflating – this suggests bearish momentum, indicating prices are likely falling.
Overbought and Oversold Conditions:
RSI helps you spot extreme conditions in the market.
If RSI goes above 70, it's like a warning sign that the price might have gone up too fast, and the asset could be overbought. It's a bit like when a stock is in high demand, and everyone's rushing to buy it.
On the flip side, if RSI drops below 30, it's a signal that the price may have fallen too quickly, and the asset could be oversold. It's a bit like when a stock is out of favor, and everyone's selling it.
So, when you see RSI crossing these thresholds, it's like a traffic light for traders. Above 70 is like a red light (be cautious, price may reverse), and below 30 is like a green light (consider buying, price may bounce back). These are handy rules of thumb for making trading decisions!
Price Reversals in Overbought/Oversold Territory:
When a stock or cryptocurrency's price is in the overbought or oversold territory (RSI above 70 or below 30), it's like a warning sign that a reversal might happen.
However, it's important to remember that these levels don't guarantee an immediate reversal. Just because RSI is high doesn't mean you should rush to sell, and vice versa. Prices can remain in these extreme zones for a while before reversing.
RSI as a Tool, Not a Sole Decision Maker:
RSI is a tool in your trading toolbox, not a crystal ball. It's one piece of the puzzle. It's not accurate to say, "RSI < 30 equals an automatic buy signal, and RSI > 70 equals an automatic sell signal." Trading involves more factors and judgment than that.
Consider Multiple Timeframes:
Looking at different timeframes is like zooming in and out on a map. It provides a more complete picture of what's happening. For example, if the daily RSI is showing overbought conditions, but the weekly RSI is still in a healthy range, it suggests a different perspective. The longer-term trend may still be intact.
Oscillating Indicator:
RSI oscillates between 0 and 100, providing traders with a visual representation of an asset's strength or weakness. The scale helps identify potential overbought or oversold market conditions. An RSI score of 30 or lower suggests that the asset is likely nearing its bottom and is considered oversold. Conversely, an RSI measurement above 70 indicates that the asset price is likely nearing its peak and is considered overbought for that period.
Customization:
While the default setting for RSI is 14 periods, traders can adjust this parameter to suit their trading strategies. Shortening the period, such as using a 7-day RSI, makes the indicator more sensitive to recent price movements.
In contrast, using a longer period like 21 days reduces sensitivity. Additionally, some traders adapt the overbought and oversold levels, using 20 and 80 instead of the default 30 and 70, to fine-tune the indicator for specific trading setups and reduce false signals.
Divergences:
Divergences occur when the price of an asset and its RSI are moving in opposite directions. It's like having two friends walking together but going in different directions.
Regular Divergences:
Imagine this like a traffic signal turning red when everyone's used to it being green.
Regular divergences signal a potential trend reversal. For example, if the price is going up (bullish), but RSI is going down (bearish), it could indicate that the bullish trend is losing steam, and a reversal might be on the horizon.
Hidden Divergences:
Hidden divergences are like a green light at a junction where everyone expects red.
They signal a potential trend continuation. For instance, if the price is going down (bearish), but RSI is going up (bullish), it could mean that the bearish trend might continue but with less intensity.
Learn more about divergence:
Practical Use and Timeframes:
Divergences are like big road signs on a highway. They're often easier to spot on higher timeframes, such as daily or weekly charts, where the broader trend becomes more apparent. When you see a divergence, it's like getting a heads-up that something interesting might happen in the market, but it's important to combine this signal with other analysis and indicators to make informed trading decisions.

Types of RetestsHere you can see few examples of a Retests 📊
⚫️ First example is a regular support and resistance retest. It occurs after price breaks this zones. Price then goes back to test previous support or resistance and this is usually good place to enter a trade.
⚫️ Second example is a supply and demand retest.
⚫️ Third example uses help of volume profile indicator. Areas of a high volume profile represent zones where potential retest can occur.
⚫️ Fourth example is a simple trendline retest. Very useful when you look for a reversal entries.

Ascending Channels: The GuideGreetings, @TradingView community! This is @Vestinda, bringing you a helpful article on the topic of Ascending Channels!
An ascending channel, a potent chart pattern, stands out with two upward-slanting trend lines that define support and resistance levels. Also known as "rising channels" or "upward channels," these patterns offer insightful indications for traders. The foundation is laid with the lower trendline, which connects lows and establishes the trend. The "channel line," running parallel to the lower trendline, links highs, solidifying the pattern.
Ascending channels, regarded as a continuation pattern, often break in line with the current trend direction. Savvy traders might explore both long and short trades at both trendlines, anticipating rebounds.
An alternate strategy involves waiting for a trendline breakout. Breaching the upper trendline triggers a robust buy signal, while slipping below the lower trendline implies a compelling sell signal. Breaking the trendline against the trend suggests a significant trend change, while aligned breakout accelerates the existing trend. Prudence is crucial, as channels might witness false or premature breakouts, causing retracements.
These channels serve as valuable predictors of overarching trend shifts. While within the ascending channel, an upward trend remains plausible. Another angle involves tracking where prices stall short of the upper trendline – a potential sign to a trend reversal. In such cases, breaching the lower trendline is more likely.
Often nestled within a broader downtrend, ascending channels mirror either trend continuation or reversal, contingent on breakout direction.
Strategies for Trading Ascending Channels:
1. Measuring Price Targets: Calculate a price target within an ascending channel by measuring its widest point (upper trendline to lower trendline) and adding it to the breakout point for an upward breakout, or subtracting it for a downward one. This provides an outlook on potential price movements.
2. Volume Confirmation: Observe trading volume during channel dealings. Breakouts accompanied by high volume signal reliability and market conviction.
3. Oscillator Use: Incorporate indicators like the Relative Strength Index (RSI) and Moving Average Convergence Divergence (MACD) to spot overbought or oversold conditions within the channel. Extreme readings suggest possible reversals or pullbacks.
Risks and Considerations:
1. False Breakouts: Channels occasionally yield false breakouts – a brief exit beyond trendlines followed by a return. Wait for confirmation before trading.
2. Timeframe Matters: Ascending channel reliability hinges on the timeframe. Longer-term charts offer robust signals, while shorter-term ones might be noisy.
3. Market Conditions: Evaluate broader market conditions and potential impactful events. Economic releases, geopolitical shifts, and unforeseen news can disrupt technical patterns.
4. Risk Management: Apply proper risk management – set stop-loss orders to mitigate potential losses tied to ascending channel patterns.
Ascending channels are indispensable tools for traders, enabling precise trend analysis and informed decision-making. By using chart patterns, technical indicators, and risk management, traders can optimize gains while managing potential risks.
Happy trading!

A Comprehensive Daily Routine of TraderGreetings, fellow traders and investors of @TradingView !
Trading in the financial markets is often likened to a battleground of strategies, psychology, and data analysis. To navigate this dynamic landscape successfully, we need more than just luck; we need a well-structured daily routine that blends education, analysis, and real-time decision-making. In this article, we delve into a comprehensive daily routine that can set traders on the path to success.
1. Read Heavy Subjects
Every trader knows that staying ahead in the game requires continuous learning. Reading trading-related books and articles is an essential part of honing one's skills. However, it's not just about skimming through the surface; the real value lies in diving into heavy subjects. Delve into trading psychology, technical analysis, fundamental analysis, and risk management.
Psychology books can help you understand the emotional aspect of trading, which often plays a pivotal role in decision-making. On the technical side, learning about chart patterns, indicators, and trend analysis can enhance your ability to identify profitable opportunities. Fundamental analysis books offer insights into evaluating a company's financial health, which is crucial for trading stocks. By dedicating time to reading heavy subjects, traders can fortify their knowledge base and make informed decisions.
2. Learn From Others
In the age of social media and online communities, learning from experienced traders has become more accessible than ever. Platforms like TradingView and Twitter are treasure troves of insights and strategies shared by smart traders. Engaging with these platforms allows you to learn from others' experiences, understand their thought processes, and adopt successful trading strategies.
However, a word of caution is necessary here. While learning from others is valuable, it's crucial to develop your own analytical skills and not blindly follow someone else's advice. Use these insights to inform your decisions, but always verify and validate the information before acting upon it.
3. OnChain Metrics
In the realm of cryptocurrency trading, where blockchain technology reigns, on-chain metrics can be powerful indicators of market trends. Tools like GlassNode and ArkhamIntelligence provide insights into on-chain activities, such as large transactions made by institutional investors (Smart Money) or significant movements by whales (holders of large amounts of cryptocurrency). Monitoring these metrics can give you a sense of potential market movements and sentiment shifts.
However, it's important to remember that while on-chain metrics can provide valuable context, they are not foolproof predictors of price movements. Cryptocurrency markets are influenced by a complex interplay of factors, and combining on-chain data with other types of analysis can yield more accurate insights.
4. Watch the Numbers
In trading, numbers are your allies. Monitoring market data, price movements, trading volumes, and other relevant metrics is a fundamental part of a trader's routine. Platforms like Tokenterminal and DefiLlama provide data on token performance and decentralized finance (DeFi) protocols, allowing traders to identify trends and potential opportunities.
Unusual spikes or drops in numbers can indicate significant market shifts, which might warrant further investigation. However, like any other analysis method, numbers should be interpreted within the broader market context. One should avoid making impulsive decisions solely based on numerical fluctuations.
Trading is a discipline that requires constant learning, adaptability, and discipline. Following a structured daily routine that involves in-depth reading, learning from experienced traders, monitoring on-chain metrics, and analyzing market numbers can greatly enhance a your chances of success. However, it's important to maintain a critical mindset, verify information, and integrate various analysis methods to make well-informed trading decisions.
Remember, a robust routine combined with a healthy dose of intuition can be a powerful combination in the world of trading.

Avoid getting trapped and hunted by market sharks!Stop Loss Hunt, Liquidity Sweep, Market Manipulation - all of these are fancy names of a highly frequent act performed by big sharks of the market to target the retailers.
- "Oh, do you think they care about my 0.01 lot size?"
Individually, not.
In big volumes, yes.
Textbook chart patterns that are so prominent to us are all subject to going through a liquidation phase. Hence, let's look at some graphical examples that will also be supported by real-market instances:
1) "Head&Shoulders" liquidation
Upon forming a right shoulder and showing initial bearish moves, market participants tend to execute short positions and place their Stop Loss order above the freshly formed shoulder. In that case, there is a high probability that the price will get driven towards the Stop Loss pool, grab liquidity, then continue impulsing in the pre-determined destination.
A live-market example: EUR/GBP Daily Timeframe (period: 28/06/2023 - 16/08/2023)
2) Double Top liquidation
Similar to the previous point, upon forming two tops/heads/reversal points, the price shows some bearish moves and invites sellers to take action before we witness the price impulse towards the upside and grab liquidity where masses have set their Stop Loss levels before resuming its bearish moves
A live-market example: USD/CHF Weekly Timeframe (period: 09/05/2022 - 07/11/2022)
3) Parallel Channel liquidation
Trading within two boundaries of a parallel channel, oftentimes, we may witness how wick spikes are printed and liquidity is grabbed.
A live-market example: USD/CHF Weekly Timeframe (period: 16/01/2023 - 21/08/2023)
4) Ranging Market liquidation
Being stuck in a sideways-moving liquidation box, it is commonly evident how the price triggers the sea of retail Stop Loss orders to both sides of the rectangle with a sole purpose of taking out early entrants before moving in the pre-orchestrated destination.
A live-market example: USD/CHF 8H Timeframe (period: 16/06/2023 - 10/07/2023)
To put all in a nutshell, be careful in order to not fall into the Liquidity Aquarium.

Six Ingredients to be a TraderGreetings, fellow traders and investors of @TradingView !
Financial markets offers limitless opportunities for earning and investing. Amidst all the available instruments, trading stands out as an exhilarating realm of dealing with securities, currencies, and other assets.
But how do you know if trading is the right path for you?
In this article, we will explore key aspects that will help you determine whether trading is your true calling.
Analytical Mind and Problem-Solving Skills: Traders need to analyze market data, predict trends, and make swift decisions. If you relish solving complex problems and seek rational approaches to decision-making, this is an indicator that trading could align with your strengths.
Patience and Self-Discipline: Success in the world of trading doesn't come overnight. Patience and a willingness to work on your skills will help you endure tough moments and maintain composure during market fluctuations.
Interest in Financial Markets: If you've always been intrigued by finance, economics, and global events that impact the market, trading can become an intellectually engaging pursuit for you.
Readiness for Continuous Learning: Markets are constantly changing, requiring traders to refresh their knowledge and skills. If you're willing to keep learning and evolving, you'll find the world of trading both engaging and vital.
Emotional Resilience: Trading can be emotionally draining, particularly during rapid market shifts. The ability to control fear, greed, and euphoria is crucial for a trader.
Tolerance for Risk: Trading comes with the risk of capital loss. If you're prepared to logically evaluate risks and make informed decisions, it can be an indicator of your suitability for this endeavor.
Trading is a captivating and intricate domain that isn't suitable for everyone. If you possess qualities such as an analytical mind, patience, an interest in finance, and a capacity for continuous learning, you have the potential to become a successful trader.
Remember that success in trading demands self-improvement, ongoing education, and adept emotional management.

The Quest for the Trading "Holy Grail": A Realistic PerspectiveDiscover why the concept of a trading "holy grail" is more myth than reality. Why successful trading involves understanding market uncertainties, human behavior, and adaptable strategies?
Experienced traders know: there's no magical "holy grail" guaranteeing 100% profits. In truth, consistent traders recognize losses as much a part of trading as gains. Despite this, a stream of novice traders still seek the one-size-fits-all path to profitability.
Consider these three reasons why discovering a trading "holy grail" is as likely as reaching the sun:
Unpredictable Market Uncertainties: The market's complexity thwarts all-knowing predictions. Influences are countless, making extended manipulation improbable. Unless you've got superpowers foreseeing central banker statements or impending crises, the holy grail remains elusive.
Human Behavior Influences Markets: Human decisions continue to shape market dynamics. While automated systems play a role, it's human actions that cause market fluctuations. Trading opportunities emerge from discrepancies between price and value, often influenced by individual interpretations. Variations in approaches, like Nick vs. Mike, and factors like John's hesitance to cut losses, contribute to market complexities.
Adaptable Strategies are Essential: Market patterns echo human behavior, but shifting conditions render "surefire" systems obsolete. The ebb of trend-following tools demonstrates adaptability's importance. Profits hinge on discretion, recognizing pattern shifts, and mastering risk management.
Remember, a holy grail isn't essential for trading success. Full-time and part-time traders alike profit with prudent risk management. Understanding of risk management — your keys to sustainable trading success.

Using the Research Method in TradingGreetings, fellow traders!
Trading is both an art and a science, and the research method is your secret weapon to unraveling market intricacies. It's about adopting a systematic approach, making informed decisions, and refining your strategies based on solid data.
Applying a analytic mindset in trading can offer a valuable edge. Let's explore the basics of the research method and how you can integrate it into your trading practices.
Start with Observation:
Just like scientists, traders begin by carefully observing the markets, noting patterns, and identifying repeat occurrences or random incidents. This process helps build a comprehensive understanding of market factors, that influence price action.
Formulate Hypotheses:
Based on your observations, create hypotheses or assumptions to explain market behavior. These hypotheses act as initial theories that can be tested for validity.
Test Your Hypotheses:
Conduct empirical tests by taking trades, that align with your hypotheses. Record the results and analyze how price action unfolds. Keep a detailed trade journal to document your observations.
Embrace Open-Mindedness:
Remain open to new data and market complexities. The markets are ever-changing, and no hypothesis is an absolute truth. Be prepared to adjust your trading strategies based on new information and shifts in market sentiment.
Fine-Tune Your Trading Plan:
Use the insights gained from testing your hypotheses to fine-tune your trading plan. Continuously refine your strategies based on new observations, and be flexible in adapting to changing market conditions.
Treat Each Trade as a Learning Opportunity:
View each trade as a source of valuable information, regardless of the outcome. Learn from both winning and losing trades to enhance your understanding of the markets and improve your trading approach.
By integrating the research method into your trading routine, you can enhance your decision-making process, manage risks more effectively, and avoid overconfidence.
Stay curious, keep learning. Happy trading!

Understanding the Learning CurveWelcome to @Vestinda new article about Learning Curve! We are delighted to share this insightful piece with our valued community on @TradingView !
At Vestinda, we believe in empowering traders with knowledge and tools to navigate the cryptocurrencies and futures trading. In this article, we will explore the concept of the learning curve and its relevance to the trading journey. Whether you are a novice trader or a seasoned professional, understanding the learning curve can be instrumental in your path to success.
If you focus and invest time into a subject, you will eventually reach a level of mastery.
The actual level clearly depends on the amount of invested time and to a significant extent on your inherent abilities to acquire the specific knowledge. I could probably spend a decade on quantum physics and not progress beyond the level of ‘enthusiastic beginner'. However, attaining mastery is seldom a smooth and linear journey. It is more like a curve in the mathematical sense, characterized by uneven ups and downs, reflecting the usual 'bumps in the road' that we all experience when dealing with challenging topics.
There is a pattern in the process of learning something new (knowledge, skills, etc.), which was formulated by the American psychologist Albert Bandura. This pattern is depicted in the form of a graph known as the Bandura curve.
The graph demonstrates the relationship between time (number of attempts), the level of human competence in what they are studying, and their expectations.
If you have ever enthusiastically started a new training, holding high hopes for it, and then quietly gave up, blaming others or anything else, then you are not alone. To avoid repeating this in the future, it's important to understand how human psychology and the system work, and that each of us is part of this system. Below, we will provide recommendations on what to pay attention to.
So, the Bandura curve shows the stages a person goes through when beginning to learn something new.
1. Clueless (You don't know what you don't know)
When you first venture into trading cryptocurrencies and futures, you are essentially clueless about the intricacies of the market. The concepts, strategies, and tools may seem foreign and overwhelming. It's like staring at a vast landscape without a map, unsure of where to even begin.
2. Naively confident (You think you know, but still don't know what you don't know)
As you begin your learning journey, you might gain some basic knowledge and techniques. This newfound understanding might lead to a sense of naively confident. You believe you have a handle on things, but in reality, there's a lot you're still unaware of, and the market can surprise you with unexpected turns.
3. Discouragingly realistic (You know what you don't know)
With more experience, you come to a point of realization that there is much more to learn. The challenges and complexities of trading become evident, and you may face setbacks that test your resolve. It can be a discouraging phase as you grapple with the reality of how much you still need to learn.
4. Mastery achieved (You know it)
Through persistence and a commitment to learning, you gradually achieve mastery in trading cryptocurrencies and futures. You've gained a comprehensive understanding of the market dynamics, developed effective strategies, and learned how to manage risks. You can now navigate the market with confidence and consistently make informed decisions.
Remember: The learning curve in trading is a natural part of the process, and each stage brings its own valuable lessons. Don't be disheartened by challenges or setbacks; they are opportunities to grow and improve your trading skills.
WHAT TO DO?
✅ Embrace the journey of learning and growth, recognizing that mastery takes time.
✅ Stay humble and open-minded, acknowledging that there is always more to learn.
✅ Be patient with yourself during the challenging phases and use them as motivation to improve.
✅ Keep refining your strategies and adapting to the ever-changing market conditions.
Can you identify which stage you are currently in your cryptocurrency and futures trading journey? Remember, each stage brings you closer to becoming a proficient trader.
We hope you found this article on understanding the learning curve in trading cryptocurrencies and futures helpful!
If you have any thoughts, questions, or personal experiences related to the topic, we'd love to hear from you. Please share your feedback in the comments below.
Your input is valuable to us and can help us create more content that resonates with your interests and needs.
Thank you for being part of our community!

The Pyramid of Trading SuccessGreetings, esteemed members of the @TradingView community and all Vesties out there!
The Pyramid of Trading Success is a conceptual model that outlines the fundamental principles and steps needed to achieve success in the trading world. It serves as a guiding framework for traders to build a strong foundation and gradually ascend towards becoming proficient and profitable in their endeavors. The pyramid consists of several layers, each representing a crucial aspect of trading mastery:
1. Emotional Well-being / Financial Stability / Trustworthy Broker (Base of the Pyramid)
Sought-after Qualities: Self-awareness, Constructive Self-evaluation, Rational Thinking, and Objectivity.
Prioritizing emotional well-being and financial stability is essential in the world of trading. Maintaining self-awareness allows you to understand your emotions and reactions, helping you make better decisions.
Engaging in constructive self-evaluation enables you to learn from mistakes and improve your strategies.
Rational thinking and objectivity ensure you approach trading with a clear and level-headed mindset.
Additionally, choosing a trustworthy broker is crucial for the security of your funds and the overall integrity of your trading experience.
2. Robust Safety System
Practice swift loss-cutting, avoid unreliable cryptocurrencies and low-quality stocks, refrain from gambling, and abandon the notion of overnight riches.
Implementing a robust safety system is paramount in trading.
Swift loss-cutting helps limit potential losses and protects your capital.
Avoiding unreliable cryptocurrencies and low-quality stocks minimizes risk and safeguards against scams.
Refraining from gambling ensures that you approach trading as a calculated investment, not a game of chance.
Finally, abandoning the notion of getting rich overnight fosters a long-term and sustainable approach to achieving financial success.
3. Portfolio Management
Rely on statistics and discard ineffective approaches. Monitor market trends regularly, consider long-term goals, stay informed about economic indicators.
Effective portfolio management relies on a statistical approach to decision-making.
By analyzing historical data and trends, you can make informed choices and discard strategies that have shown ineffective results.
Regularly monitoring market trends helps you stay on top of changes and adapt your portfolio accordingly.
Considering long-term goals ensures that your investment decisions align with your overall financial objectives.
Staying informed about economic indicators provides valuable insights into the broader market conditions that may impact your portfolio.
4. Asset allocation
Diversify your investments to spread risk. Requires years of experience in trading financial markets.
Asset allocation is a key strategy to manage risk and optimize returns.
Diversifying your investments across various asset classes, industries, and geographies helps reduce the impact of market fluctuations on your overall portfolio.
Achieving effective asset allocation often requires years of experience in trading financial markets to gain a comprehensive understanding of different investment opportunities and their performance characteristics.
5. Tools
Conduct backtesting of your strategies and consider automating your investments.
Utilizing the right tools is crucial for successful trading.
Backtesting allows you to test your strategies on historical data to evaluate their performance before implementing them in real-time. This helps refine your approach and increase the likelihood of success.
Additionally, automating your investments can streamline the execution process, ensuring timely responses to market conditions and minimizing emotional biases.
Here are simplified steps for strategy backtesting:
Define strategy parameters, financial market, and chart timeframe for testing.
Search for trades based on the specified strategy, market, and timeframe.
Analyze price charts for entry and exit signals.
Record all trades and calculate the gross return (including both winning and losing trades).
Deduct commissions and trading costs from the gross return to find the net return.
Compare the net return to the capital used to calculate the percentage return over the specified timeframe.
6. Remaining
Focusing on the essentials covered in the first five points is critical for your success as a trader.
Avoid getting distracted by other less crucial elements such as social trading or overly complex indicators.
While indicators can be useful tools, it's important to remember that they are derived from basic price and volume data. Instead of searching for elusive patterns or magical chart overlays, devote your time to mastering the fundamental principles discussed earlier.
This disciplined and pragmatic approach is more likely to yield tangible results in your trading journey.
By following the Pyramid of Trading Success, traders can develop a comprehensive and methodical approach to trading, increasing their chances of achieving sustainable success in the dynamic and challenging world of financial markets.
We would greatly appreciate your valuable feedback on our article about the Trading Pyramid. Your opinion matters to us, and your insights can help us improve our content and tailor it to better meet your needs.

Short opportunity in Nasdaq QQQYou can see the top and bottoms curves, top curve is peaking and bottom curve is flattening. Risk is low to the upside with daily stop losses following the curve. Conservative 3.5% to the downside in next 15 days. We also see double divergences in top and bottom trends on the Relative Trend Index, RTI could give third peak in next 8 days to confirm.
Below 363 we have an acceleration to the downside of 5-7% additional, for a total downside of 7-10% in next 3-4 weeks.
I have a short position in QQQ currently.

Unveiling the Secrets: The Road to Forex SuccessMy todays topic is Unveiling the Secrets: The Road to Forex Success - Proven Strategies to Safeguard Capital and Skyrocket Profits! .
In the realm of foreign exchange trading, novice traders often encounter challenges as they embark upon their journey in the forex market, resulting in unfortunate losses of their capital. Regrettably, due to my current absence of a Trading view subscription plan, I am unable to provide illustrative visual aids to enhance the efficacy of this discourse. Nonetheless, I intend for this post to serve as an educational resource, infused with a technical perspective, wherein I delve into an analysis of the GBPUSD chart.
Introduction
Foreign exchange (forex) trading is an enticing financial market that offers vast opportunities for individuals to make profits. However, for beginner traders, the journey can be challenging, as they often encounter numerous obstacles and experience losses. Understanding the reasons behind these losses is crucial for aspiring traders to develop effective strategies that minimize risk and increase the probability of success. In this article, we will explore the primary factors contributing to why beginner traders often lose money in forex and present key strategies to mitigate those risks.
Lack of Proper Education and Knowledge
One of the fundamental reasons why beginner traders struggle and lose money in forex is a lack of proper education and knowledge. Forex trading is not a game of luck or intuition; it requires a deep understanding of fundamental and technical analysis, market dynamics, and risk management. Unfortunately, many beginners dive into the market without a solid foundation, making them vulnerable to costly mistakes and falling victim to misleading trading signals or unreliable strategies.
Strategy: Prioritize Education and Continuous Learning
To minimize the risk associated with inadequate knowledge, beginner traders should invest time and effort in acquiring a comprehensive education on forex trading. It is essential to understand key concepts such as fundamental and technical analysis, risk management, and trading psychology. Engaging in online courses, reading educational materials, and utilizing demo trading accounts can provide invaluable hands-on experience. By continually expanding their knowledge and staying updated with market news, beginners can make more informed trading decisions and reduce the likelihood of losses.
(a) Lack of Discipline and Emotional Control
Emotions play a significant role in forex trading, and for beginners, learning to manage emotions can be particularly challenging. Greed, fear, and impatience often lead to impulsive trading actions, such as chasing profits, failing to cut losses, or overtrading. These emotional responses tend to cloud beginners' judgment and hinder their ability to make rational decisions based on market analysis.
Strategy: Develop and Stick to a Trading Plan
Developing a well-defined trading plan is crucial for beginner traders to minimize emotional interference. A trading plan outlines specific entry and exit points, risk tolerance, and profit targets based on a thorough analysis of market conditions. By strictly adhering to a pre-established plan, beginners can reduce impulsive actions driven by emotions, thus minimizing risk and enhancing overall consistency. Additionally, maintaining a trading journal to track and evaluate performance can help identify areas for improvement and promote discipline.
(a) Inadequate Risk Management
Effective risk management is essential for all traders, especially beginners. Without proper risk management techniques, beginners expose themselves to substantial losses. Not setting appropriate stop-loss orders, risking too much capital on a single trade, or failing to diversify the portfolio are common mistakes that contribute to beginners' financial setbacks.
Strategy: Implement Strong Risk Management Tools
To mitigate risk, beginners should employ various risk management tools. Setting stop-loss orders at logical levels is crucial to limit potential losses. Beginners should also determine a suitable risk-to-reward ratio for each trade and avoid risking more than a predetermined percentage of their capital. Diversifying the portfolio by trading multiple currency pairs can also help distribute risk. Regularly reviewing and adjusting risk management parameters, such as trailing stops, can further protect capital and minimize losses.
(a) Lack of Realistic Expectations
Beginner traders often fall into the trap of unrealistic expectations, anticipating quick and substantial profits. However, forex trading is a complex market, and consistent profitability takes time and experience. Unrealistic expectations can lead beginners to take excessive risks, overtrade, or give in to the allure of get-rich-quick schemes, ultimately resulting in financial losses.
Strategy: Set Realistic Goals and Focus on Long-Term Success
Setting realistic goals is crucial for beginner traders. Instead of aiming for overnight wealth, beginners should focus on building a solid foundation and gaining experience over time. Patience, persistence, and a long-term mindset are essential for navigating the forex market successfully. By setting achievable goals and embracing a gradual learning curve, beginners can reduce the pressure to make hasty and uninformed trading decisions.
Conclusion
For beginner traders, the forex market can be a challenging environment where losses are common. However, by understanding the reasons behind these losses and implementing effective strategies, beginners can minimize risks and increase their chances of success. Prioritizing education, maintaining discipline, implementing proper risk management techniques, and setting realistic goals are all essential components for beginner traders to navigate the forex market with confidence. Remember, forex trading is a journey that requires continuous learning and adaptation. With the right approach and mindset, beginners can overcome obstacles and strive for consistent profitability in forex trading.

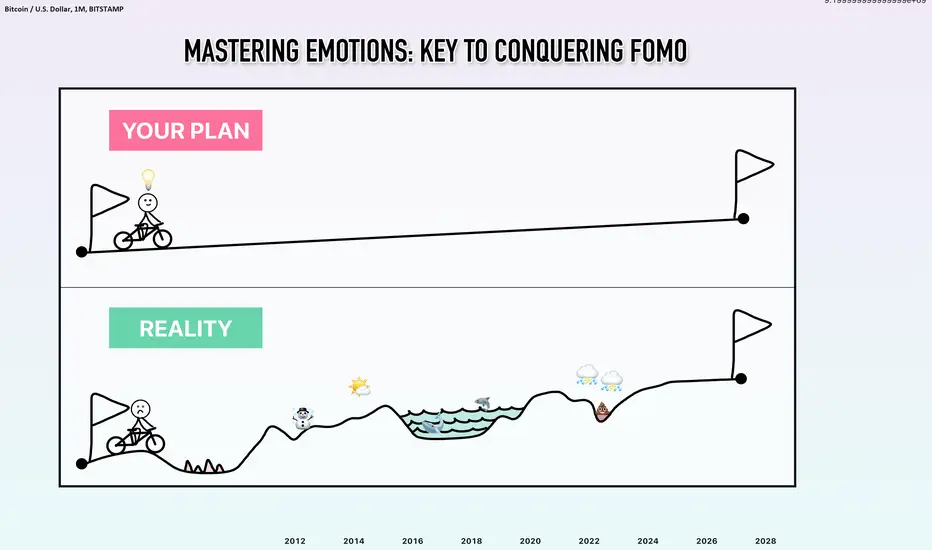
Psychology and Trading: Conquering FOMO
🔥 Do you ever feel the Fear of Missing Out (FOMO) when trading?
🔥
It's a common struggle, but fear not! In this post, I'll share five crucial points that have been instrumental in helping me gain control over my psychology throughout my trading journey.
😎 Embrace the Unpredictability:
The market is a wild ride, and it can change direction in the blink of an eye. Even the best setups can turn into losses within seconds. So, keep a neutral mindset! Recognize that prices can move in any direction, and be ready to adjust your bias as market structures develop. By staying neutral, you can reduce your emotions and build a strong trading psychology.
💪 Master Risk Management:
Risk management is the holy grail of trading. Without it, you're just gambling. Losses are inevitable, but by limiting your risk to a small percentage (e.g., 1%), you can protect your capital and keep trading. Consistently managing risk and maximizing your reward-to-risk ratio will compound your profits and overshadow any losses.
⏳ Patience Pays Off:
Don't chase after every trade. If you miss an entry, don't panic! There will always be new opportunities that fit your trading plan. Impulsively chasing volatility leads to revenge trading, greed, and unnecessary losses. Stay disciplined and wait for confirmation before jumping into a trade.
🚫 Leave Your Ego Behind:
Your ego has no place in trading. Just because you think the price will hit your target doesn't mean it will. Profitability comes from taking what the market offers. Be humble and flexible, adjusting your trades according to the market's behavior. This mindset shift will help you avoid costly mistakes.
📝 Craft a Solid Trading Plan:
Want to succeed? Have a well-defined trading plan! It's your compass in the chaotic market. Identify profit targets, stop levels, and entry/exit points. Stick to your plan with unwavering discipline. Consistency and emotional control are key to achieving your trading goals.
📈 Remember, there's no one-size-fits-all approach in trading. Each trader has their own style, plan, and mindset. As long as you follow your plan and your decisions align with your criteria, you're on the right track.
At @Vestinda we hope you found these tips helpful! Trading is a journey of self-improvement and constant learning. By applying these principles, you'll gain better control over your psychology and increase your chances of success.
Keep exploring, stay curious, and never stop honing your trading skills! 🤗