CCI Made Easy:Comprehensive Guide on the Commodity Channel IndexHello TradingView Community, it’s Ben with LeafAlgo! Today we will explore a popular indicator with commodity traders - the Commodity Channel Index (CCI). The CCI is a powerful tool that has earned its place among traders due to its ability to identify potential trend reversals, overbought or oversold conditions, and price extremes. In this comprehensive guide, we will delve into the origins of the Commodity Channel Index, explain its components, outline its applications in commodity trading, and provide real-life examples. By the end of this article, you will have a solid understanding of how to leverage the CCI effectively in your trading endeavors. Let's dive in!
Origin of the Commodity Channel Index (CCI)
Developed by Donald Lambert in 1980s, the Commodity Channel Index was initially designed to analyze commodities. However, over time, its application expanded to various financial markets. The CCI is a momentum oscillator, that measures the relationship between an asset's price and its statistical average. The indicator's ability to detect market conditions beyond standard price trends has made it popular among traders of all levels.
Components of the Commodity Channel Index
The Commodity Channel Index consists of four main components:
Typical Price: The Typical Price is calculated as the average of the high, low, and closing prices of the asset over a specified period.
Simple Moving Average (SMA): The SMA is a moving average of the Typical Price over the chosen number of periods. The most common period used is 20.
Mean Deviation: The Mean Deviation measures the average deviation of the Typical Price from the SMA over the selected period.
Commodity Channel Index (CCI): Finally, the CCI itself is calculated using the formula:
CCI = (Typical Price - SMA) / (0.015 * Mean Deviation).
The standard period for the Commodity Channel Index is 20, but traders can adjust this parameter to suit their trading preferences and timeframes.
Interpreting the Commodity Channel Index
The Commodity Channel Index fluctuates around a zero line, which acts as a reference point for identifying overbought and oversold conditions. Positive CCI values indicate that the asset's price is above the average, signaling potential overbought conditions. Conversely, negative CCI values suggest that the price is below the average, indicating potentially oversold conditions.
Applications of the Commodity Channel Index in Commodity Trading
1. Identifying Overbought and Oversold Conditions
The Commodity Channel Index excels in spotting overbought and oversold conditions, making it valuable for commodity traders. When the CCI climbs above +100, it indicates overbought territory, suggesting that the asset's price may be due for a pullback or reversal. On the other hand, a CCI reading below -100 suggests oversold conditions, hinting at a potential bounce or reversal in the upward direction.
2. Divergence and Trend Reversals
Divergence occurs when the price of the asset moves in the opposite direction of the CCI. Bullish divergence is when the price forms lower lows while the CCI makes higher lows. This can indicate a potential trend reversal to the upside. Conversely, a bearish divergence occurs when the price forms higher highs while the CCI makes lower highs, signaling a possible trend reversal to the downside. Divergence can provide early signals of trend changes and potential entry points for traders.
Bearish Example:
Bullish example:
3. Commodity Channel Index as a Trend-Following Tool
The Commodity Channel Index can also be employed as a trend-following indicator. Traders can look for long opportunities when the CCI crosses above zero and short opportunities when the CCI crosses below zero. However, to avoid false signals, it is advisable to combine the CCI with other technical indicators or trend confirmation tools.
4. CCI and Price Extremes
The Commodity Channel Index can highlight price extremes by measuring how far the asset's price deviates from its average. A high positive CCI value indicates an exceptionally strong uptrend, while a low negative CCI value indicates a substantial downtrend. Traders can use these extreme readings to assess the strength of the prevailing trend and potential exhaustion points.
Utilizing the CCI with Other Indicators
Combining the Commodity Channel Index with other indicators can enhance its effectiveness and provide traders with more robust trading signals. By using complementary indicators, traders can confirm CCI signals and gain deeper insights into market conditions. Here are a few indicators that work well with the CCI:
1. Moving Averages (MA): Moving averages can be powerful tools when used alongside the CCI. By adding a simple moving average to the price chart, traders can identify the overall trend direction. When the CCI provides a signal, such as overbought or oversold conditions, traders can cross-reference it with the moving average to confirm the prevailing trend. For instance, in an uptrend, traders may focus on CCI readings below -100 as potential entry points for long positions when the price is above the moving average.
2. Relative Strength Index (RSI): The RSI is another popular momentum oscillator that can complement the CCI. When used together, these indicators can provide stronger signals and reduce the risk of false positives. If both the CCI and RSI signal overbought or oversold conditions while simultaneously diverging, it can increase confidence in a potential market reversal.
3. Moving Average Convergence Divergence (MACD): The MACD is a trend-following indicator that also incorporates momentum analysis. When combined with the CCI, traders can get a more comprehensive view of trend strength and potential trend changes. For example, if the CCI shows overbought conditions, traders may wait for the MACD to generate a bearish signal before considering a long trade.
4. Bollinger Bands: Bollinger Bands are volatility-based bands that expand and contract around a simple moving average. When the CCI reaches extreme values outside the Bollinger Bands, it can signal potential price reversals. Traders may look for price action confirming these signals, such as candlestick patterns or divergences, before making a trading decision.
Conclusion
Incorporating the Commodity Channel Index (CCI) with other indicators can significantly enhance its effectiveness in trading. By cross-referencing CCI signals with confirmation from other indicators, traders can improve the accuracy of their trading decisions. However, it is crucial to avoid overcrowding the chart with too many indicators, as this can lead to analysis paralysis. Instead, focus on a select few indicators that complement the CCI and align with your trading strategy. Remember, continuous learning and practice are key to mastering the art of using technical indicators effectively in your commodity trading journey. Happy trading! :)
Educationalpost

Guard Your Funds: Only risk what you can afford to lose.🎉 Risk Management tip for Vesties and @TradingView community! 🚀
😲 We all know the saying "only risk what you can afford to lose," but do you know the powerful impact it can have on your trading journey? 🤔
In the ever-evolving world of cryptocurrency and futures trading, one fundamental principle stands as the cornerstone of profitable and sustainable trading journeys: Only risk what you can afford to lose. Embracing this essential concept is crucial for preserving capital, maintaining emotional stability, and cultivating a disciplined approach to risk management. In this article, we will delve into the significance of operating money and risk within the confines of one's financial capacity and explore the key pillars that underpin this approach.
Understanding Risk Tolerance and Capital Allocation:
1. Assessing Individual Risk Tolerance:
To truly understand one's risk tolerance and establish a robust risk management strategy, traders are encouraged to engage in a thought exercise that involves imagining potential losses in tangible terms. Visualize throwing money into the bin or burning it completely, purely to experience the feeling of losing money. This exercise may seem unconventional, but it serves a crucial purpose: it helps traders gauge their emotional response to monetary losses.
During this exercise, consider the two extreme scenarios: the first being the largest amount of money you can lose without causing significant distress, and the second being the maximum amount of loss that would completely devastate you financially and emotionally. These two amounts represent your Fine Risk and Critical Risk , which reflects the sum you are willing and able to lose over a specific period of time without compromising your financial well-being.
👉 The next step involves breaking down the Fine Risk into smaller, manageable parts. 🔑 Divide the Fine Risk into 10 or even 20 equal parts, each representing the risk amount for every individual trade. This approach is designed to create a safety net for traders, especially when they encounter unfavorable market conditions.
For instance, imagine a scenario where you face five consecutive losing trades. With each trade representing only a fraction of your Fine Risk, the cumulative loss remains relatively small compared to your risk capability, providing emotional resilience and the ability to continue trading with confidence.
By splitting the Fine Risk into smaller portions, we can safeguard their capital and ensure that a string of losses does not result in irreversible damage to our trading accounts or emotional well-being. Additionally, this approach promotes a disciplined and structured trading mindset, encouraging us to adhere to their predefined risk management rules and avoid impulsive decisions based on emotions.
Remember, risk management is not solely about avoiding losses but also about preserving the means to participate in the market over the long term.
2. Establishing a Risk-to-Reward Ratio:
The risk-to-reward ratio is a critical metric that every trader must comprehend to develop a successful trading system. It is a representation of the potential risk taken in a trade relative to the potential reward. For a well-balanced and sustainable approach to trading, it is essential to ensure that the risk-to-reward ratio is greater than 1:1.10.
A risk-to-reward ratio of 1:1.10 implies that for every unit of risk taken, the trader expects a potential reward of 1.10 units. This ratio serves as a safety measure, ensuring that over time, the profits generated from winning trades will outweigh the losses incurred from losing trades. While there is a popular notion that the risk-to-reward ratio should ideally be 1:3, what truly matters is that the ratio remains above the 1:1.10 mark.
Maintaining a risk-to-reward ratio of at least 1:1.10 is beneficial for several reasons. Firstly, it allows traders to cover their losses in the long term. Even with a series of losing trades, the accumulated profits from winning trades will offset the losses, allowing traders to continue trading without significant setbacks.
Secondly, a risk-to-reward ratio higher than 1:1.10, combined with proper risk management and a well-executed trading system, enables traders to accumulate profits over time. Consistently achieving a slightly better reward than the risk taken can lead to substantial gains in the long run.
3. Determining Appropriate Position Sizes:
Once you have a clear understanding of your risk amount and risk-to-reward ratio, you can proceed to calculate appropriate position sizes for each trade. To do this, you can use a simple formula:
Position Size = (Risk Amount per Trade / Stop Loss) * 100%
Let's take an example to illustrate this calculation:
Example:
Risk Amount per Trade: $100
Risk-to-Reward Ratio: 1:2
Stop Loss: -4.12%
Take Profit: +8.26%
Using the formula:
Position Size = ($100 / -4.12%) * 100%
Position Size ≈ $2427.18
In this example, your calculated position size is approximately $2427.18. This means that for this particular trade, you would allocate a position size of approximately $2427.18 to ensure that your risk exposure remains at $100.
After executing the trade, let's say the trade turned out to be profitable, and you achieved a profit of $200. This outcome is a result of adhering to a well-calculated position size that aligns with your risk management strategy.
By determining appropriate position sizes based on your risk tolerance and risk-to-reward ratio, you can effectively control your exposure to the market. This approach helps you maintain consistency in risk management and enhances your ability to manage potential losses while allowing your profits to compound over time.
Emotions and Psychology in Risk Management:
A. The Impact of Emotions on Trading Decisions:
Emotions can significantly influence trading decisions, often leading to suboptimal outcomes. Traders must recognize the impact of emotions such as fear, greed, and excitement on their decision-making processes. Emotional biases can cloud judgment and result in impulsive actions, which can be detrimental to overall trading performance.
B. Recognizing and Managing Fear and Greed:
Fear and greed are two dominant emotions that can disrupt a trader's ability to make rational choices. By developing self-awareness and recognizing emotional triggers, traders can gain better control over their reactions. Implementing techniques to manage fear and greed, such as setting predefined entry and exit points, can help traders navigate turbulent market conditions.
C. Developing a Disciplined Trading Mindset:
A disciplined trading mindset is the bedrock of successful risk management. This involves adhering to a well-defined trading plan that outlines risk management rules and strategies. By staying committed to the plan and maintaining a long-term perspective, traders can resist impulsive actions and maintain discipline during times of market volatility.
D. Techniques for Avoiding Impulsive and Emotional Trading:
To avoid impulsive and emotional trading, traders can employ various techniques. Implementing cooling-off periods before making trade decisions allows traders to gain clarity before acting. Seeking support from trading communities or mentors provides valuable insights and helps traders stay grounded. Utilizing automated trading systems can reduce emotional interference and ensure trades are executed based on predefined criteria.
In the world of cryptocurrency and futures trading, the fundamental principle of "only risk what you can afford to lose" remains the cornerstone of successful trading. Embracing this concept is essential for preserving capital, maintaining emotional stability, and cultivating a disciplined approach to risk management.
Understanding individual risk tolerance and breaking down total risk into smaller portions allows traders to navigate unfavorable market conditions with resilience. Maintaining a risk-to-reward ratio above 1:1.10 ensures that profits outweigh losses over time, while determining appropriate position sizes enables effective risk control.
Emotions play a significant role in trading decisions, and managing fear and greed empowers traders to make rational choices. Employing techniques to avoid impulsive trading, like cooling-off periods and seeking support, reinforces a disciplined trading mindset.
In conclusion, adhering to the principle of only risking what you can afford to lose leads to sustainable success in the dynamic trading world. By implementing effective risk management practices, traders enhance their chances of achieving profitability and longevity in their trading journeys.
📝👋 Feedback is super important to us! 😊
We would absolutely love to hear your thoughts and comments about the article. 🧐
Did you find the information helpful and well-explained? 🤔
Your feedback means a lot to us and will help us improve our content to provide better insights in the future. 😇
Thank you so much for taking the time to share your thoughts! 🙏 We're excited to hear from you! 💬

Meet All Triangles — Quick and Easy Guide.📊✨ Discovering All Triangle Chart Patterns 📈✨
Welcome, traders and investors, to the exciting world of Triangle patterns! Today, we'll explore all known triangle shapes: Symmetrical, Ascending, Descending and Broadening Triangles.
Triangle chart patterns provide valuable insights into market dynamics, representing a battle between buyers and sellers within a narrowing price range. These patterns are often categorized as continuation or neutral patterns indicating that the price is likely to continue its existing trend after the pattern completes.
Symmetrical Triangle:
A symmetrical triangle occurs when the slope of the price's highs and lows converge, forming a triangular shape. This pattern signifies a period of consolidation, with lower highs and higher lows indicating a balance between buyers and sellers. As the slopes converge, a breakout becomes imminent, although the direction of the breakout is uncertain.
To take advantage of a symmetrical triangle, we can place entry orders above the slope of the lower highs and below the slope of the higher lows, prepared to ride the price in the direction of the breakout.
Ascending Triangle:
An ascending triangle features a resistance level and a slope of higher lows. Buyers gradually push the price up, testing the resistance level. This pattern often signals a breakout to the upside, as buyers gain strength and attempt to break through the resistance.
To trade an ascending triangle, we can set entry orders above the resistance line and below the slope of the higher lows, ready for a potential upward breakout. However, it's important to remain open to movement in either direction, as sometimes the resistance level may prove too strong.
Descending Triangle:
In contrast to the ascending triangle, a descending triangle consists of lower highs forming the upper line, with a strong support level acting as the lower line. Sellers gain ground against buyers, and in most cases, the support line eventually breaks, leading to a continued downward move.
To trade a descending triangle, we can set entry orders above the upper line (lower highs) and below the support line, prepared for a potential breakout. However, it's important to note that in some instances, the support line may hold, resulting in a strong upward move.
Broadening Triangle:
Now, let's dive into the intriguing Broadening Triangle, also known as a Megaphone Pattern. This pattern stands out due to its expanding price range, creating a unique visual pattern on the chart.
The Megaphone Pattern consists of a series of higher highs and lower lows, causing the price range to widen over time. This pattern reflects increasing volatility and uncertainty in the market, with both buyers and sellers actively participating.
Trading Triangles requires careful analysis and risk management due to its nature and potential for unpredictable price moves.
To approach Triangle patterns effectively:
1️⃣ Pay attention to the pattern's boundaries: Identify the upper trendline connecting the highs and the lower trendline connecting the lows. These trendlines define the range of price movement within the pattern.
2️⃣ Watch for breakouts and reversals: Triangles often precedes significant price movements. We can look for breakouts above the upper trendline or breakdowns below the lower trendline as potential trading opportunities.
3️⃣ Confirm with additional indicators: Combine your analysis with other technical indicators or tools to validate your trading decisions. Consider using indicators like moving averages, oscillators, or volume analysis to confirm the pattern's potential direction.
Remember, trading the Triangles requires careful analysis and risk management. It's important to consider the overall market context, fundamental factors, and other technical signals to make informed trading decisions.
While chart patterns provide valuable insights, they cannot guarantee future price movements. Always conduct thorough research, stay updated with market news, and adapt your strategy as market conditions evolve.
Wishing you successful trading journeys guided by these fascinating patterns! 🚀📈✨

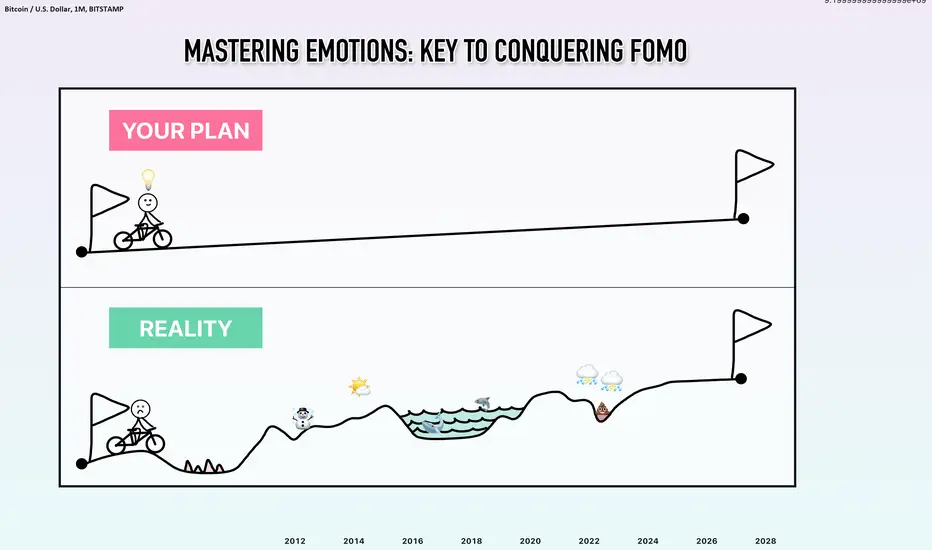
Psychology and Trading: Conquering FOMO
🔥 Do you ever feel the Fear of Missing Out (FOMO) when trading?
🔥
It's a common struggle, but fear not! In this post, I'll share five crucial points that have been instrumental in helping me gain control over my psychology throughout my trading journey.
😎 Embrace the Unpredictability:
The market is a wild ride, and it can change direction in the blink of an eye. Even the best setups can turn into losses within seconds. So, keep a neutral mindset! Recognize that prices can move in any direction, and be ready to adjust your bias as market structures develop. By staying neutral, you can reduce your emotions and build a strong trading psychology.
💪 Master Risk Management:
Risk management is the holy grail of trading. Without it, you're just gambling. Losses are inevitable, but by limiting your risk to a small percentage (e.g., 1%), you can protect your capital and keep trading. Consistently managing risk and maximizing your reward-to-risk ratio will compound your profits and overshadow any losses.
⏳ Patience Pays Off:
Don't chase after every trade. If you miss an entry, don't panic! There will always be new opportunities that fit your trading plan. Impulsively chasing volatility leads to revenge trading, greed, and unnecessary losses. Stay disciplined and wait for confirmation before jumping into a trade.
🚫 Leave Your Ego Behind:
Your ego has no place in trading. Just because you think the price will hit your target doesn't mean it will. Profitability comes from taking what the market offers. Be humble and flexible, adjusting your trades according to the market's behavior. This mindset shift will help you avoid costly mistakes.
📝 Craft a Solid Trading Plan:
Want to succeed? Have a well-defined trading plan! It's your compass in the chaotic market. Identify profit targets, stop levels, and entry/exit points. Stick to your plan with unwavering discipline. Consistency and emotional control are key to achieving your trading goals.
📈 Remember, there's no one-size-fits-all approach in trading. Each trader has their own style, plan, and mindset. As long as you follow your plan and your decisions align with your criteria, you're on the right track.
At @Vestinda we hope you found these tips helpful! Trading is a journey of self-improvement and constant learning. By applying these principles, you'll gain better control over your psychology and increase your chances of success.
Keep exploring, stay curious, and never stop honing your trading skills! 🤗
5 Trades this week & +2.40% 😆 / Part 1In this Weekly Review I breakdown my thought process for my first 4 trades of the week. The video was cut short due to a 20 Minutes max length for tradingview. I just learned about this since I am new to video analyses on tradingview. I will be uploading the Part 2 for my final (5th) trade of the week at some point this weekend.
If you enjoyed the video, please leave a rocket or a comment 😁
I will be making more video analysis for the channel as I have been enjoying them myself. Anyways have a nice weekend.

Informational: Using TradingView ideas to gauge market sentimentTradingView, being one of the leading charting platforms, boasts a vast and active community of more than 50 million users. One noteworthy feature that many users may be unaware of is the ability to display ideas shared by other users directly on their charts, without the need to navigate to the separate Ideas tab. This feature enhances convenience and streamlines the chart analysis process.
By enabling this feature in the settings, users can choose to display only their own ideas or opt to view all ideas shared by the TradingView community. This functionality provides a seamless integration of community insights and analysis directly within the charting interface, facilitating easier access to diverse perspectives and trading concepts shared by fellow users.
Once this feature is enabled, it provides an additional visual element to the chart by assigning colors to indicate the bias of each individual sharing ideas on a particular symbol. This color-coded information can be valuable in helping you determine your own bias for that specific symbol. By observing the color associated with each user's ideas, you can quickly assess whether the majority of users have a bullish (teal) or bearish (red) bias for that symbol. This can serve as a helpful reference point when forming your own analysis and making trading decisions. Having access to the collective sentiment of the TradingView community through color indicators adds an extra layer of information that can contribute to your overall market perception.
🔶 How to enable:
Go to settings > Events > Ideas on chart > All Ideas
After enabling this feature, you will begin to see ideas posted by other users directly on the symbol you are currently viewing. It is important to note that these ideas are specific to the timeframe you are analyzing and the ticker feed you have selected. To maximize the benefit of this feature, it is recommended to visit a popular exchange where ideas are frequently shared by the TradingView community. Additionally, switching to the daily timeframe can provide a broader range of ideas for your analysis. This timeframe often attracts more user-generated ideas, offering a wealth of insights and perspectives to consider. By combining these two suggestions—exploring popular exchanges and utilizing the daily timeframe—you can leverage the full potential of this feature and gain access to a wide range of valuable ideas from other users within the TradingView community.
In addition to the previously mentioned tips, it can be beneficial to hide the chart symbol and adjust the scale of the chart for optimal viewing. By hiding the chart symbol, you can remove any distractions and focus solely on the chart itself, allowing for a clearer analysis of the price action and indicator data.
🔶 How to use this data
The aggregation of ideas in this manner provides you with a valuable tool to gauge the sentiment for each specific day. The color-coded system further enhances the clarity of this sentiment analysis. A red color indicates a bearish idea, while teal/blue represents a bullish idea. An orange color indicates a neutral stance from the trader.
By observing the distribution of colors on a given day for a particular symbol, you can gain a clear indication of what users within the TradingView community are thinking about that symbol. For example, if there are six bullish ideas and two bearish ideas, it suggests a strong bullish sentiment among users. Conversely, if there are six bearish ideas and two bullish ideas, it indicates a prevalent bearish sentiment. This aggregated sentiment can serve as an additional factor to consider when forming your own analysis and making trading decisions. It provides insights into the collective view of other traders and helps you understand the prevailing sentiment for a particular symbol on a given day.
And here is how this played out on the candle stick chart

EDUCATION: How to trade forex?Trading foreign currency on the forex market, also known as foreign exchange trading, can be an exciting hobby and a lucrative source of income for many people. Currently, the stock market trades about $22.4 billion per day, while the forex market trades around $5 trillion per day. There are various ways you can engage in online forex trading.
1. Learn basic forex terms.
- The currency you are using, or selling, is the base currency. The currency that you are buying is called the quote currency. In forex trading, you will sell one currency to buy another.
- The exchange rate tells you how much you have to spend in the quote currency to buy one unit of the base currency.
- A long position means you want to buy the base currency and sell the quote currency. In our example above, you want to sell dollars to buy pounds.
- A short position means you want to buy the quote currency and sell the base currency. In other words, you sell British pounds and buy US dollars.
- The bid price is the price the broker is willing to buy the base currency for in exchange for the quote currency. The bid price is the best price at which you want to sell your quote currency in the market.
- The ask price, or ask price, is the price at which the broker sells the base currency in exchange for the quote currency. The asking price is the best you are willing to buy from the market.
Spread is the difference between the bid price and the ask price.
2. Specify the currency you want to buy and sell in.
- Forecasting the economy. For example, if you believe the US economy will continue to weaken, and this is not good for the US dollar, you may therefore want to sell dollars in exchange for currency from a country with a strong economy. .
- View a country's trading position. If a country has a lot of popular goods, it may export goods to make a profit. This trade advantage will boost economic development, thereby helping to boost the value of this country's currency.
- Political review. If a country is holding an election, its currency will appreciate if the winner of the election has a fiscally biased agenda. In addition, if a country's government loosens regulations on economic growth, this will push up the value of the currency.
- Read economic reports. A report on GDP, or on other economic factors such as employment and inflation, of a country will have an effect on the value of that country's currency.
3. Learn how to calculate profit.
- Use the unit "pip" to measure the change in value between two currencies. Usually, one pip equals 0.0001 change in value. For example, if the EUR/USD rate increased from 1.546 to 1.547, then the value of your currency has increased by 10 pips.
- Multiply the number of pips your account changes by the exchange rate to find out how much your account value has increased or decreased.
4. Market analysis. You can try several different methods such as:
- Technical Analysis: Technical analysis is looking at charts or previous data to predict the direction of currency movement based on past events. The broker will usually provide you with a chart, or else you can use a popular platform like Metatrader 4.
- Fundamental Analysis: This analysis involves looking at the economic background and character of the country and based on this information to make trading decisions.
- Psychoanalysis: This type of analysis is largely subjective. You're basically trying to analyze market sentiment to figure out if the market is trending "bearish" or "bullish." While market sentiment cannot always be certain, you can still make some guesses, and this will positively impact your trading.
5.Define margin trading. Depending on the broker's policies, you can invest little money and still make big trades.
- For example, if you want to trade 100,000 units with a margin of 1%, the broker will ask you to put $1,000 in cash in your account for safety.
- Both profit and loss will be added or deducted from the account. For this reason, the best general rule is to only invest 2% of your cash in a particular currency pair.
6. Advise.
- Try to use only about 2% of your total cash. For example, if you decide to invest $1,000, try using only $20 to invest in a currency pair. Prices in Forex are very volatile, and you have to make sure you have enough money to spend when the currency pair price drops.
- Try using a demo account to make forex trades before investing real capital. That way you can be sure of the process and definitely should you join forex trading. After you always make the right trading decisions with a demo account, you can start doing it with a real forex account.
- Limit losses. Let's say you have invested 20 USD in EUR/USD currency pair, and today you have lost 5 USD. But you haven't lost your money yet. It is important that you only use about 2% of your cash back per trade, plus a stop loss with that 2%. You still have enough capital to cover this period so you can keep the position from closing and make a profit.
- Remember a loss is not a loss unless your position is closed. If your position is still open, your loss will only be calculated if you choose to close the position and take the loss.
- If the currency pair moves against your will, and you do not have enough funds to cover it during this time, your order will be automatically cancelled. Therefore, you must make sure not to make this mistake.
7. Warning.
- More than 90% of day traders fail. If you want to learn the common pitfalls that cause you to make bad trading decisions, consult a trusted fund manager.
- Check to make sure that the brokerage firm has a specific address. If the broker does not provide an address then you better find someone else to avoid being scammed.

Ichimoku Cloud Demystified: A Comprehensive Deep DiveHello TradingView Community, it’s Ben with LeafAlgo! Today we will discuss one of my favorite indicators, the Ichimoku Cloud. The Ichimoku is a versatile trading tool that has captivated traders with its unique visual representation and powerful insights. We will dive deep into understanding the Ichimoku Cloud, explore its history, discuss its parts, highlight real-life examples, and address potential pitfalls. By the end of this article, we believe you will know how to leverage the Ichimoku Cloud effectively in your trading endeavors. Let’s dive in!
Origin of The Ichimoku Cloud
The Ichimoku Cloud, also known as Ichimoku Kinko Hyo, was developed by Goichi Hosoda in the late 1930s but was not published until later in the 1960s. Its name translates to "one glance equilibrium chart," reflecting its ability to provide a holistic view of market dynamics with a single glance. Over time the Ichimoku Cloud has become a popular trading tool among new and seasoned traders.
Components of The Ichimoku Cloud
Some traders believe the Ichimoku cloud is a complex jumble of lines with no rhyme or reason, but this is not necessarily true. The best way to understand the Ichimoku cloud is to break it down into its respective parts. Each element contributes to the overall interpretation of price action, trend direction, support and resistance levels, and potential entry and exit points.
The Ichimoku Cloud has five components: Tenkan-sen, Kijun-sen, Senkou Span A and B, and Chikou Span.
The Tenkan-sen and Kijun-sen, often called the Conversion Line and Base Line, respectively, are essential in identifying trend direction and momentum. Below we can see a bullish signal happens when the Tenkan-sen crosses above the Kijun-sen. Conversely, a bearish signal occurs when the Tenkan-sen crosses below the Kijun-sen. Typical length inputs for the Tenkan-sen and Kijun-sen are 9 and 26.
The Senkou Span A and B form the cloud or "Kumo." These components serve as dynamic support and resistance levels, with Senkou Span A calculated as the average of the Conversion Line and Base Line and Senkou Span B representing the midpoint of the highest high and lowest low over a specified period, typically 52. The cloud's thickness and color provide visual cues for potential market strength and volatility.
The Chikou Span, or the Lagging Span, is the current closing price plotted 26 periods back on the chart. It helps traders gauge the relationship between the current price and historical price action, providing insights into potential trend reversals or continuation.
Putting the parts together gives us a complete picture of the Ichimoku Cloud. Each aspect contributes to the one-glance equilibrium theory, giving traders a more holistic view of price action.
Applying the Ichimoku Cloud in Trading
We now better understand all parts of the Ichimoku cloud, but that means little if we don’t understand how it can be utilized in trading. Let's explore examples that demonstrate the practical application of the Ichimoku Cloud:
Example 1: Trend Following
In an uptrend, we would look for the Tenkan-sen to cross above the Kijun-sen while the price remains above the cloud. When the price retraces to the cloud, a long position opportunity may arise, with the cloud acting as support. The Chikou Span should also be above the historical price action, confirming the bullish sentiment.
Example 2: Trend Reversals and Breakout Opportunities
A potential trend reversal or continuation can be identified when the Tenkan-sen crosses above the Kijun-sen and the price moves above the cloud. A breakout trade can initiate when the price breaks through the cloud's upper boundary, indicating a shift in momentum. For the Ichimoku cloud to give its strongest confirmation of a reversal, some traders will take a fairly conservative approach and wait for a few things to occur. Traders typically wait for a kumo twist, the Tenkan-sen/Kijun-sen cross, and the Chikou Span to break the cloud and be above the price.
The reverse of these signals can be used in the same fashion for a short position.
Example 3: The Kumo Twist
In a trend, a Kumo Twist can signal a potential trend reversal. Look for the Senkou Span A to cross above or below the Senkou Span B within the cloud. This twist can confirm a shift in market sentiment. Traders can enter a position when the twist is confirmed, placing a stop loss above or below the cloud or the recent swing high/low. I think of the Kumo twists and subsequent clouds as a trend filter. Placing longs on the bullish side or shorts on the bearish side, however, some traders use the Ichimoku Cloud in a contrarian fashion. Contrarian trades can be profitable using this method as price tends to pull back to the clouds A or B span where support or resistance may lie.
Pitfalls and Challenges: Avoiding Common Mistakes
While the Ichimoku Cloud is a powerful tool, it is paramount to be aware of potential pitfalls. Here are a few challenges to navigate:
False Signals and Choppy Market Conditions
In ranging or volatile markets, cloud signals may generate false indications. During such periods combine the Ichimoku Cloud with other technical indicators or wait until the market picks a direction.
Moving out to higher time frames can help clear the murkiness of consolidation phases and provide a clearer picture of the trend, in turn, weeding out false signals.
Overcomplicating Analysis
The Ichimoku Cloud provides a wealth of information, but it's crucial to maintain simplicity and focus. Avoid overcrowding the chart with an abundance of indicators, especially other overlays. It is easy to get lost in the sauce or run into redundancies with too much on the chart.
Testing and Adapting
Each market has its characteristics or volatility, and it's essential to backtest the Ichimoku Cloud strategy, experiment with different parameters, and adapt to market conditions over time. Many traders rely on the standard settings, but in my time developing trading algorithms, I have learned that those settings do not hold from market to market or consistently over time. It is critical to regularly revisit your settings or overall trading strategy to make sure you are drawing on the best available information the Ichimoku Cloud can give.
Enhancing the Ichimoku Cloud Strategy
To enhance your understanding and utilization of the Ichimoku Cloud, consider the following:
Incorporating Other Technical Indicators
Combining the Ichimoku Cloud with other indicators, such as oscillators, to confirm signals can be beneficial. I know I said not to over-clutter your chart with other indicators, but that is a rule of thumb more set for overlays.
Timeframe Considerations
Adapt the Ichimoku Cloud to different timeframes based on your trading style. Higher time frames may provide more reliable signals, while lower timeframes may offer shorter-term opportunities. I don’t believe it ever hurts to back out a few time frames to get a clear picture of market dynamics and avoid tunnel vision.
Conclusion
The Ichimoku Cloud is a versatile indicator, and today we scratched the surface of how it can be appropriately used. Remember, practice, patience, and continuous learning are critical for refining your skills and adapting the Ichimoku Cloud strategy to ever-evolving market conditions. If there is anything unclear or you have any questions, please don’t hesitate to comment below. Trading education is our passion, and we are happy to help. Happy trading! :)

EDUCATION: The most common model patterns!Hello traders, I present to you a few candlestick patterns that appear frequently and have a fairly large win rate.
CUP AND HANDLE
The cup and handle pattern on the price chart resembles a cup with a handle, where the cup is U-shaped and the handle slopes down slightly.
The cup forms after moving upwards and looks like a bowl or round bottom. When the cup is completed, a narrow price range develops on the right side and a handle is formed. A subsequent breakout of the trading range forms the handle indicating a continuation of the previous upward move.
PENNANT PATTERN
This is a type of continuation pattern that forms when there is a major move in the market, known as a flagpole, followed by a period of consolidation with converging trendlines, pennants, and finally a move. breaks in the same direction, like the original move, representing the second half of the flagpole.
FLAG
The flag pattern is used to determine the possibility of a continuation of a previous trend from a point where the price has drifted in the same trend. If the trend continues, the price could rise rapidly, making it an advantageous time to trade using a flag pattern. If you think you've seen a flag to trade, the most important thing is a fast and steep price trend.
If the price slowly rises and falls below the flag, you should not trade at that time.
DOUBLE BOTTOM
The trajectory of the price line during the formation of the pattern resembles the letter "W". The last two price lows, located approximately the same, are a strong support zone where two price reversals are made to the upside.
When the market price breaks through the resistance level of the pattern, the formation of the pattern is complete. The BUY signal appears and the trend will change.

The Divergence Cheat Sheet: Your Quick Reference GuideHello dear @TradingView community!
In this guide, we will delve into the concept of divergence and its significance in technical analysis, specifically focusing on its application in the cryptocurrency market, particularly Bitcoin.
Understanding Divergence: A Key Concept in Trading
Divergence occurs when the price of an asset and an indicator, such as the Relative Strength Index (RSI), move in opposite directions. This pattern provides valuable insights into potential price reversals or changes in trends.
The Divergence Cheat Sheet
To help us identify and interpret divergence patterns, a divergence cheat sheet can be an invaluable tool. It provides a concise overview of different divergence patterns and assists us in making timely and accurate decisions.
By having a cheat sheet on hand, you can save time, reduce errors, and ensure they don't miss crucial signals in the fast-paced cryptocurrency market.
Detecting Divergence
Detecting divergence is crucial for identifying lucrative trading opportunities. By using divergence indicators like the RSI, MACD, or Stochastic Oscillator, we can gain significant insights into market trends and potential price reversals.
To pinpoint divergence effectively, follow these steps:
Choose an indicator capable of detecting divergence, such as the RSI, MACD, or Stochastic Oscillator.
Look for discrepancies between the indicator and the price action. Regular divergence occurs when the price and the indicator move in opposite directions, while hidden divergence occurs when they move in the same direction but at different rates.
Monitor the direction of the trend. Divergence can indicate a trend reversal, so keeping track of the current market trend is crucial.
Confirm the divergence signal with other technical analysis tools. Divergence is just one piece of the puzzle, so it's essential to use other indicators to validate your trading decisions.
Examples of Divergence in Trading Charts
Let's examine a few examples of divergence on Bitcoin charts:
Strong Bullish Divergence:
When lows of the price decreases while the RSI increases, a regular bullish divergence occurs. This signals a potential trend reversal and presents an opportunity for a bullish trade.
Strong Bearish Divergence:
When highs the price of an asset is rising while the RSI is falling, it indicates a regular bearish divergence. This suggests a potential trend reversal and presents an opportunity for a bearish trade.
Medium Bullish Divergence:
When the lows of an asset remain equal while the RSI is rising, it indicates a medium bullish divergence. This suggests a potential increase in price, although it may not be a strong upward movement.
Medium Bearish Divergence:
When the highs of an asset remain unchanged while the RSI is decreasing, it indicates a medium bearish divergence. This suggests a potential decline in price, although the downward movement may not be significant.
Weak Bullish Divergence:
When the lows of an asset is decreasing while the RSI lows is equal, it indicates a weak bullish divergence. This suggests a potential increase in price, although it may not be a strong upward movement.
Weak Bearish Divergence:
When the highs of an asset are rising while the RSI remains unchanged, it indicates a moderate bearish divergence. This suggests a potential decline in price, although the downward movement may not be significant.
Hidden Bullish Divergence:
Hidden bullish divergence occurs when the price creates higher lows while the RSI is creating lower lows. This reinforces an existing uptrend and suggests its strength.
Hidden Bearish Divergence:
Hidden bearish divergence is observed when the price forms lower highs while the RSI forms higher highs. This indicates a potential weakening of the current uptrend and might signal a trend reversal or a pullback.
By recognizing these divergence patterns on trading charts, we can gain insights into potential market reversals, entry and exit points, and adjust trading strategies accordingly.
Incorporating Divergence into Your Trading Strategy
To effectively incorporate divergence into your trading, consider the following steps:
Identify the appropriate indicators: Choose reliable indicators such as RSI, MACD, or Stochastic Oscillator that can detect divergence patterns effectively.
Learn to spot divergence: Familiarize yourself with the different types of divergence patterns and practice identifying them on price charts. This will help you develop a trained eye for spotting potential trading opportunities.
Confirm with additional analysis: While divergence can provide valuable signals, it's essential to use other technical analysis tools to confirm your trading decisions. Look for supporting indicators, chart patterns, or trendline breaks that align with the divergence signal.
Set clear entry and exit criteria: Define your entry and exit points based on the divergence signal and your risk tolerance. Consider using stop-loss orders and take-profit levels to manage your trades effectively.
Practice risk management: Implement proper risk management techniques, such as position sizing, to protect your capital. Divergence alone should not be the sole basis for your trading decisions but rather an additional tool in your arsenal.
Backtest and refine your strategy: Test your divergence-based trading strategy on historical price data to assess its effectiveness. Make adjustments as needed and continuously monitor and evaluate your results to improve your trading approach.
Remember, divergence analysis is not foolproof and should be used in conjunction with other technical analysis methods and market factors. Regular practice, continuous learning, and adapting to changing market conditions are crucial for successful trading.
Divergence analysis is a powerful tool that can provide us with an edge in the cryptocurrency market. By understanding and effectively utilizing divergence patterns, we can identify potential trend reversals, improve entry and exit timing, and enhance overall trading strategy. Incorporate divergence analysis into your trading approach and combine it with other technical indicators and risk management techniques for a well-rounded and informed trading strategy.

Mastering CFD Trading: A Comprehensive Beginner's GuideContracts for Difference (CFDs) have garnered significant attention as derivative products that offer traders the ability to speculate on the price movements of various assets without the need to own them physically. These financial instruments emerged in the latter part of the 20th century, propelled by the advent of the internet revolution, which revolutionized trading by facilitating swift and convenient short-term transactions.
CFDs have since become an integral part of the repertoire offered by prominent brokers, providing traders with enhanced leverage and access to an extensive range of markets that encompass stocks, indices, currencies, and commodities. This broad market coverage has contributed to the popularity and widespread adoption of CFDs among traders seeking diverse investment opportunities.
The historical roots of CFDs can be traced back to the late 1980s and early 1990s. It was during this period that derivative trading witnessed significant advancements, driven by technological progress and regulatory changes. The introduction of electronic trading platforms and the availability of real-time market data allowed traders to execute trades swiftly and efficiently, leading to the development of CFDs as a viable financial instrument.
The operational mechanics of CFDs are relatively straightforward. When trading a CFD, the trader enters into a contract with a broker, mirroring the price movements of the underlying asset. This contract stipulates that the trader will pay or receive the difference in price between the opening and closing positions of the CFD. If the price of the underlying asset moves in the trader's favor, they stand to make a profit. Conversely, if the price moves against their position, they may incur a loss.
One of the key advantages of trading CFDs is the ability to utilize leverage. Leverage allows traders to control a larger position in the market with a smaller initial investment. This amplifies potential gains, but it is important to note that it also magnifies potential losses. Traders should exercise caution and employ risk management strategies when using leverage in CFD trading.
Furthermore, CFDs offer traders the flexibility to profit from both rising and falling markets. Through a process known as short-selling, traders can speculate on price declines and potentially profit from downward market movements. This ability to take both long and short positions provides traders with opportunities to capitalize on market trends and volatility.
However, it is crucial to acknowledge that CFD trading carries inherent risks. Due to the leverage involved, losses can exceed the initial investment, potentially resulting in significant financial losses. Moreover, CFD trading is subject to market volatility, and sudden price movements can lead to rapid and substantial losses.
Throughout this comprehensive article , we shall delve into the historical backdrop of CFDs, elucidate their operational mechanics, and present an evaluation of the advantages and disadvantages associated with trading these financial instruments.
History Of CFD:
Towards the conclusion of the 20th century, the landscape of exchange trading underwent a profound transformation, thanks to the advent of the Internet. This revolutionary technology empowered traders to engage in rapid short-term trades with unparalleled ease. Consequently, intraday trading emerged as a prominent trend, and astute brokers swiftly recognized the burgeoning demand for this segment among individual traders.
However, a significant predicament persisted within the trading realm - exchanges were highly specialized and compartmentalized. Currency exchanges, stock exchanges, and futures exchanges operated as distinct entities, precluding traders from capitalizing on opportunities across multiple asset classes. For instance, a trader operating with a currency broker lacked the means to profit from futures or stocks.
While opening multiple accounts with different companies was a possible solution, it was far from optimal. Furthermore, another obstacle loomed large: high leverage was imperative for generating profits through short-term transactions, yet traditional stock exchanges were averse to the risks associated with margin trading.
In response to these challenges, visionaries at UBS Investment Bank conceptualized a new trading instrument known as the contract for difference (CFD). This innovative derivative allowed traders to profit from the price fluctuations of various assets without the need to physically own them or conduct transactions on the underlying exchanges. Traders could now conveniently engage in trading shares, oil, and other commodities using a single broker. Additionally, CFDs provided the desired leverage for short-term trading, overcoming the limitations imposed by traditional stock exchanges.
Over time, CFDs became widely available, offered by popular brokers operating in diverse markets, including the forex market. Presently, this versatile financial instrument is successfully utilized by both short-term traders and long-term investors, catering to a broad spectrum of trading styles and planning horizons. The flexibility and accessibility of CFDs have made them an indispensable tool in the arsenal of market participants seeking to capitalize on price movements and maximize their trading potential.
CFD Leverage Explained:
One of the notable features of CFD trading is the availability of margin trading, which enables traders to borrow funds from their brokers. This concept is closely tied to the notion of leverage, which has a significant impact on the trading process. Leverage allows traders to control larger positions in the market with a smaller amount of their own capital.
To illustrate the concept, let's consider an example. Suppose a trader utilizes a 1:50 leverage. This means that with just $1,000 of their own funds, they can open a position equivalent to $50,000. In this scenario, the borrowed funds provided by the broker amplify the trader's purchasing power, enabling them to access larger market positions.
The level of leverage available in CFD trading varies depending on the underlying asset being traded. For instance, when trading shares, the leverage typically ranges up to 1:20. On the other hand, for commodities like oil, leverage can often reach as high as 1:100.
It is important to note that when comparing leverage in CFD trading to leverage in forex currency pairs, the ratios may appear different. A 1:20 leverage in CFDs might seem relatively lower when contrasted with the leverage commonly available in forex trading. However, it is crucial to consider these ratios within the context of their respective markets.
In traditional stock markets, equity leverage is typically limited and rarely exceeds 1:2. This means that traders in those markets have less flexibility in terms of controlling larger positions with a smaller amount of capital. In contrast, CFDs provide traders with significantly higher leverage, allowing them to amplify their potential gains and losses.
It is important to approach leverage in CFD trading with caution and exercise risk management strategies. While leverage can magnify profits, it also amplifies potential losses. Traders should be mindful of the increased risk associated with higher leverage levels and consider their risk tolerance and trading strategies accordingly.
Comparing leverage ratios across different markets provides insights into the varying degrees of flexibility and risk exposure available to traders. Understanding and utilizing leverage effectively is an essential aspect of CFD trading, enabling traders to optimize their trading strategies and potentially enhance their profitability, while remaining cognizant of the associated risks.
How CFDs Work:
Let's break down the scenario provided to understand the implications of trading CFDs compared to traditional stock ownership.
Assuming the Ask price per share is $171.23, a trader purchasing 100 shares would need to consider additional costs such as commissions and fees. In a traditional brokerage account with a 50% credit on margin, this transaction would require a minimum of $1,263 in available funds.
However, with CFD brokers, the margin requirements are typically much lower. In the past, a 5% margin was common, which would amount to $126.30 for this trade.
When opening a CFD position, the trader will immediately experience a loss equal to the size of the spread at the time of the trade. For example, if the spread is 5 cents, the stock price must rise by 5 cents for the position to reach the breakeven level.
If the trader owned the stock directly, they would make a 5 cents profit. However, it's important to consider that owning the stock directly would entail paying a commission, resulting in higher overall costs.
Now, let's consider the scenario where the offer price of the stock reaches $25.76. In a traditional brokerage account, positions could be closed at a profit of $50, resulting in a 3.95% return on the initial investment of $1,263.
However, in the case of CFDs, when the price reaches the same level on the national exchange, the bid price on the CFD may be slightly lower, let's say $25.74. Consequently, the profit from trading CFDs would be lower since the trader must exit the trade at the bid price. Additionally, the spread in CFD trading is typically wider compared to regular markets.
In this example, the CFD trader would earn approximately $48, resulting in a 38% return on the initial investment of $126.30.
It's worth noting that these figures are specific to the example provided and may vary depending on various factors, including the specific brokerage, market conditions, and the pricing dynamics of the underlying asset.
Why Trade CFDs / Pros And Cons Of Trading CFDs
Indeed, one of the significant advantages of trading CFDs is the expanded range of tradable instruments compared to the classical forex market. While the forex market primarily deals with currencies, CFDs provide traders with the opportunity to trade a wide array of assets. Most brokers now offer CFDs on various instruments such as gold, stocks, and stock indices, greatly diversifying the available trading opportunities.
However, it is important to note that CFDs are not a direct replacement for the underlying assets. Although the price of a CFD contract reflects the price movements of the underlying instrument, there may be differences in the actual returns. These differences can be attributed to factors such as spreads, commissions, and other costs associated with CFD trading.
Speaking of commissions, it is crucial to consider that CFD commissions may differ from those applied to the underlying asset. This distinction becomes particularly relevant in longer-term trading scenarios. Traders need to carefully evaluate the commission structure and any associated fees when assessing the overall costs of trading CFDs.
Now let's delve into the main advantages and disadvantages of trading CFDs:
Pros of CFD Trading:
1 ) Expanded Market Access: CFDs provide access to a wide range of markets, including stocks, commodities, indices, and more, allowing traders to diversify their portfolios and capitalize on various asset classes.
2 ) Leverage and Margin Trading: CFDs offer the potential for higher leverage, allowing traders to control larger positions with a smaller initial investment. This amplifies potential profits (as well as losses) and can enhance trading opportunities.
3 ) Ability to Profit from Both Rising and Falling Markets: CFDs enable traders to take advantage of both upward and downward price movements. Through short-selling, traders can speculate on price declines and potentially profit from falling markets.
Cons of CFD Trading:
1 ) Counterparty Risk: When trading CFDs, traders are exposed to counterparty risk, as they enter into contracts with the broker rather than owning the underlying assets. If the broker encounters financial difficulties or fails, it can impact the trader's positions and funds.
2 ) Potential for Higher Costs: CFD trading may involve additional costs such as spreads, commissions, and overnight financing charges. These costs can impact overall profitability, especially for longer-term trades.
3 ) Market Volatility and Risk: CFDs are subject to market volatility, and sudden price movements can result in rapid and substantial losses. The use of leverage in CFD trading can amplify both gains and losses, making risk management crucial.
It is essential for traders to consider these pros and cons when deciding to engage in CFD trading. Adequate risk management strategies and a thorough understanding of the underlying markets and associated costs are essential for successful and informed trading decisions.
Risks Of Trading CFDs:
Trading CFDs (Contracts for Difference) involves inherent risks that traders should be aware of before engaging in such activities. Understanding these risks is essential for making informed decisions and implementing appropriate risk management strategies. Here are some of the key risks associated with CFD trading:
Leverage Risk: CFDs allow traders to access larger market positions with a smaller initial investment. While leverage can amplify potential profits, it also magnifies losses. Traders need to be cautious and manage leverage effectively to avoid significant financial setbacks.
Market Risk: CFDs are directly linked to the price movements of underlying assets, which can be influenced by various factors, including economic indicators, news events, and market sentiment. Rapid price fluctuations can lead to substantial losses, especially if positions are not managed appropriately.
Counterparty Risk: When trading CFDs, traders enter into a contractual agreement with the CFD provider. This exposes them to counterparty risk, which refers to the possibility of the provider failing to fulfill its obligations. It is crucial to choose a reputable and regulated CFD provider to minimize this risk.
Operational Risk: CFD trading platforms can experience technical issues, such as system outages or errors, which may prevent traders from executing trades or managing positions effectively. Traders should be prepared for such operational risks and have contingency plans in place.
Liquidity Risk: In certain cases, CFD markets may lack sufficient liquidity, meaning there is a limited number of buyers and sellers. This can make it challenging to enter or exit positions at desired prices, particularly during volatile market conditions. Traders should be cautious when trading illiquid CFD markets.
Hidden Costs: Some CFD brokers may impose additional fees and charges, such as overnight financing fees or spread mark-ups. These hidden costs can reduce profitability over time, and traders should carefully review the fee structure of their chosen CFD provider.
To mitigate these risks, traders are advised to implement risk management techniques, including setting stop-loss orders to limit potential losses, conducting thorough market analysis, and continuously monitoring positions. It is also crucial to conduct due diligence when selecting a CFD provider, ensuring they are regulated and offer transparent pricing structures and reliable customer support.
By understanding and effectively managing these risks, traders can enhance their chances of success and navigate the complexities of CFD trading more confidently.
Choosing A Broker For CFD Trading:
When selecting a broker for CFD trading, certain parameters take precedence. These include:
1 ) Reliability and Reputation: When it comes to CFD trading, the importance of a broker's reliability and reputation cannot be overstated. Given the instrument's relative lack of popularity, there may be instances of limited liquidity, which increases the temptation for unethical practices such as manipulating charts or altering quotes. It is crucial to choose a broker known for their trustworthiness and positive reputation.
2 ) Variety of CFDs for Trading: It is advisable to thoroughly examine the broker's website and review the comprehensive list of available contracts. Ensure that the list includes the specific CFDs you intend to trade. Having access to a wide range of CFD options allows you to diversify your portfolio and pursue various trading opportunities.
3 ) Contract Specifications: Identify the CFDs in the broker's list that you plan to trade frequently. Pay attention to the contract specifications, including spreads, commissions, and swaps, as they should align with your trading style and objectives. If you require high leverage, verify the leverage availability for each CFD category.
By carefully considering these parameters, you can make an informed decision when choosing a broker for CFD trading. This will contribute to a more satisfactory trading experience and help you align your trading strategy with your goals.
Conclusion:
Contracts for Difference (CFDs) provide traders with a gateway to a diverse range of popular exchange-traded assets. Through a single CFD broker, traders can engage in trading activities involving stocks, indices, and even cryptocurrencies.
The key to achieving success in CFD trading lies in the trader's level of proficiency in understanding the intricacies of specific instruments. The most favorable outcomes are typically attained by individuals who concentrate their efforts on a particular asset class or even a specific instrument within that class. By acquiring comprehensive knowledge and a deep understanding of the various factors that influence prices, traders can surpass market performance and reap the rewards they rightfully deserve. This focused approach enhances their ability to make informed decisions, seize profitable opportunities, and maximize their potential gains in the CFD market.

Risk Reward Ratio ExpainedThe key to becoming successful as a Forex trader is to find the right balance between how much you risk per trade to achieve the desired profit you are aiming for. This balance needs to be realistic and relevant to the technical strategy you are applying. You need to combine risk reward with your strategy.
The risk-reward ratio is simply a calculation of how much you are willing to risk in a trade, versus how much you plan to aim for as a profit target. To keep it simple, if you were making a trade and you only wanted to set your stop loss at five pips and set your take profit at 20 pips, your risk reward ratio would be 5:20 or 1:4. You are risking five pips for the chance to gain 20 pips. The basic theory for the risk-reward ratio is to look for opportunities where the reward outweighs the risk. The greater the possible rewards, the more failed trades your account can withstand at a time. When it comes down to it, it is up to you as a trader to figure out what type of risk-reward ratio you want to use. You should try to avoid having your risk be bigger than your reward, particularly if you are a beginner, but there is no particular ratio that works for all traders. The important thing is that you use a ratio that makes sense for your trading style and for market conditions!
I recommend to use 1:2 risk reward ratio.
Have a great day 📊

EDUCATION: DCA with Trader!What is DCA? How to use the price averaging strategy to increase profits
DCA or price averaging strategy can be an effective way to manage risk when investing in assets like stocks, cryptocurrencies… I will walk you through how it works and its pros and cons. for easy understanding.
When considering investment, if you have a large amount of money in hand ready to invest. DCA is a method that can be suitable for both experienced and new investors to reduce the risk of seeing how their investments decline in value.
What is DCA?
- DCA (price averaging strategy) is a method of breaking down capital to invest in a fixed and more frequent way over a long period of time.
- This is a smart investment strategy. However, you must not confuse it with the fact that you bottom out the price of an asset when it drops deep to buy at a good price.
- DCA is really good if you correctly predict the trend by analyzing the market. And of course, the price averaging strategy must involve technical analysis or specifically instrument indicators such as MA, MACD, Bollinger bands, Elliott waves, etc.
Bitcoin problem using DCA
Now do a math on Bitcoin investment for you to visualize.
Problem 1: Buy Bitcoin once with all assets
This is the case I think is mostly true for newcomers to the market. For example, you have 10000$ and buy it all with bitcoins for 8000$. You get 1.25 BTC.
Then Bitcoin achieves the gain/loss that you want to sell, then we will have a profit/loss table with the selling prices as follows:
- SELL at 6000$ = Take Profit -2000$
- SELL at 12000$ = Take Profit 2000$
- SELL at 14000$ = Take Profit 4000$
This is a basic math problem. The next step is to use the average price of your capital. Try it out and see how it turns out. Here, I will divide according to market developments so that you can consider it in the most comprehensive way.
Problem 2: DCA in a bear market
This is a problem that makes the DCA method really shine. Now, let's say the plan with the capital of 10000$ above will buy in batches. Divide the capital into 4 times, so use $ 2500 for each installment.
Proceed to buy bitcoin at 8000, 6000, 5000, 3000. So after 4 such purchases the number of Bitcoins you hold is 2.0625 BTC. After that BTC returns to the upside, you will calculate profit and loss at the prices if you sell as shown in the table below:
- SELL at 4000$ = Take Profit -1750$
- SELL at 10000$ = Take Profit 10625$
- SELL at 12000$ = Take Profit 14750$
Do you see that if the expectations are right, the profit will be huge. When bitcoin fell, you increased your holdings more than you could buy once. Investment capital increased as BTC price increased with a total profit of ~1.5 times when selling at $12000.
Problem 3: DCA in a sideways market
When the market moves sideways for a year, for example, the price moves in a narrow range. You can buy bitcoin in 4 batches at the prices 8000, 7500, 7000, 6000. With these buying prices you will buy 0.877976 BTC.
You can see it's similar to a one-time purchase with all capital, right?
The market can move sideways, up and down. But end up where they started in the long run. However, you will never be able to accurately predict where the market is headed.
If bitcoin had moved even lower, rather than higher, the price average would have allowed for even bigger profits. This is where you make sure you have long-term profits, not just immediate ones.
Problem 4: DCA in a rising market
In this last problem, also divide the capital of 10000$ into four installments for 5000, 6500, 7000, 8000. So after 4 purchases you have 1.55 BTC. When the price increases, you have the profit and loss in the following table:
- SELL at 4000$ = Take Profit -3800$
- SELL at 6000$ = Take Profit -700$
- SELL at 8000$ = Take Profit 2400$
This is a problem where DCA performs a bit poorly, at least in the short term. Bitcoin rallied higher and then continued higher. Therefore, price averaging does not help you maximize your profits. This one involves buying the whole thing in one go.
But unless you are making short term profits, this is a rare scenario in life. Bitcoin can evaporate, kkk. So, if you are investing for the long term, it is advisable to spread the capital in the trades. Even if that means you have to pay more at a certain price.
Is the price averaging strategy really good?
In general, the price averaging strategy offers three main benefits that can lead to better returns: Avoiding market fomo, avoiding market confusion, Long term investment thinking.
Because investors often fluctuate between fear and greed. They tend to make emotional trading decisions when the market reverses.
However, if you use DCA, you will buy when people are selling in fear (green quit, red watch, kkk).
Get a good price and set yourself up for a long profit. Markets tend to move up over time, and averaging prices can help you realize that a bear market is a great long-term opportunity. Instead of being afraid of things.
Limitations of the average DCA method
The first, perhaps the most discussed, is the modest profit. More frequent purchases increase transaction costs. However, with exchanges charging less transaction fees, this cost becomes more manageable.
Furthermore, if you are investing for the long term, the fees will become very small compared to your overall portfolio since you are buying for long term investment purposes. Binance is my top choice because of its diverse ecosystem and reasonable fee schedule.
Second, you can forego the profit you would have earned if you had invested in a one-time purchase and the property you purchased appreciates in value.
However, the success of trading largely depends on identifying the market correctly when predicting the short-term movement of an asset class. This is done by famous and good analysts.

What is the EMA? How to use EMA most effectively!What is EMA?
EMA or Exponential Moving Average (EMA) – An exponential moving average (EMA) is a type of moving average (MA) that is based on a weighted exponential formula that is more responsive to changes recent prices, compared to a simple moving average (SMA) that only applies equal weight to all periods, helping the EMA to smooth the price line more than the SMA.
What signals does the EMA provide to traders?
Moving averages offer a significant benefit by offering clear insight into price trends. In other words, the Exponential Moving Average (EMA) cannot exceed or remain above the price line unless the price is increasing. Similarly, it cannot be below the price line if the price is not actually decreasing. This is crucial for traders as it provides a distinct and reliable indication of the price trend, avoiding any ambiguity. The trend is essential in helping traders identify entry points.
The EMA will become a dynamic resistance, because it moves in the direction of the price, which means where the price goes, the EMA will follow.
Become dynamic support and resistance levels (these resistance levels can be used to compare the trendline, support and static resistance lines). From here will look for entry points, stop loss and take profit points.
Identify price trends.
Which EMA should be used most appropriately?
EMA 9 or EMA 10: This number represents a two-week period of trading, making EMA9/EMA10 commonly used for short-term transactions.
EMA 34/EMA 89 are used to align with the primary waves as per the Elliott wave theory.
EMA 20, EMA 50, EMA 200 are closely associated with trading sessions. Over the course of a year, we can typically trade for around 200 days, accounting for holidays and breaks. EMA50 represents the medium term, corresponding to the four seasons in a year, with each season having approximately 50 trading sessions. Similarly, EMA 20 represents the month.
Some traders also utilize the 250 EMA in addition to the 200 EMA, believing that 250 represents the number of trading days in a year.
EMA100 is a commonly chosen EMA due to its round number value. Round numbers are often seen as psychological barriers in trading.
Compare trendline with EMA:
As mentioned earlier, EMA is another way to identify trends, just like the trendline.
To better understand this concept, the trendline can be seen as a fixed resistance. Once you draw a trendline, it will act as a reference point for the price.
On the other hand, EMA is a dynamic resistance. It moves along with the price line. Unlike the trendline, EMA closely follows the price line because it is calculated based on the price itself. This makes EMA more accurate in showing the trend. It can clearly indicate whether the price is above or below the EMA.
Some notes with EMA:
- When the price surpasses or falls below the EMA, but then retreats below it again, it indicates a strong downtrend or uptrend.
- If the price strays too far from the EMA, it is advisable to wait for it to correct itself and return to the EMA before considering any trading actions.
- Fast EMAs or short period EMAs are more sensitive to price movements compared to slow EMAs, but they are also more prone to breakdowns. This can be advantageous as it allows for early trend identification compared to the SMA. However, the EMA is likely to experience more frequent short-term fluctuations compared to the corresponding SMA.
- EMAs act as dynamic resistance levels that consistently track the price line.
- The EMA is not primarily used for pinpointing exact tops or bottoms. Instead, it assists traders in aligning their trades with the prevailing trend.
- The EMA always has a delay, making the SMA more useful in sideways markets, while the EMA is more effective in clearly trending markets.
Thank you @TradingView !

The Trojan Horse of TradingThe Trojan Horse was a wooden horse used by the Greek army to enter the city of Troy and win the war. Although the inhabitants of the town had initially perceived the horse as a victory trophy, Greek fighters emerged from inside of it and destroyed the city.
"Yeah, that's a nice story. But how the heck is it related to trading?"
Let us clarify.
Trading is generally considered as one of the "easiest hardest" ways of making money. Upon learning about the limitless number of opportunities provided by the financial markets, newbies get excited and believe in the false promises offered by some "John Smith FX Trader" on Instagram that drives a purple Lamborghini and posts demo account profits. To be less cruel and offending, newcomers think they can become consistently profitable full-time investors/traders almost instantly.
Hence, we compare trading to the Trojan Horse that is full of "big sharks" such as institutional traders, hedge funds, market manipulating brokerage firms and so forth. In this case, retailers act as residents of the city of Troy and perceive the horse as a gift dedicated for the triumph.
Undoubtedly, as already stated, the world of trading presents a vast number of opportunities that one can benefit and make profits from. However, the drawbacks should not be discarded either.
Illustrated, we can find some of the hardships that are hiding behind the glamorous GUCCI bags, Shangri-La hotels, Michelin starred restaurants and Bentley sport-cars.

Price BreakoutsHello traders 📊
On this picture here you can see 3 types of breakouts. On the left side you can see breakout examples in an downtrend and on the right side, you can see examples in an uptrend.
Breakouts occur when price breaks a certain zone (support or resistance) and in many cases breakouts represent very important moment. This is usually good time to look for opportunity to trade.
First type of breakout is "strong breakout". They occur once the price breaks certain zone with a strong candle and continue to move without pullback.
Second type of breakout is "retest". Retests are very common and extremely useful. Some of the best trading opportunities are when retest occurs. This means that price went back to test previously broken zone and this is usually good place to buy or sell.
Third type of breakout is "fake-out". This is the worst scenario as price quickly goes back after a breakout. Traders usually enter after a breakout, but once fake-out occurs, traders lose as price goes back quickly to hit stop loss.
We can not know exactly when fake-out will occur, but the best way to protect your account from this is to wait for the candle to close and to avoid to trade when big news are about to release.
Have a great day!

Why do Patterns fail so often?To answer this question, let's try to take a classic Pattern as an example: the "Head and Shoulders" .
Typically Traders take short position (in this example) on neckline breakout and place stop loss above right shoulder or head.
If we only take these elements into consideration, it often happens that pattern fails.
Why does this happen? Because these elements are not enough and we need to use some "filter".
One of these filters, and perhaps the most important, is the "placement".
For example, the Head and Shoulders is considered a Reversal Pattern that should only appear at the end of a Trend, and this is where the "Elliott Waves" come into play. In fact Elliott claims that a Trend is formed of 5 waves (3 + 2) and often the first signal of the end of the trend is the first bearish leg after wave 5 (Wave A).
Another important filter could be RSI indicator because often some divergence also appears in wave (5).
In conclusion, the Patterns work very well on the market but you also need to learn how to use them correctly, trying to use some filters to get some more confirmation and limit losses as much as possible.
Naturally these considerations are personal and come only from my experience, but they are absolutely subjective and therefore open to criticism.
...I hope I was helpful.

To TA or not to TA: The Pros and Cons of Technical AnalysisTechnical analysis is one of the most popular trading strategies used by traders worldwide. It involves analyzing past market data, primarily price, market structure, and volume, to identify trends and forecast future price movements. While technical analysis has several benefits, it also has some drawbacks that traders must consider before incorporating it into their trading strategy. Today we will explore the benefits and drawbacks of using technical analysis in trading.
Benefits of Technical Analysis:
Identifying Trends: Technical analysis helps traders identify trends in the market, which is crucial for making profitable trades. There are several ways a trader can follow the trend of their desired asset using technical analysis. Be it moving averages, supertrends, or channels we really have many options.
Entry and Exit Points: Technical analysis helps traders determine the best entry and exit points for their trades. There are countless strategy options to utilize when considering the sheer number of indicators that exist. In our opinion finding a system that makes sense, is robust, and simple usually proves to be the most successful when proper discipline is used.
Risk Management: Proper technical analysis can help traders mitigate risk and protect their accounts. Stop losses are one method that we covered in a previous post. There are countless ways to set up stop losses using TA, but there are other techniques that can be used as well.
Hedging is a risk management strategy used to offset potential losses from adverse price movements in an asset. In trading, hedging involves opening a position in the opposite direction of an existing position. This position is usually in the same or a related asset to reduce the overall risk exposure. As an example, if a trader holds a long contract in a stock, they may hedge their position by opening a short contract in the same stock or a related asset such as an ETF or index. Technical analysis can be used to identify favorable conditions for hedging between assets. Hedging can help traders manage risk and protect profits, but it can also limit potential gains.
Confirmation of Fundamental Analysis: Technical analysis can confirm fundamental analysis by providing traders with an objective view of the market. For instance, if a trader believes that a company's stock is undervalued based on its financial statements, technical analysis can confirm this by showing that the stock is oversold.
Drawbacks of Technical Analysis:
Subjectivity: Technical analysis is subjective as different traders can interpret the same chart differently. This can lead to conflicting signals and confusion, especially for novice traders who aren’t as familiar with chart patterns. A prime example would be Bitcoin right now.
Or
False Signals: In technical analysis, false signals can be a significant issue in trading because they can lead to poor investment decisions and potential losses. For example, technical indicators may provide a false signal that a stock is oversold or overbought, causing a trader to make a trade that is not profitable. False signals can also occur due to market volatility or unexpected news events.
To reduce the risk of false signals, traders can use a variety of technical indicators and combine them with fundamental analysis to confirm trading decisions. Additionally, risk management strategies such as stop-loss orders can help limit potential losses from false signals.
Lagging Indicators: Technical analysis relies on lagging indicators, which means that traders are reacting to past price movements. This can result in missed opportunities, or poorly timed entries, especially in fast-moving markets. A very good example of a lagging indicator that is widely used is moving averages of any type.
Leading Indicators: There are some indicators that classify as leading indicators, but there are dangers to them with look-ahead bias. Look-ahead bias in indicators is a common issue in technical analysis. It occurs when historical data is used to construct an indicator that would not have been available at the time of the trade. This can lead to inaccurate signals, as the indicator may appear to predict future market movements, when in fact it is simply based on hindsight. An example of this would be the Ichimoku Cloud, specifically the cloud itself.
Over-use and Over-Reliance: This can mean a few things in trading. One of which is where traders will rely heavily on many indicators all at once. This can cause confusion as some indicators can have contrarian signals to one another.
Traders who rely solely on technical analysis may miss out on important fundamental factors that could affect the market. It is important to look at multiple objective vantage points of your desired asset. For instance, a sudden change in interest rates or economic policies could have a significant impact on the market, which technical analysis may not account for. In cryptocurrency
Conclusion:
In conclusion, technical analysis has several benefits, including identifying trends, entry and exit points, risk management, and confirmation of fundamental analysis. However, it also has drawbacks, including subjectivity, false signals, leading/lagging indicators, and over-reliance. Therefore, traders must use technical analysis in conjunction with other trading strategies, such as fundamental analysis, to make informed trading decisions. Being mindful of the pitfalls of common market analysis techniques can make you a better trader over time as you grasp a more comprehensive view of the market, and in turn, make more informed decisions when trading.

Stop Losses: A Trader's Best DefenseIn a perfect world, every trade would go our way, but alas this is usually not the case. A stop loss is a risk management tool used by traders and investors to minimize their losses when trading. It is a predetermined price level at which a trader's position will automatically exit the market, causing the loss to be realized. Stop losses are crucial to any trading strategy, as they help traders limit their losses and stay disciplined. In this blog, we will look at what stop losses are, why they are important, how to set realistic stop losses, and five different examples of stop losses with a description of how to set the stop loss.
What are Stop Losses?
A stop loss is an order to sell a security when it reaches a particular price. It is a predetermined price level at which a trader's position will automatically exit the market, causing the loss to be realized. This means that if the price of the security falls to the stop loss level, the trader's position is automatically closed, and any losses incurred are limited to that level. Stop losses are essential because they help traders limit their losses and stay disciplined.
Why are Stop Losses Important?
Stop losses are important because they help traders limit their losses and stay disciplined. In trading, it is easy to become emotional and let your losses run. Stop losses help traders avoid this situation by automatically exiting the market when the price reaches a predetermined level. This ensures that losses are limited, and traders can move on to the next trade without being emotionally affected by the previous loss.
Setting Realistic Stop Losses
Setting realistic stop losses is crucial to any trading strategy. A trader needs to consider the volatility of the security, the trading style, and the risk-reward ratio when setting stop losses. The stop loss should be set at a level where the loss is acceptable but not too close to the current price level, as this may result in the stop loss being triggered prematurely. A stop loss should also not be set too far away from the current price level, as this may result in the trader losing more than they are willing to risk.
Stop Loss Examples
Below we will list five examples of setting effective stop losses. For consistency, we are going to use the same long stop loss example, but these same examples can be set for stop losses for short positions as well.
Percentage-Based Stop Loss: A percentage-based stop loss is a stop loss that is set at a specific percentage below the purchase price. For example, if a trader wants to place a long at $0.088602 and sets a 0.5% stop loss, the stop loss would be triggered at $0.88160. For a short stop loss at 0.5%, you would add the value instead and have a 0.89035 stop loss. To set a percentage-based stop loss, the trader needs to determine the percentage they are willing to risk and place the stop loss order at that level.
ATR-Based Stop Loss: An ATR-based stop loss is a stop loss that is set based on the average true range of the security. The average true range is a measure of volatility and is calculated by taking the average of the high and low prices for a particular period. To set an ATR-based stop loss, the trader needs to determine the number of ATRs they are willing to risk and place the stop loss order at that level. For a long stop loss, you would subtract the ATR times its multiplier from the current price. For a short-stop loss, you would add the ATR times its multiplier to the current price. The unique upside to this stop-loss style is the ATR accounts for market volatility which can aid your risk management and help set more appropriate stop losses.
Using Moving Averages or Super Trend: Moving averages and super trend are technical indicators that can be used to set stop losses. Moving averages are calculated by taking the average price over a specific period, while the super trend is a trend-following indicator that uses the average true range to calculate the stop loss level. To set a stop loss using moving averages or super trend, the trader needs to identify the period and place the stop loss order at the appropriate level. The Moving Average or Supertrend can then act as a moving stop loss as it trails the price.
1. Moving Average:
2. SuperTrend:
Donchian Channels: Donchian channels are a technical indicator that can be used to set stop losses. Donchian channels are created by taking the highest high and lowest low over a specific period and plotting them on a chart. To set a stop loss using Donchian channels, the trader needs to identify the period and place the stop loss order at the appropriate level. In the example below we use a more standard 20-period Donchian level to identify areas of lowest low interest that would be a good place for a stop loss. If we were setting a short order we would look to recent highest highs as potential stop-loss areas
Conclusion
Stop losses are crucial to any trading strategy, as they help traders limit their losses and stay disciplined. When setting stop losses, traders need to consider the volatility of the security, the trading style, and the risk-reward ratio. Stop losses can be set using many different techniques, including percentage-based, ATR-based, using moving averages or super trend, and Donchian channels. By setting realistic stop losses, traders can minimize their losses and stay disciplined, which is essential for long-term success in trading.

Swing | Intraday | Scalp: pros and cons of three trading stylesAs we all know, the three most popular trading styles are the following: Swing trading, Day trading, and Scalping.
This educational post is concentrated on highlighting some of the pros and cons of all three techniques.
When it comes to Swing Trading (middle to long-term trading), some of the advantages are less screen time, less anxiety, less risk, and less candle noise. This style of trading is beneficial for those individuals that do not have enough time to sit in front of the charts and execute positions on a daily basis. However, some drawbacks should be mentioned as well. In order to be a swing trader, one needs to master the skill of remaining patient, disciplined and cold-blooded. Swing trades can run from one day up to a week, and hence, it is crucial to know how to sit on your hands and do nothing upon witnessing slow price action, indecision, drawdown and so forth.
Moving to intraday trading, no overnight and over-the-weekend risks can be associated with this style as executed positions are usually closed within a couple of hours when trading the H1 and lower-timeframe graphs. On the negative side, in order to make a living off day trading, a strong psychological temperament is needed along with a sufficient trading capital. If swing trading requires a minimum of a risk of 1-2% per trade, the number is lower for day trading. Hence, a bigger input (capital) is required in order to be able to make decent returns.
Last but not least: Scalping. The fans of this style of trading usually dedicate their focus on timeframes as low as the M5 and M1. Aiming towards capturing 5-10 pip movements, scalpers use smaller lot sizes in comparison to swing and day traders. Nevertheless, this trading style comprises of drawbacks such as indecision and a high degree of emotional state. Since the main purpose of scalping is capturing small price movements identified on lower-timeframe graphics, the noise and confusion is relatively high.
While all trading strategies have their own benefits and drawbacks, choosing a trading style that suits your goals and interests the most is highly linked with your personality. If you are a patient and, at the same time, a busy person, swing trading might be the best option for you. On the other hand, if you have enough time and patience to sit in front of the charts and execute trades on a daily and hourly bases, then either day trading or scalping might be the best variants to opt for.
Either way, it all narrows down to patience, long-term vision, discipline, persistence, and risk management. Choose one or two securities that you like trading the most, do not get discouraged while experiencing losses and moments of hardship, remain cold blooded and long-run oriented.
Investroy

Double Top/Bottom Pattern #️⃣OKXIDEAS!!!👨🏫Hello, everyone!👋 (Reading time less than 7 minutes⏰) .
There are many opportunities in the market that traders can get at every single moment. Some like to step up little by little, and some like to climb the mountain as soon as possible. The financial market, such as crypto and forex, is the same. That’s why some patterns represent the consequence of being an overnight millionaire.
In this article, I will discuss two resembling patterns and talk about how to trade with them.
------------------------------------------------------------------------------------------------------------------------------------------------
Double Top Pattern:
Double Top Pattern is the name of a classic pattern that can bring lots of money for the ones who use it to trade in different financial markets, such as cryptocurrency and forex.
It’s noted that this pattern is used in two-sided markets, and stock traders cannot use Double Top Pattern to enter but to exit.
Double Top Pattern is one of the most common technical patterns that can be used to identify an asset's roof on the chart.
Stay with me to learn how this pattern is drawn on the chart and how you can get dollars out of it in very simple words.
As the name suggests, Double Top represents the highest point of an asset in the area, which is known as a sensitive resistance zone.
Reversal patterns are one of the most important chart patterns. So is Double Top, which occurs at the end of an upward trend. That means Double Top is a bearish reversal pattern.
As the name shows, this pattern forms from two consecutive rounding tops according to the standard.
Here you can see what the Double Top Pattern looks like:
In an uptrend, the price breaks through resistance levels one by one, as it rises.
When the price reaches a vital resistance level stronger than the last support level, that resistance pushes the price down, and it breaks through the support level.
Buyers know that the uptrend has ended, and the price will enter a bearish channel.
The shape of this pattern is like the letter ‘M,’ which has caused many traders to name it the ‘ M pattern ,’ but I call it ‘ Double Top ’ or ‘ Twin Top .’
Here are some tips you have to know to reduce the mistakes you’ll probably face on the path:
Double Top can be used in any time frame.
In Double Top Pattern, the peaks are not exactly the same size or at the same price. You are about to ignore any slight differences between them.
The distance from the neckline to the top should be 20 to 25%(often) of the size of the upward trend; otherwise, it’s not considered a reversal pattern.
As you see in the picture, the price goes up for a while when the buyers struggle to push it up, but it cannot pass the neckline, so it’s rejected. This neckline touch is called “the last kiss,” which is one of the best short-entry positions. I recommend that a trader considers pullbacks as confirmations.
But on the other hand, you’ll lose some profits because not all the time pullbacks are completed. So, stay with me to tell you how to trade using the Double Top Patten.
How to trade on Double Top Pattern
There are some general methods that you can trade on Double Top Pattern; here you go:
1. Breaking neckline
The first strategy to trade using the Double Top Pattern is to take a short position when the neckline is correctly broken.
2. The price retracement to the neckline (pullback/last kiss)
The second useful strategy is to wait for the price to pull back to the neckline and then open a short position. It’s noted that the neckline is now considered a resistance line.
3. Combination of the first and second methods
To enter the short position transaction using the double top pattern, you can use a combination of the first and second methods. You can divide the amount of volume that you want to enter into a short position into equal amounts or amounts that are consistent with your capital management. Your first entry point can be when the price breaks the neckline in a valid way (better a bearish marubozu candle) / the second entry point can be when the price pulls back to the neckline / there is even a third point, a little below the level the valley where pullback began to form.
You can use a combination of the entry points I mentioned to enter a short position.
Does The Double Top Pattern Fail?
To tell the truth, all patterns have the possibility to fail, and Double Top is no exception.
Indeed, it’s no big deal, dude. A trader always finds a way to make enough profits.
As I mentioned, the Double Top Pattern is a reversal. When the price goes above the top, the pattern fails and is unsuitable for trading.
In this case, a buy signal can be considered. When the price passes the Double Top and goes up, a neckline is formed at the top, the line that connects the two tops on the above chart.
The entry point is when the price returns to this upper neckline. The stop-loss will be below the last bottom, and the take-profit point will be as long as the distance from the upper neckline to the last bottom.
Here is a secret I’ll tell you. Usually, after the failure of these reversal patterns, the upward trend continues with more strength, and you can make profits faster.
As I said earlier, during an uptrend, the price reaches its resistance zone, but it’s unable to pass it. Here the uptrend stops and finally it starts to go down in the opposite direction.
Now the buyers are pushing the price up to retest the resistance level, which is a hard shield to cross, and sellers are the winners in pushing the price to go down for the second time. This movement makes a pattern called “Double Top.”
But the point is that the Double Top pattern can appear in four different types.
Bearish reversal Adam and Eve Patterns; in descending order of power and efficiency:
1st.Eve & Eve Double Top (EEDT)
2nd.Adam & Adam Double Top (AADT)
3rd.Adam & Eve Double Top (AEDT)
4th.Eve & Adam Double Top (EADT)
Eve & Eve Double Top (EEDT)
Let’s see what the Eve-Eve pattern looks like. As you can guess, Eve-Eve consists of two round peaks. That is, both tops are similar to the upside-down letter U.
Adam & Adam Double Top (AADT)
In this type of pattern, you can see mountain-like price tops. That means the tops are similar to the upside-down of the letter V. In this type, one or two candles hit the resistance level.
Adam & Eve Double Top (AEDT)
In the case of Adam-Eve, the tip of the first top is sharp, and the second top is round and wide, which has a shape like an upside-down U.
Eve & Adam Double Top (EADT)
In this status, the first top is round, and the second top is pointed. Eve-Adam Double Top Pattern is exactly the opposite of the Adam-Eve one.
------------------------------------------------------------------------------------------------------------------------------------------------
Double Bottom Pattern:
Reversal patterns are in the tops and bottoms. The Double Bottom Pattern is a bullish reversal pattern that forms at the end of a downtrend, and it looks like the letter “ W ” in English. So it’s a good place to get a long position.
Unlike the Double Top pattern, buyers take control of the market so that when the price hits the support zone, it is pushed up again.
This pattern is one the best patterns for stock market traders with daily and long-term trades.
Double Bottom can be used in any time frame.
In two-sided markets, after engulfing the neckline, the potency of buyers increases, and more buyers enter the market.
Trading volume increases after breaking the neckline, so the price gradient steepens.
Here you can see an image of the Double Bottom Pattern:
How to trade on Double Bottom Pattern
After the price breaks the neckline, entering a long position can be profitable. But the confirmation is really important to be seen. The bullish Marubozu candle is one useful candle for pattern confirmation. Dojis and short candles are not that strong to convince confirmation. So you are about to face a fake break which leads the price to fall more.
Follow the steps below to make profits:
Entry points are like a double-top pattern.
Stop-loss is below the bottom.
Take-profit point is the distance from the neckline to the bottom.
Failed Double Bottom Pattern
Never forget that the patterns can be failed in the market due to the news and fundamental source. A professional trader is always looking for a valid confirmation.
When the price falls below two bottoms, the pattern fails. But you can earn money with the failed pattern too.
When the price passes the bottoms and goes down, a neckline forms under the pattern. This line connects the two bottoms.
Here I go with the failed Double Bottom Pattern:
The entry point is when the price returns to the neckline.
The stop-loss will be above the last top.
The take-profit point will be the distance from the bottom neckline to the last top.
Here is a picture of what a Failed Double Bottom Pattern looks like.
Classical patterns are in different shapes that directly affect their performance. Various types of Double Bottom Patterns are made with the Adam and Eve patterns.
These types of Double Bottom patterns are as follows:(in descending order of power and efficiency)
1st. Eve & Eve Double Bottom (EEDB)
2nd. Adam & Eve Double Bottom (AEDB)
3rd. Eve & Adam Double Bottom (EADB)
4th. Adam & Adam Double Bottom (AADB)
------------------------------------------------------------------------------------------------------------------------------------------------
🔔 Conclusion
Reversal patterns such as Double Top/Bottom can be really profitable, but the essential thing is to follow your strategy and capital management. I also suggest that you follow these educational series posts to get all you need about trading.

Unpopular trading advice: fall in LOVE with one pair ONLYIn a world where you can love anyone and anything your heart desires, fall in love with ONE currency pair ONLY.
The notion of "the more pairs I trade, the more money I will make" is false. If you wanna be a consistently profitable trader, it is more beneficial to focus on a small selection of securities and master them, and there is a concrete reason for that. Concentrating on one or two currency pairs instead of trading every single major, minor, and exotic pair will be more efficient, less confusing, and more profitable. When you study every single movement of any given pair, you get more experienced at trading it and you make more rational decisions and analyses.
Looking at the chart illustration, we might observe the trading log of all transactions we executed in April and May so far. With 8 trade entries and all of them being EUR/GBP, a total return of +9.6% has been generated constituting an approximate win rate percentage of 70%. Obviously, not every trade resulted in being profitable as we encountered 2 losses and a breakeven closure. Nevertheless, as we always indicate, trading is a game of big numbers and probabilities. Instead of trading 10 securities, we have only been focusing on one single currency pair recently.
One crucial thing that needs to be noted is the following: not always will the one specific currency pair of your choice provide you with clear swing opportunities as the example of EUR/GBP portrayed on the graph. Periods of long and dull consolidations, indecisions, and some other moments will take place and make a derivative unlikeable and less efficient to trade for a period of time.
Therefore, always have one or two other trades on the radar to eventually monitor and analyse along with the currency pair of your preference.
Love will save the world.
Investroy.

"Tag, You're It: Understanding Forex Correlations in Simple TermForex correlation is like a game of tag. You know how when you're playing tag with your friends, you all run in different directions and some of you end up running together while others run in opposite directions? Well, in forex trading, currency pairs are like friends running around in different directions.
Sometimes, two currency pairs move in the same direction, like when you and your friend are both running towards the same goal. This is called a positive correlation. Other times, two currency pairs move in opposite directions, like when you and your friend are running in opposite directions. This is called a negative correlation.
Just like how you can tag your friend to switch positions, forex traders can use correlations to help them trade better. If two currency pairs have a positive correlation, a trader might buy one currency pair and sell the other, hoping to make a profit when both pairs go up. If two currency pairs have a negative correlation, a trader might buy one and sell the other to manage their risk.
Remember, just like in tag, the way currency pairs move around can change depending on what's going on. So traders need to keep an eye on the news and be ready to change their strategies if needed.
