How to spot and avoid Stop Loss hunting: a complete guide Stop Loss hunting happens every trading day, and it's not something you would want to let fly under the radar.
We have carefully orchestrated some examples on the graph to give a clear picture of what this phenomenon really is, and listed some tips on how to avoid getting into this mouse trap.
In basic terms, Stop Loss hunting is the strategy of the price action spiking above/below key levels to enter the pool of Stop Loss orders and take the masses out of their positions before moving the price in the destined direction.
Looking at the first example, we can observe that a nice double top pattern has been formed. This is one of the clear indicators that the price might potentially drop after failing to rise above and forming a new top. Thus, a trader would most likely go short and set his Stop Loss a few pips above the freshly formed area of resistance. What happens next is obvious - a trader gets liquidated. Why? because him and tens of thousands of other market participants had set their Stop Losses at a very obvious key level - above the local zone of supply. After successfully spiking up and grabbing some liquidity, the price peacefully continues its bearish movements in the predetermined direction.
The second example is a similar one as well. "What a beautiful ranging market. Let's buy at support and sell at resistance." Only if it was that easy...
What happens next, the price spikes below the lower boundary of the sideways-moving range and grabs liquidity before moving in the upside direction.
Stop Loss hunting scenarios will always happen, and to be honest, we cannot really avoid them all. However, there are some tips that we can follow in order to evade these traps.
Firstly, you should never rush into entering positions. Eventually, the price will come to your levels and develop into some patterns (Double Top, Head&Shoulders etc.) before starting its big moves.
With that being said, no FOMO either. There will always be fish in the sea, just like there will always be opportunities in the market. Be patient, cold-blooded, and wait for your time.
Do not set a tight Stop Loss, because you will most likely get taken out immediately. Either set a wide one so you can escape hunting in case the price starts spiking up and down, or wait for cases of a fake breakout a.k.a liquidation before entering a position.
Last tip is a pretty smart one: set your entry orders at levels where masses would put obvious Stop Loss orders. Then, you will notice how many times the price goes in that direction.
Hope you enjoyed this Educational Post, dear TradingView community members! If you have any suggestions or recommendations for the next educational idea, feel free to let us know in the comment section below.
Educationalpost

SMC Education - Flip+CHoCH Confirmation Entry..!This Content is for Education Purpose only.!
Smart Money Concept ( Flip+CHoCH Confirmation Entry ) as I mentioned in the Chart.!
Keep Supporting LIKE, COMMENT And FOLLOW.!
Thank You.!

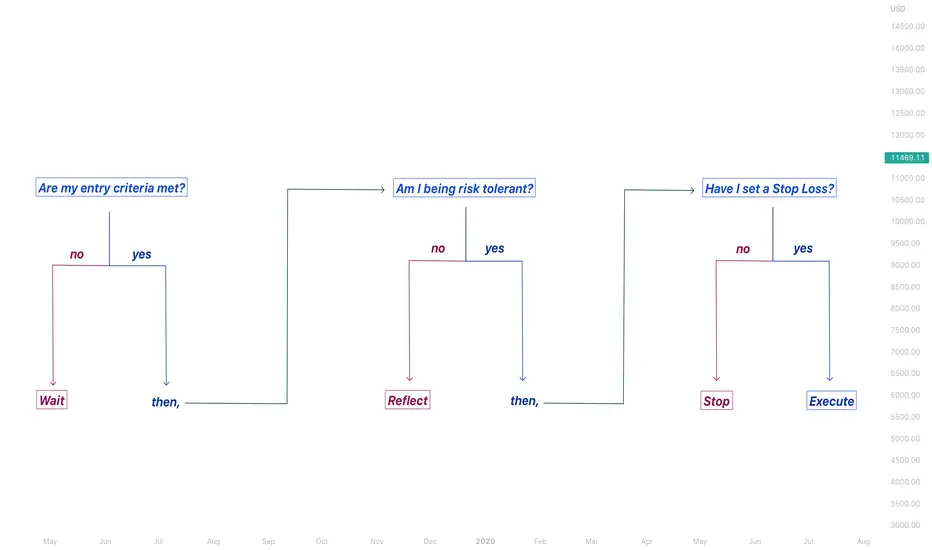
Questions to ask yourself before entering a tradeThere is a set of questions to ask yourself before opening a transaction and we will talk about some of the common ones.
1) Are my entry criteria met?
Undoubtedly, everyone has his own style of trading. Entry and exit strategies should be included in each and every trading plan there is. Only if the entry criterium is met, should we enter a position on any security. No FOMO, if our entry criteria have not been met, we sit on our hands and patiently wait.
2) Am I being risk tolerant?
Am I risking my usual 1-2% per position or I am too confident in this setup and would rather go all in? If you see yourself risking more than you usually do on a single trade, pause for a minute and thoroughly reflect. Yes, you can have some winners while risking a big portion of your total capital on a position, but does that not make you a gambler? Always remember that it is a marathon and not a sprint.
3) Have I set a Stop Loss?
Many people will say that it is not mandatory to set an SL if you are a position trader. Let me tell you this: a trade without a Stop Loss is like jumping off a cliff without a parachute. No matter how confident you are in your analytical skills, you can never be 100% sure that a trade will play out thoroughly according to your technical setup. Use a Stop Loss and carry on!
While there are many more questions that you may ask yourself before executing a position, we have addressed some popular ones. Of course, it solely depends on your trading plan, but the aforementioned questions can be implemented in every strategy.
Hope you enjoyed the read and thank you!
SMC - EDUCATION Bearish Entry Model..!This Content is for Education Purpose only.!
Smart Money Concept ( Bearish Entry Model ) as I mentioned in the Chart.!
Keep Supporting LIKE, COMMENT And FOLLOW.!
Thank You.!

Don't let the dopamine get you 🥴Do you feel excited? 😅
This is why. It's all down to the chemical reaction in your brain. Dopamine.
Dopamine is a chemical in the brain that makes us feel good.
Should you be feeling excited when trading?🤔
No.🙈 As this isn't gambling and shouldn't give you the same dopamine rushes like a gambling win does.
What's starts as initial excitement will move to fear, anxiety, stress and excitement again. 🤷🏻♂️
You become irrational and unable to stick to your plan.🤯
Entering trades through boredom for the 'rush' and closing profitable trades too early because of fear of the profit disappearing - all because you risked too much for that 'buzz'.
'So what can I do about it?' I hear you shout loudly....📢
Well this depends on if you really want to change or not, the downside is you'll think you will make less money ....
Think about it - you have a £5000 account right?
Option 1 - you trade 15 pairs at 0.5 lot size and your account is up and down like a yo yo - but it's exciting right?
Option 2 - you trade 3 pairs at 0.01 - your account movement is marginal.
Option 2 is less exciting for sure, but if you want excitement go and jump out of plane.
Option 1 will eventually lead to a blown account.
Option 2 will give you sustainable consistent trading - you'll let your winners run and you'll lose less on the losing trades. A win win.
Only when you get this bit right will you start to see positive change.
Emotional control is key
Be present doing other things without checking your phone to see how trades are going.
Exercise patience by sticking to your plan and letting your trades run instead of closing them early.
The only thing you can control in trading is YOU
Just don't end up letting the dopamine take control!
Have a good weekend everyone and thanks for looking
Darren👍

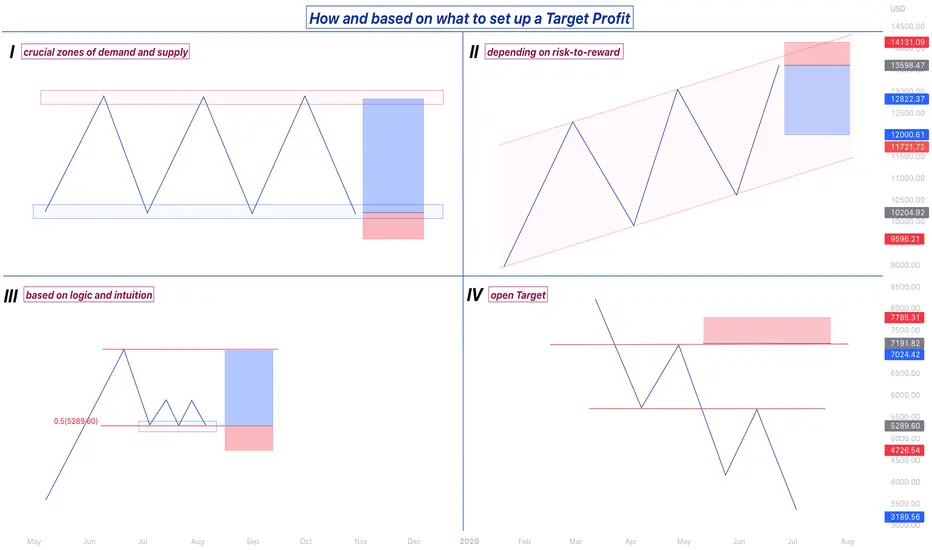
Different strategies of setting a Target ProfitSetting a Target Profit is an inalienable part of every individual's trading strategy, and each trader has his own plan and tactic of integrating a Target Profit into his or her trading style. While there are different ways and types of setting up a Target Profit, we are gonna go through four common and most well-known ones.
1. Key zones
Setting a TP at a crucial zone of support or resistance is a strategy used mainly by swing traders. If the market is ranging, buying a security at the lower barrier of the rectangular box and aiming for the upper barrier of it and vice versa is commonly implemented in the market by middle or long-term speculators.
2. Risk-to-reward
This technique is mostly utilised by day traders and it implies setting a fixed risk-to-reward ratio for every trade and use the "set and forget" logic. On the illustration on the top right graph, it can be inferred that even thought the price has more potential to drop to the downside, a fixed RR of 1:3 has been set.
3. Logic and intuition
The more you trade, the more experience you gain. After some time on the markets, you will easily spot some patterns and price movements in advance, without being in need to have more confluences than usual. On the 3rd chart, we can observe that the price is forming a "Triple Bottom" pattern on the 50% Fibonacci retracement level. Our intuition tells us that after some consolidations, an impulsive move should take place, and there is a high possibility for the price to keep rising and reach the zone of the Higher High illustrated on the graph.
4. Open Target
Lastly, there is a group of traders that prefers having an open Target Profit and letting their trades run for weeks or even months. This tactic is commonly used by position traders, where they set a Stop Loss, but leave their Target Profit open, making it possible for them to hold a transaction open for long periods of time.
INSTANT SUPPORT & RESISTANCE LINES USING FIBONACCIThis setup is for all traders in a genuine hurry, or ideally, for the novice trader who is unsure of where support and resistance lines should/could be placed. This idea cements a rough (but good) placement of support & resistance lines on your chart instantly by selecting the highs and lows with your Fibonacci retracement tool (once numbers below are exactly plotted in to the tool itself).
It's useful for all tradable assets and all timeframes. This example shows likely daily support and resistance zones.
Note the Fib numbers are to the left on the chart* - set your fibonacci up just like this and save as 'Instant Fib Support & Resistance' in your Fibonacci template for super quick and super easy support & resistance lines.
#Fibonacci #Supportandresistance #eduactional #educationalpost
*Numbers setup in Fibonacci retracement tool as:
1.875
1.75
1.625
1.5
1.375
1.25
1.125
1.0
0.875
0.75
0.625
0.5
0.375
0.25
0.125
0.0
-0.125
-0.25
-0.375
-0.5
-0.625
-0.75
-0.875
-1.0

How to remain consistent while trading the financial marketsToday is a big day for us, as two years ago, on the 6th of June in 2020, we launched our company in attempts to be a valuable contributor to the trading industry and help all types of traders: beginners, advanced traders, those who are lost in the journey and so on. However, our personal trading experience goes way back, as we have been trading for more than five years. Throughout this long and interesting journey, we have had many ups and downs. After all, nothing in life is easy, and you have to overcome some obstacles in order to become consistent in what you are doing.
Reaching the doors of consistency is the main aim of every beginning and practising trader. Although many individuals may think of consistency as an upward-sloping straight line, years of practice and experience show us that it is rather an ascending channel. Being consistent does not necessarily signify that every trading day/week/month must be a winning one. You will always have losing streaks, unsuccessful trades and so forth. Instead, it indicates that by having a working trading strategy and obeying it, you are gonna be profitable in the long run.
Below, we have listed and scrutinized some of the rules that you can implement in your trading that can give you a hand in becoming and remaining consistent:
1. Have a clearly identified trading plan and stick to it
This may seem like a pretty basic rule, but believe me, most people never go past this pretty fundamental stage. It is really straightforward and crucial that you need to have a backtested trading strategy, and it could be anything you feel comfortable with. Whether you like to open positions once two Exponential Moving Averages cross each other, or once specific patterns are formed and the price is ready to move according to your bias and so forth.
2. Stop changing your trading strategy every time you encounter losses and feel frustrated
Trading is a game of numbers. Yes, you will experience many losing days. Yes, you will feel frustrated and angry to the stage that you might smash the screen of your computer. After all, emotions and psychology play a huge role in trading. Believe me, changing your strategy every week and trying to do something new will never be an option in this case. I see many people make this mistake and get perplexed on why they are not profitable yet. The right thing to do is to stick to one single trading plan and ride along till the end. At the end, if you are risk tolerant and patient, you will always be profitable in the long run.
3. Manage your risk
This can’t be said enough. I see people trade the markets like a casino in attempts to be profitable and successful in the long run. Just because you think the setup is perfect, or that you have seen your favourite author’s technical analysis nicely align with yours, you should not be risking big portions of your account on a single position. You should have a well-defined risk management plan. Whether it is risking 1% on all positions, or risking 5% per position on Friday afternoons in order to drink lots of champagne on the weekends. Bottom line: whatever you do, do it with a plan and keep things consistent. Personally, we have always been risking 1-2% per single position, as this is something we are comfortable with. If you feel like you are not mentally ready to trade a live account, you can start even smaller (0.5% per trade) and then gradually go bigger.
4. Do not overtrade and learn to stay off the markets when necessary
Many people think that opening more trades will generate them more profits. However, less is always more, and quality will always be over quantity. Depending on what type of a trader you are and what your trading strategy looks like, there should be an average number of trades that you enter every day/week. If you are a swing traders that tries capturing nice long-term waves, 3-5 trades per week would most likely be more than enough. If you are a scalper that loves sitting in front of the charts for hours, your strategy would probably consist of entering 15-20 short-term positions per day. Long story short, have a predetermined range and do not go off the barriers of it.
The above stated points are some of the tips and strategies that could help you in remaining consistent in the markets. They may seem pretty simple, but remember that beauty lies within simplicity. There is no need to make things more complicated when you can simply stick to basic principles and succeed in this industry.
Have a great trading week, family!
Investroy

Three pillars of trading success 📈💲It's time for my mid week educational post.
Today I want to talk about the three pillars needed by all traders for success in the markets.
This isn't just the forex market either this applies to trading all financial markets.
Be it forex, crypto or stocks, so lets get into the the three pillars of success.
PILLAR NUMER ONE- STRATEGY
You MUST have an edge before entering the markets.
When will you enter the market?
When will you close?
What % per trade will you risk?
What pairs will you trade?
What timeframes will you trade?
If you don't have any answers to the above you are entering the markets blind and it will end in tears.
In trading, edge is your ability to select trades that perform better than random.
You can think of edge as the process used to generate and execute entry and exit signals.
Do not enter the markets until you are working a strategy with a proven edge.
The stronger your edge, the more profitable you’ll be.
PILLAR NUMBER TWO- RISK MANAGEMENT
We can't avoid the white elephant in the room on average 80% of trader lose money or fail in the markets.
Some say its even more and you will become one of the stats if risk management isn't applied to your trading.
Some of the reasons losses like these exist in trading is down to the fact that aspiring traders don’t put any thought into their risk management tolerance.
We only ever see the upside when we start out and many never do anything to protect themselves from potential losses.
If you never made any money as a trader before or entered the markets before ask yourself the question below before starting out.
How much money am I comfortable losing?
Your first priority with trading is to stay in the game
So manage your risk per trade and total risk at anyone time.
Understand probability and ensure you are comfortable with your maximum exposure at any one time.
Understand the maximal draw down in your testing when finding your edge.
That way it will help you see what a potential losing run you could experience.
PILLAR NUMBER THREE- TRADING PSYCHOLOGY
We need good trading psychology to keep a balanced mind whilst trading, this stops your emotions leading the trade.
The trade outcome cannot be controlled and you MUST detah yourself from each trade outcome.
You will know when your trading emotions are nailed on when you do not 'FEEL ' anything when trading.
If you have 'emtions' with your trades or when trading simply reduce your risk further.
Two emotions that need particular attention are GREED and FEAR.
You need discipline in controlling these two emotions or you are going to end up making losses as a trader.
We all been there we make a few profits confidence kicks in and then greed before you know it your in whole world of pain.
We all be there at some point with fear to and not executing trades due to a fear being in our trading game say from a poor run of form.
Emotions will always be there we are emotional beings, but they will need controlling in order for you to be a successful trader.
Practice developing the emotional control needed to trade successfully.
FINAL THOUHGHTS
Trading requires 100% commitment most see it as a hobby to start with but this can be costly hobby if commitment to trading is lacking.
The sole reason most get into trading is to make money. One purpose of a business is to make money.
Treat trading as a business at the end of the day it's your personal money that's on the line.
Every trader needs to have a disciplined approach to the markets. Following these three steps will help you.
In order to be a successful trader and run a profitable account, it is essential that you have these three pillars in your trading.
Thanks for taking the time to read my idea.
Darren 👍

What is stop-limit order?Hello to all members of TradingView and my followers.
I tried to explain the stop-limit order to you briefly in this post. I hope you enjoy it.
If it is helpful to you, please like it.
If you have a comment, I'll be happy to know.
Respectfully.

SMC - EDUCATION Invalid Demand Zone.!This Content is for Education Purpose only.!
Smart Money Concept (Invalid Demand Zone) as I mentioned in the Chart.!
Keep Supporting LIKE, COMMENT And FOLLOW.!
Thank You.!

4️⃣ Trading habits that have to go 👋We've all done it.
At some point in your trading journeys bad habits set in.
Here is my four trading habits you've got to kick in order to stay profitable.
1. Overtrading
We all been there with this one.
We think we have to be in the market all the time.
We don't and its okay to be flat at times.
No strategy should have excessive trade volume.
More time in the markets the more chance of catching a cold.
Overtrading can happen when we also start revenge trading.
You've caught some losses and your trying to get it all back.
Don't overtrading combined with revenge trading is a no no. Take a break.
Trading with no strategy or system
Should never be in the markets with out a plan or system.
More importantly no trader should be entering markets with out a proven edge.
Back test and forward test your strategy and make sure you are entering markets with a proven plan.
Psychology wise it makes trading so much easier to deal with.
No plan will lead to nothing but stress and losses.
No stop loss
Trading with no stop loss is biggest sin of all.
It's just not worth risking huge amounts of your trading capital on the line.
One big crazy move in this uncertain world could do damage.
Plus how can you develop a proven plan if stop loss is not included.
Also moving your stop loss should not be part of your trading.
As you've just altered any strategy being trading into the unknown category.
No risk management
So I've mentioned stop loss but that is only one element of risk management and it doesn't stop there.
Risk management includes many aspects you'll need to consider.
That includes position sizing relative to your capital size.
The psychology behind losing runs and how they are factored into your trading plan.
Work to set and proven trading rules as part of your risk management.
Be sure not to add to losing positions.
Know when you are wrong and move on to the next.
Failure to follow risk management means you will essentially be gambling.
Be realistic in expected returns is a big factor in risk management.
Sticking to all of the above and not allowing these habits to enter your trading will ensure you keep that trading account growing.
Thanks for taking the time to read my idea.
Darren 👍

The Rule of 72 😃📈Time for a educational post from me.
At some point as traders we have all had the thought of how long will it take to double my account.
The rule of 72 is the easiest way to work that one out.
The rule of 72 is a handy mathematical rule that helps in estimating approximately how many
years it will take for an investment to double in value at a specified rate of return.
Rule of 72: If 72 is divided by an interest rate, the result is the approximate number of years
needed to double the investment. For example, at a 1% rate of return, an investment will
double in approximately 72 years; at a 10% rate of return it will take 7.2 years.
But the example above is based on a 10% return per year.
We as traders have the chance if our strategy is consistent and profitable to return good percentages on capital in a matter of weeks.
Time for more examples.
Some traders can return 6% a month
So 72/6 = 12 months to double the invested capital in your account.
Lets say a trader returns 4% month on month
72/4 = 18 months to double your investment.
The rule of 72 servers two purposes to us as traders.
1. I personally feel it helps to keep us grounded as traders.
To many enter this game thinking they will flip 1000 into 10000 in a matter of weeks
A 4% return per month is a good return and from the equation above it would take 18 months to turn 1000 into 2000!
So I would like to think the rule of 72 acts as reminder of the challenges we face when it comes to expectations.
2. Having said the above the rule of 72 also serves as a reminder that as traders who do or potentially can go on and
achieve consistent profits especially monthly we can make way more returns than what a instructional bank or establishment would
offer to you as an investor. The rule of 72 then becomes an inspiration to take control of your own money game and aim for growth
that no one else can offer you.
Thanks for taking time to look at my idea.
Darren 👍

For Education💯💯This is how i using ict method to find my entry.
From my undertanding ,
at first price should retest to this FVG ( on the left side )( FVG is fair value gap )
to creat a small support then start rally down .
.
But price break through the small support .( You can see it cleary on 1m & 5m TF )
.
And my analysis for larger TF is telling me that the price should going up
,you can see it on my previous post.
.
Then we can start using ICT method to find our Entry.
.
For those who want to study ,it's on Youtube ict mentorship 2022 Ep. 12
.
Good Luck Trader 💯💯
.
.
.
🧅Disclaimer :There are risks associated with investing in securities. Investing in stocks, bonds, exchange traded funds, mutual funds, and money market funds involve risk of loss. Loss of principal is possible. Some high risk investments may use leverage, which will accentuate gains & losses. Foreign investing involves special risks, including a greater volatility and political, economic and currency risks and differences in accounting methods. This is Not Financial Advice
🧅JUST AN OPINION OF THE ONION.🧅

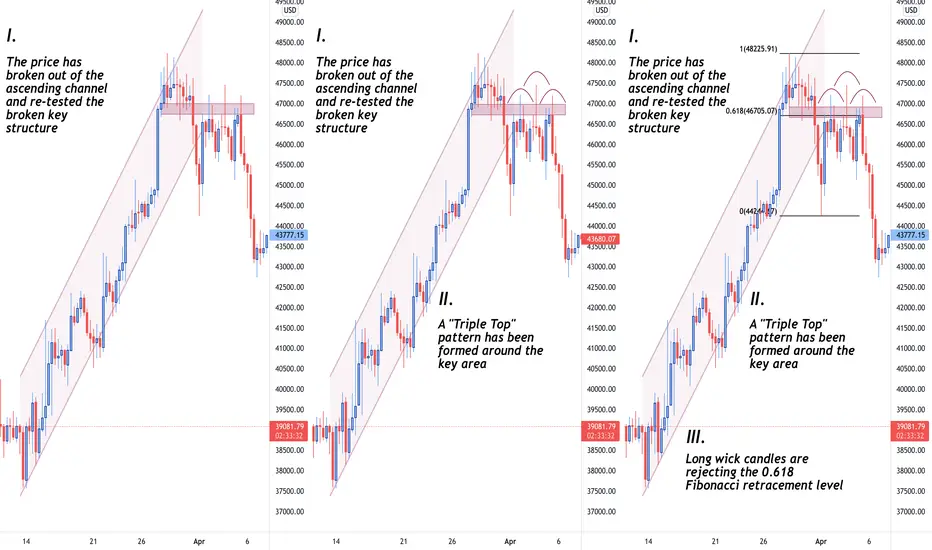
Power of Having Multiple Confluences in TradingThe more confluences you have, the more confident you are in the fact that your technical setup will play out according to the plan. Confluences come in different shapes and styles, whether it is combining some Moving Averages and Bollinger Bands with price action, or having your grandma flip a coin a decide the faith of Bitcoin.
On the graphical illustration that you can see on the screen, 3 confluences have been utilised to back up our idea and they are the following:
1) "Break + retest" formation
2) "Triple Top" pattern
3) Fibonacci retracement tool
It can be noticed from the left hand side of the screen, that the price has nicely broken out of the ascending channel and re-tested the local key structure. Moving to the next step, it can be emphasised that a nice "Triple Top" pattern has been formed. Lastly, we add another confluence to back up a possible scenario that we have eyes on by using the 61.8% Fibonacci retracement level, which is referred to as the "Golden Zone". Taking a look at the chart, we can clearly observe that long candle wicks are nicely rejecting this very zone.
All in all, combining multiple confluences give us enough confluence to back up our sentiment. However, nothing is 100% guaranteed in the markets, meaning that it is not promised that your trade will play out perfectly no matter how many confluences you have. Thus, be risk-tolerant, patient, and cold-blooded!
Have a great upcoming weekend, everyone!
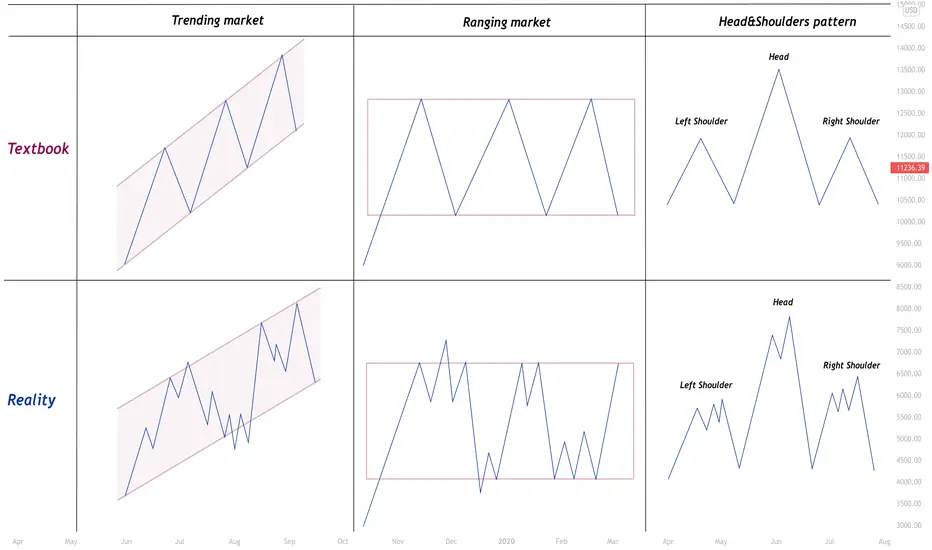
Trading in Books vs Trading in RealityWhat we study in the books is always different from what we have in real life. For example, French language that people learn and exercise in textbooks is slightly different from the French that we speak in France, as we tend towards using informal language and slang phrases. Same rule applies to trading, as the market is not 100% accurate with what we have in the books that educate us on trading. What we have in the books is absolutely crucial to learn the basics and even more. However, while applying the learned theorem in practice, in our case in the real-life markets, we notice that things are different. Thus, it is important to combine these two elements (on and off the market education) to master the craft.
Furthermore, beauty always lies within simplicity. What's written and illustrated in the books, is the most understandable language of trading. Hence, the expression "textbook stuff" exists. The more experience you gain in this field, the more you will realise that it is crucial to keep things super simplistic if we want to have a crystal clear vision of the market.
IGNORE THE NOISE AND NEGATIVE EXTERNAL ENERGYTrading is a one big system that consists of various different components: technicality, psychology, money management and so forth. The most difficult one out of all the elements is definitely psychology. Human psychology is a perplexing system that studies our mental process and behaviour. Our behaviour and mood rely on multiple internal and external factors. In our everyday life, our behaviour towards something can easily change when being affected by negative energy. The very same principles apply to trading. Our decision-making process can easily get fogged and mood get ruined after experiencing some losses, opportunity misses and so on. Even worse, our desire and will to keep trading and striving for success can get intercepted by some negative opinions and attitiudes of surrounding people.
It is totally acceptable to live a life that others do not understand. If you want something really bad, nothing can get in your way and stop you from achieving it. Block all the negative energy. Keep prospering, working towards your ambitions, and proving all the people that did not believe in you wrong!
Investroy

Educational USDJPYAfter a daily morning star formation as highlighted , I waited for a pull and waited for some rejection before going down on lower timeframes to find entry .

What Traders Want vs What Traders Get"It is a marathon, not a sprint". One of the statements that perfectly describes trading. But what does this proclamation really mean? I quote William Shakespeare: "Go wisely and slowly. Those who rush, stumble and fall". Great things take lots of time. 90% of all people get false expectations about trading before they enter the industry. They think it is a "get-rich-quick" scheme. In reality, it takes months/years of practice, hard work and experience to reach the doors of consistency and profitability. Furthermore, consistency in trading does not necessarily imply that every trade will be a winning one. It just indicates that if you keep following your trading plan, be risk tolerant and disciplined, you will be profitable and successful in the long-run.
We encourage you all to be patient and just ride with the trend as there is no need to rush anywhere. After all, Rome was not built in a day.
Hope you all enjoyed this quick educational and informative post! The purpose of this publication was to give you all some guidance and keep you motivated so you can continue your journey to the top of the mountain. If you have any more suggestions and recommendations on what our next educational idea should be about, feel free to let us know in the comments section below.
Investroy

HOW TO use asymmetric compounding 🧐📈The pair in question and four winning trades allows me to cover a subject I've wanted to touch on.
That subject is asymmetric compounding.
Asymmetric compounding is a money management strategy that can accelerate the equity curve of an account.
But you need the right strategy and data available to back up using asymmetric compounding.
Higher the win rate the more asymmetric will work wonders on that equity curve.
In simple terms asymmetric compounding is best suited to strategies with higher win rates as you need consecutive wins to make it work.
The main reason for using this NZDUSD chart is the four winners in a row make it easier to explain the concept of asymmetric compounding.
You traders should know the full ins and outs of your own strategies and if this can be applied.
It's not just win rate also RR along with max losing and max winning runs need to be factored in.
For this example on the four winning trades I am explaining the concept basing it on risking 2% per trade on the initial trade.
As this strategy is a 1:2 risk reward strategy risking 2% sees us gain a profit of 4% on one winning trade.
This is where you can then use asymmetric compounding on your next trade.
Instead of risking 2% again you now risk the 4% gained from the previous trade on this trade.
If the trade goes on to win the 4% risked on that trade has just earned 8% in profit.
At this point you go back to risking 2% on the next trade until you have a win and then risk the 4% gain from that winning trade.
The chart shows four winning trades at 1:2 RR so lets test the concept in numbers.
If we was to risk 2% per trade on a £1000 starting capital account the results are as followed.
Trade one 2% risked 4% gained= £1040 capital.
Trade two 2% risked 4% gained= £1081.60 capital
Trade three 2% risked 4% gained= £1124.86 capital
Trade four 2% risked 4% gained= £1169.85 capital
Now if we apply asymmetric compounding to the same trade sequence staring back at original 2% risk after two winning trades
Trade one 2% risked 4% gained= £1040 capital.
Trade two 4% risked 8% gained= £1123.20 capital
Trade three 2% risked 4% gained= £1168.13 capital
Trade four 4% risked 8% gained= £1261.58 capital
Using asymmetric compounding on these four trades see a capital increase of £91.73 more than just risking a flat 2%.
Below is an example of using a 1:1 RR strategy risking 1% per trade. If trade is a winner then risk 2% on the next trade which is the profit and the risk from the previous trade. #
If that trade wins go back to the intial 1% risk then risk 2% again if that trade wins.
This is a great concept to grow small accounts or even pass funded challenges as with the trades shown on the idea chart you would pass most prop firm challenges in two trades using asymmetric compounding.
However I can't stress enough you as the trader need to know you own risk appetite for this.
You also need to factor in how good your win rates and how often your strategy has seen winning runs that would benefit this concept.
One way to found out is to back test and forward test your strategy to see how asymmetric compounding could work for you.
Thanks for taking time out your day to read over my idea.
Ill see you on the next one 👍
Darren

Stop Loss hunting: the whole truth and the logic behind itGood time of the day, dear TradingView family! Welcome on another educational post by Investroy. Today we are gonna be talking about Stop Loss hunting. We will scrutinise what it is, how it happens and what's the logic behind it, and how to possibly avoid being "liquidated".
Have you ever had the price trigger your Stop Loss before impulsing all the way to your Target Profit and hitting it? If the answer is yes, then you have probably been a victim of Stop Loss hunts. But what is Stop Loss hunting? In simple terms, it is a strategy that forces some participants out of the game by driving the price to the level where they have set their Stop Loss orders. As we all know, retail traders always look for some sort of confirmations before entering a position. It can be a candlestick pattern, a moving average cross, a double top / double bottom formation and so on. They enter a position and set their Stop Loss a few pips above/below the local supply/ demand level . What happens 90% of the time is the price spikes up/down, hits the Stop Loss, liquidates so many positions and participants from the trade, and then continues moving alongside the trend. Why does it happen? Institutional traders know exactly what they need to do and which levels they need to buy/sell. Consequently, they set their buy/sell limit orders at places where they know retailers would set their Stop Losses, because they need to generate liquidity before jumping in the train. It does not necessarily signify that they track where retailers put their Stop positions, it is just they are more than sure which levels are crowded with Stop Loss orders.
We have prepared some examples in order to better elaborate on the issue and scrutinise how the case looks visually. Of course, these are only simple exemplars. It does not unquestionably mean that the price will always behave this way as the market conditions change quite often.
Looking at Example #1, we can see that the price spiked above the level of the right shoulder of the formed H&S pattern before continuing its downside movements. Now, which action do most retailers take once they spot these textbook patterns? They execute right away with their Stop Loss above/below the structure, which results in the positions getting wiped out.
Example #2 shows how the price spikes below/above obvious levels of support/resistance before continuing movements in the deliberate destinations.
Example #3 illustrates how obvious ascending/descending/sideways channels are, and how easy it is to get liquidated instantly, before the price carries on moving in the destined end.
How to avoid being eliminated? Well, you won't always be able to run away from Stop Loss hunting, but if you develop a proper working strategy against it, you will be able to identify possible zones filled with Stop Loss orders and avoid setting one around that area. If you are not gonna think long and hard about where you are gonna put your Stop orders, you will easily get eliminated in a sea of Stop Losses. Thus, think outside of the box and have patience before jumping in a particular trade.
Hope this educational idea is useful! If you have any comments or enquiries, do not hesitate to ask in the comment section below. Also, if you want us to make an educational post on a topic that interests you, feel free to drop your recommendations and suggestions in the comment box as well!
Have a great rest of the week!
Investroy

Trading Mountain: How to reach the top step-by-stepHey, family! Good time of the day and welcome on another educational post.
As we all know, the road that leads to successful and consistently profitable trading is a pretty difficult and long one. It takes years of hard work, patience, dedication, and experience to reach the top of the trading mountain. Many beginners make similar mistakes before starting their journey. They tend to have false expectations and a distorted vision of the big picture.
As it can be inferred from the graphical illustration, the mountain pattern connects dots and shows a realistic path of a successful trader to the top of the hill.
We all start somewhere, right? We start taking our first steps and making ourselves familiar with the thing we are interested in. In the example of trading, it can be the first YouTube video that we watch, a chapter of a book related to investments that we read, first chart analysis that we make and many more.
What comes next? We decide on the type of a trader that we are. Do you have enough time to sit in front of the charts for several hours and press BUY/SELL buttons, or you are busy 90% of the time and prefer having a portfolio full of long-term positions?
After we have decided what our strategy will look like, we build a trading plan around it and make it a part of our lifestyle. We identify our trade entry criteria, risk management plan and so forth.
Backtesting our trading plan is a vital part for the journey. It can take days, weeks or even months. However, it will be worth it at the end of the day, as it is crucial to link our strategy with the trading plan and find out how profitable it will be.
Executing, optimising, journaling. Where did I make a mistake? What could have been done better? What should I change in my trading plan? It is important to stick to one single trading plan and optimise it along the way.
Before trading with real money, it is recommended to open positions on a demo account with virtual money. Getting a hand of things, practising the market and gaining experience is important.
After having traded on a demo account for several consecutive weeks, months or even years, we can move to a real trading account. Demo account is completely different from a real account, both psychologically and mentally. Putting real money on the line is much harder than playing around with fake simulation money. Thus, it is advised to start with a small amount and get used to it before moving to larger sums of money and increasing the trading capital.
After everything is went through and all hills are climbed, the top of the mountain will be reached. Of course, being a professional trader does not necessarily signify that there will be no failing trades and the win rate will always be above 90%. Losing days, weeks and even months will always happen. However, as long as you diversify your portfolio, stay cold-blooded, disciplined, and follow risk management principles, you will be profitable in the long-run.

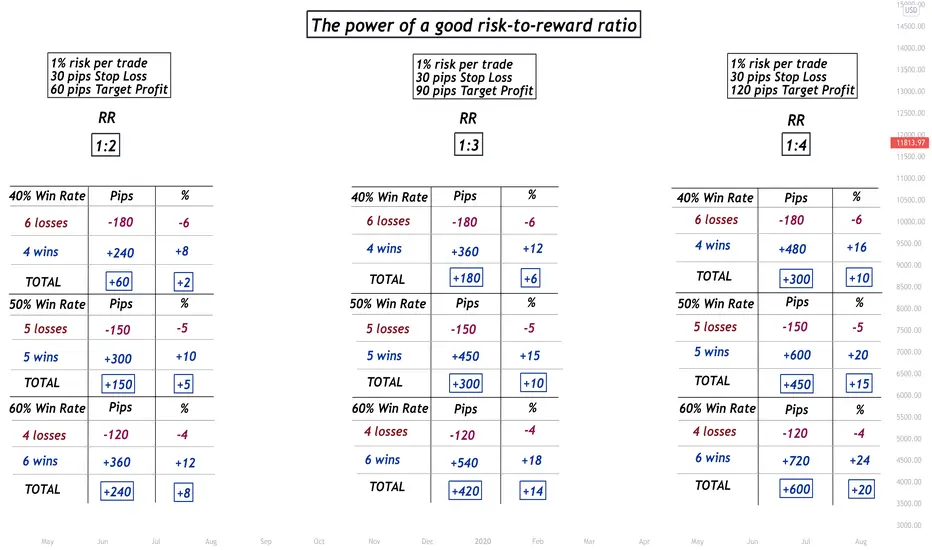
The Power of a good Risk-to-Reward ratio. Reality of tradingRisk Management, alongside with discipline, experience and skillset, is one of the keys to unlock the doors of successful and profitable trading. As it can be inferred from the table, even with as low as 40% win rate, it is more than possible to stay consistent and make nice returns, as long as risk management principles are followed.
*We used 30 pips Stop Loss and 60/90/120 pips Target Profits as a projection. It does not necessarily signify that 1% risk equals 30 pips Stop Loss, as different pairs have different pip values, price differences etc. Moreover, we determine our Stop Loss based on the amount of capital we are willing to risk on a particular trade, price action, intuition and other factors.*