Criteria that need to be met before entering a tradeHey, wizards! Happy Wednesday and welcome on another Educational Post for the week. Today, we are gonna be talking about trade entry criteria and checklist. In other words, what we should look for before opening a position.
First and foremost, we should analyse multiple timeframes and identify the direction of a specific market. As identified on the table, different types of traders examine different timeframes. The most common timeframes used by scalpers are M15, M5 and M1. H1 and H30 are popular among intraday type of investors, D1 and H4/H3 are commonly used by swing traders.
After analysing different timeframes and getting the overall picture of a chart, we start identifying various key zones. This could be support and resistance areas, supply and demand zones, Fibonacci retracement levels, descending/ascending trendlines and so forth.
After having identified crucial key levels, we start looking for more confirmations to backup our bias. Candlestick patterns (doji, hammer, engulfing), Top/Bottom/H&S figures, Indicators (EMA, RSI, MACD etc.) can be utilised as valid instruments to confirm our ideas.
All in all, going through the steps identified above are important before opening a transaction. In addition, remaining patient, keeping it simple, and following risk-to-reward principles are as equally important.
Educationalpost

The Art of setting a Target ProfitHey, wizards!
Happy 2022 and welcome on the first Educational Post by Investroy for the new year. Today we are gonna be talking about different ways of setting a Target Profit (TP), and scrutinizing the benefits and drawbacks of each. Though there are many ways to set targets, as it varies depending on ones trading plan and strategy, here are 3 of the most popular ways of placing a TP.
1)Confluence based
Reading the chart and analyzing different timeframes of a certain security, we can use different confluences to spot potential zones of price reversals. On the graphical illustration demonstrated on the chart, we can observe that a rectangular range has been formed and the price is sitting at the lower boundary, in other words at the crucial zone of support. It is highly likely that traders will start going long on this setup and anticipate for the price to keep rising and reach the area of resistance. On the other hand, it is never 100% sure that the price will be able to bounce off the local zone of demand, and therefore risk management should be strictly followed.
2)Risk-to-Reward based (Fixed)
The other name of this method is “set and forget”. One group of traders prefers to follow same risk-to-reward ratios for all positions opened (For ex. 1:2 or 1:3 fixed). Another group favors setting different RR ratios for different trades and let the positions run until they hit TP. All in all, the technique implies setting a certain RR Target Profit and letting trades run. On the figure displayed on the screen, it can be inferred that the sentiment of the market is clearly bullish and the price is expected to keep rising. One of the disadvantages would be the following: sometimes due to greed, traders set their targets too high and the price results in not reaching the intended TP.
3)Intuition/Logic based
As strange as it may sound, there is actually a number of traders implementing this approach when setting a Target Profit. Moreover, it requires experience to sense where the market is about to move. As illustrated and interpreted on the graph, the market repeats historical actions from time to time. Experienced investors tend to notice some specific patterns and make decisions out of it.

Risk Management: the Beauty and the Main Principles of itHey, magicians, hope you are all doing great and enjoying the holiday season! After receiving multiple requests from you, we are back with another Educational Post and the topic is the following: Risk Management and its Principles.
As we have already discussed in some of the previous educational posts, Risk Management, alongside with other componenets, is one of the most important elements that need to be followed in the world of Trading. If one wants to be successful and profitable in this journey, obeying the fundamentals of Risk Management is a MUST.
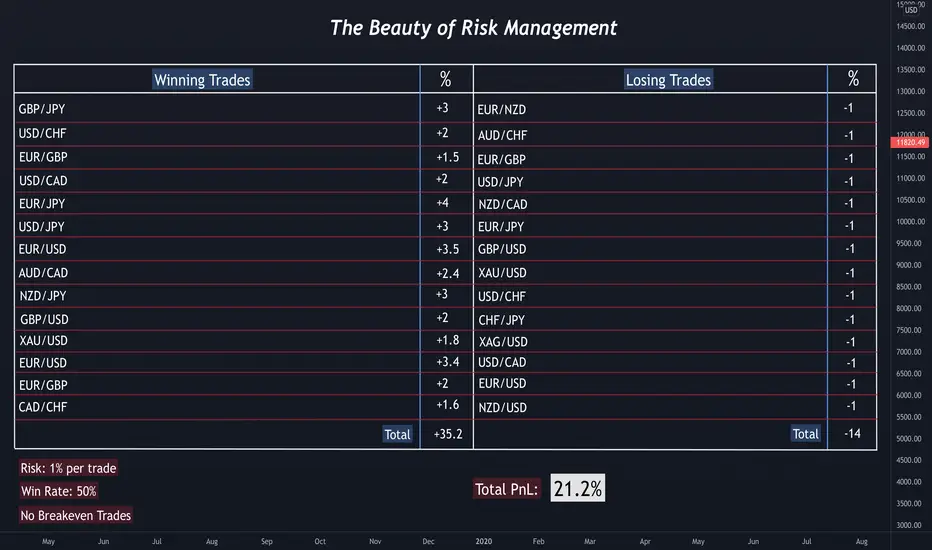
We have created a visual illustration which will explain how Risk Management really functions, and how one can be successful by implementing it in a correct way. In order to better understand the table, let us make the following assumptions:
-We are journaling our last 28 trades
-We have risked 1% on each transaction (trade)
-Our win rate is only 50%
-We do not have any BREAKEVEN trades, meaning we have left all our positions run open till TP/SL
As we can notice from the graphical illustration, most of the trades have different Risk-To-Reward ratios (for example: 1:3, 1:2, 1:1.8 etc.). With only 50% win rate, our Winning Trades will make us a nice +35.2% return, while the losing trades will set us back by -14%. If we do quick maths, we will see that the total return from our last 28 trades will constitute 21.2%!
There is no "Holy Grail" in trading, but following the principles of Risk Management can lead one to the door of consistency and profitability. Of course, Risk Management is not the only element, as psychology, patience, mindset, and some other factors should be considered and mastered as well.
We will be looking forward to covering other psychological aspects of trading in the next few educational posts! Until then, stay safe and happy, and if you have any requests or proposals, feel free to let us know in the comment section below!
Investroy would like to wish you all a Merry Christmas and a happy upcoming New Year!
Trading Myths vs Reality. Beginners, this one is for you!Hey, wizards! Happy Thursday and welcome on another Educational Post. The topic is the following: Myths and Reality of Trading.
As you may already know, there are so many false statements that beginners run into before starting their trading journey. Those statements are illustrated on the layout and interpreted below:
1) Most people think that trading is easy and they can quit their job or whatever they do and start making a living off trading straight away. In fact, in order to be profitable, consistent, and be a full-time trader in general, he or she MUST have a backtested strategy and be experienced enough in this sector. Remember that it takes a while to be successful, but it is fully worth it!
2) “Trading is like a casino”- we hear this one quite often. Only two types of people use this expression a lot: those who have never been able to become successful in this industry, and those that have no plan or idea about what they are doing. One should never open a positions based on a coin flip or what others are saying. Ideas and analyses of other can be used as a confluence and inspiration for a trader to open a positions on a specific security.
3) Whether it is trading or any other industry, one can never be rich over the course of a night. It takes 10-14 for someone to become a licensed surgeon, at least 6 years to become a professional lawyer. What makes you think that you will become a professional trader in just a few weeks or months?
4) No matter what the situation is, always use a Stop Loss to avoid deep losses. Whether liquidity hunt exists or it does not, it is always important to stay safe and sound.
5) Risk management is always more important than the win rate. Imagine having a 1:3 Risk-to-Reward ratio on your next 10 trades and the win rate is only 50%. That means you will win 5 and you lose 5. Now, let’s say that we decide to risk 1% of our total capital per trade. If we do quick maths, we will see that with only 50% win rate and 1:3 RR, we will result in making a juicy 10% return from the total of our next 10 trades. Of course, this is not always the case, as there are some factors that should be considered, such as spreads, fees, pip value etc. However, this is a perfect example to help you get the overall idea.
6) There is a big number of traders who do not like the “Retail Way” and would rather trade the “Smart Money” concept, which is apparently the closest thing that we have to the Institutional Trading. The bottom line is this: choose a strategy that suits you the best, and go with it while optimizing along the way. Changing strategies every week/month will not make one consistent. It is crucial that you stick with one trading plan and be loyal to it.
7) Many beginning traders tend to increase their risk in attempts to make more profits. This approach is so risky and totally wrong. If one is willing to make more money trading, it is important that he or she increases the input, and not the risk.

THE ART OF MULTI-TIMEFRAME ANALYSIS AND MULTIPLE CONFLUENCESHey, wizards, hope you are all having a great week so far! We would like to welcome all of you on another educational post, the topic of which is Multi-Timeframe analysis and multiple confluneces involved.
As it can be inferred, the Monthly and Weekly timeframes are used to determine the direction of the market, the Daily timeframe is used to identify key areas and important zones, and finally, the 4-hourly timeframe is utilized for entering trades. Now, let’s dig deeper into it and analyze the situation that we have on EUR/USD.
MONTHLY: Observing the weekly timeframe graph, we can say that the price has been printing bearish candles for a few consecutive weeks. As one of the main trading principles says, after a strong impulsive move, a correction is needed. We can witness some bearish weakening signs and therefore we are looking for a short-term long position. Our possible target would be set at a previous level of support turned resistance, which aligns with the golden Fibonacci zone.
WEEKLY: Leveling down to the weekly timeframe chart, we can see that the price is consolidating, as it is unable to push lower. Technically, after long lasting consolidations, it is believed that the price will either fly like a rocket or drop like a needle. This gives us another confluence and backs up our plan.
DAILY: Moving down to the daily timeframe graphic, we can notice that the previous candle was super bullish and some kind of an ascending triangle is being formed. If the price breaks and retests the upper boundary of the formed triangle, we can see some nice bullish moves.
4H: Last but not least, the 4-hourly timeframe a.k.a. the timeframe of entries. After a massive bullish push to the upside yesterday, the price has started correcting before further bullish moves happen. Here, we are using two entry confluences: the area of previously broken structure that nicely aligns with the 61.8% fibonacci retracement level. Before entering the trade, we will carefully monitor the price action and wait for the price to bounce off the local zone.
We are hoping that this educational post will be of value for you and we are wishing you all a great day!
Regards,
Investroy Team

Gold: 8 Factors You Must Know, If You Trade Gold8 Factors You Must Know If You Trade Gold
Gold has been a favorite of many for centuries. It's used as an investment and holds sentimental value all over the world.
Let's take a closer look into some factors that affect these changes: supply & demand dynamics between countries holding large amounts while wanting lower rates so they won't have trouble selling off inventories; economic stability decides whether there'll be.
Wh at Moves the Gold Price?
There are many reasons plays behind the gold price. Let's discuss some.
Supply and Demand
Demand and Supply are two forces that constantly affect the price of Gold. When demand for this precious metal increases, its value goes up too. When there's less interest in purchasing or holding onto it, prices will naturally decrease over time due to supply constraints. That means you can buy more at any given moment without worrying about getting stuck paying the total retail cost later.
Inflation
Gold has been a good hedge against inflation for many years. When prices go up in an economy, people tend to invest their money into Gold and not a currency. Because it's considered stable over time while maintaining its value even when currencies change significantly from one day or year-to-year ranking/rating changes due to economic factors. Such as high unemployment rates, which increase demand by consumers looking for safe-haven assets.
Central Banks Decision
Gold is typically bought in large amounts by governments and institutions who view it as an essential store for wealth preservation. But this can also mean traders take notice.
Central banks worldwide have recently been buying substantial quantities because they want to diversify their reserves away from US dollars which currently make up most international finance markets valued at close to $200 trillion (€170 T).
The result has already shown itself, with spot prices rising 6 percent higher than last year despite economic uncertainty following recent hikes on interest rates over America's quantitative easing program.
Interest Rates
Interest rates are the driving force behind Gold's price movements. When interest rates increase, people sell their assets to earn higher returns on existing investments. At the same time, at other times, they might buy back in if prices have fallen too far for them not to make up that loss with purchasing power today - this increases demand for precious metals like never before.
The relationship between these two economic indicators means different things depending upon one another. For example, when there is inflation (worst-case scenario), investors seek out safe-haven currencies such as Gold, which protect wealth against devaluation or hyperinflationary policies imposed by countries worldwide seeking currency stability through international agreements like SDRs.
Central Banks Reserve
The government holds a large number of gold reserves. Therefore, when most of the Reserve Banks worldwide start to buy Gold more than they sell. The gold prices increase because there will be insufficient supply in the future and vice versa when central banks sell greater quantity than it buys; therefore, these transactions result in currency rates against other currencies.
Currency Fluctuations
Gold is traded on the international market in US dollars. When you convert your currency from USD to any other currencies during import, it becomes more expensive as the price fluctuates concerning both currencies.
Let's compare prices between countries like the United States and Saudi Arabia, where one has a more robust economy than others do. There can be a hike of up to 30 – 50% extra cost for purchasing an item because these economies have been performing better over recent years, meaning they provide higher rates of return that give them power over minting new coins. In contrast, some country's revenue may only last one year before another recession strikes, making importing items not profitable anymore.
A co-relation with other asset class
Gold is a highly effective portfolio diversification because of its low negative correlation to major asset classes. In addition, when shares fall in companies, there's an inverse relationship shown between Gold and equities. This makes it easy for investors looking at their investments from either side to have peace of mind when they know that one goes down. Then others will likely recover - especially considering how much more stable stocks tend towards being over time than fluctuating prices do.
Geopolitical Factors
Gold has often been seen as a haven during times of political and geopolitical turmoil. During such periods, Gold does well compared to other asset classes due to an increase in demand from investors who won't keep their money away from unstable markets or currency values that could change at any moment.

Want To Improve Your Trading Game? Play Poker!In virtually any field of athletics it is advised that you should cross-train in order to both avoid injury and increase performance . For example, Football players are encouraged to take up pilates, yoga, and swimming. Runners can reduce injury and increase performance by incorporating Rollerblading, Barre, and Zumba into their routines.
So what should traders do in order to "cross-train" that will make them better traders, to help them "avoid injury" (as in lose money ) and "increase performance" (as in make money )?
My answer: Play Poker!
Yes, Poker and Trading are both "sedentary" activities where you are sitting at a desk or table. It is the brain that needs to be toned, limbered up, and made flexible, not the body. (Though you need to make sure your body is healthy too!) So it is safe to say that the peak performance trader needs a mental cross-training routine, not necessarily a physical one.
So why is Poker the ideal cross-training exercise for traders?
1: Poker Teaches Risk Management
Unless you're a novice or not seriously playing in a virtual poker App, there's little chance you will go "All In" at the poker table. I can count on one hand the number of times I went "all in" and I won every time. Such opportunities rarely happen. When I did move my pile of chips to the center of the table it was because I knew what was in my hand. I "managed my risk". Likewise, the trader or investor should almost never go "all-in", putting their entire account into asset X, Y, or Z because "the market will market" on you and you will lose it all. In trading terms, you can very easily "blow up your account."
As Kenny Rogers says, "You've got to know when to hold'em... and know when to fold'em."
Good risk management requires that even if you lose say, 5 times in a row, you will live to trade another day. I frequently talk about never risking more than 1% of your account on any single trade . A 5% loss is easy to recover from with two 3-R wins, or one 7-R win. Likewise in poker, with a $100 buy-in, you usually have $1 antes, allowing you to play up to 100 hands (even if you were the worst poker player in the world) risking only 1% per hand.
In poker, only if the "odds are in your favor", that is, you have two-pair, or you have three or four-of-a-kind, or a straight, would you consider raising the stakes to 2, 5, or even 10% of your bankroll. If you can make 20R from a 4R "risk" with the odds in your favor, you are now thinking like a professional trader where Risk Management is "Job One".
2: Poker Teaches Emotional Management
I like to teach that our goal as a trader is to be totally mechanical - totally rules-based. Our goal is to "Trade like a Vulcan" or "Trade like Spock: Trade long and prosper!" What's the poker analogy? Having a " Poker Face ". Or as the old antiperspirant commercial said, "Never let'em see you sweat."
We may have an awesome hand, but we can't display a "woo-hoo" face because no one will bet against us. We may have a terrible hand, but we can't put up a "oh, good grief!" face and let others know that they have even the slightest chance of beating us. We have to play every hand waiting for the last card drawn (the river) because that last card can make or break what we are holding in our hand. And very often it is that last card dealt, "the river", that can make or break a poker hand.
3: Poker Teaches You to Play the Probabilities
Growing up in Brooklyn, New York, I remember the famous slogan from the New York Lottery: "You gotta be in it to win it!" They threatened (coerced?) every New Yorker with "fear of loss" if they didn't play the lotto... "Well, yeah, we all know the odds of you winning are are actually close to zero, but of you don't play then they really are zero so you better play or you will feel more like the loser than you already are!"
Thankfully, the odds in winning at Poker are much higher than winning a set of numbers printed on ping-pong balls, which teaches you that when you have an "edge"... when you have a "system" that has the odds in your favor (a winning trading system) you can't try to outsmart the system – you need to play every hand that meets the criteria of your system.
As hockey great Wayne Gretzky said, "You miss 100% of the shots you don't take." So as Poker players and as traders, we have to play every hand, or every trade that appears that meets our trading plan's criteria, otherwise if we try to "outsmart the market" we will lose every time. And more often than not, even with a terrible hand, say a 2 and 4 of spades, you might find that if you don't fold, every once in a while three spades will appear on the table giving you one of the high-probability hands: the flush . So play every hand . And in trading, take every trade opportunity that appears that qualifies under your rules-based trading system.
4: Poker Teaches You To Stay Humble
My poker buddies and I play every month or so. Early in my tenure when I learned to play poker I realized "Hey, I'm pretty good at this.... I'm gauging the probabilities, I'm keeping my risk-per-hand low, I'm taking small profit after small profit and leaving with twice the money I bought in for or more. Drinks are on me!"
Then I got cocky... Walking into game four I thought to myself "I'm the Vulcan, emotionless, rules-based, odds-calculating poker player, right?"
And that night my proverbial hat was handed to me.
It was one of the worst games I'd played to that point. I over-bid, I bluffed (something I had never done before and my opponents knew it!), and I raised bets on hands I know I should have folded. I re-bought in after losing my original buy-in and lost all of that! And I went home with a valuable lesson: Don't think you can out-smart the probabilities.
The reason we win at poker is the same reason we win at trading. We must always play the odds, we must never play the low probability hands, we must always keep our emotions get the best of us, and when it's time to fold, it's time to fold!"
Last week our poker group met again. I bought in for $50 and left with $135. In trading parlance, that was a 170% return. I was grateful. I learned my lesson. I've got to stay humble and let the hand come to me, let the trade come to me, and never think I can out-smart the table or the market.
5: Poker Teaches You To Set a Financial Target
One of the reasons that casinos give their players free drinks, free upgrades to already expensive suites, and free food is they know that "the more you play, the more you'll pay." You can be up $5,000 for the night, then go get yourself some free lobster tails paired with filet mignon, a bottle of wine, and a decadent dessert. Then you return to the tables all fat, happy, and lubricated and proceed to hand all your winnings back to the House.
I know more than one poker player who has a rule: "When I double my money, I'm done . I may walk in with $500, and when I'm $500 to the positive, I quit and go on to enjoy the rest of my night, otherwise I'll just give it all back."
Similarly, I know many a trader (yours truly included) who may have been up a sizable amount wonderfully early in the trading session, then proceed to give all those winnings back to the market an hour or so later. Setting a daily "win" will prevent you from getting mentally "fat and sassy" where you will become overconfident and then hand your winnings back to the market.
As a Poker player, you may want to make a certain amount of money per game. As a trader, you might want a daily amount of "R" or dollar amount to the positive. In either case, when you hit your goal, even if it's in the first 20 minutes of the trading session you need to close all open trades and enjoy the fact that you did what 90% likely did not do that day: end the day in the green! On other words, "Quit while you're ahead!"
6: Poker Player Are Part of a Vibrant Community Full of Fun People!
Like traders, the number of people who are committed to improving their poker game are few. We need to belong to a strong community of passionate poker players to perfect our craft just as we need to belong to a strong community of passionate (and profitable) traders in order to continually perfect our skill at taking money from the markets each and every day. There are online poker communities you can join (think: Simulated Trading) and there are global in-person Poker communities that can link you up with other players once you're ready to "go live". These communities are generally free to join and will help you build up the skill to become a proficient and profitable Poker player which, more importantly, will help you become an even more proficient and profitable trader.
Is there anything else about Poker that you think needs to be added to the list? Leave a comment below.
As always, Trade well! (And maybe I'll see you at the table!)

The biggest “MYTH vs REALITY” in tradingDear traders, happy Friday and welcome on our Educational Post for this week.
Today we will be talking about the most popular myths in the trading world and compare it to the reality. “99.99% win rate”, “50 trades winning streak”, “100% monthly return”. Do these phrases sound familiar? All of us have come across people and companies promising that they accomplish the above stated proclamations GUARANTEED. These individuals tend to deceive the beginners and sell them a fake dream. However, trading does not work like that.
If we take a look at the chart, we can see the 4H timeframe graphic of GOLD. We decided to use this graph to illustrate the idea. On the left hand side of the chart, we can see an example of the strategy that the above stated type of individuals use to deceive a huge mass of people. Fake and unrealistic risk-to-reward ratios, impractical percentage returns and other tricks appeal the newcomers and lead them to the mousetrap set by the so-called “gurus”.
On the other hand, on the right side of the screen, we can see the reality of trading.
Not every trade will be a winning one. The most important thing is to follow the principles of risk management, have patience and discipline!
We hope you enjoyed this educational post! If you have any proposals on what should our next educational post be about, please feel free to write down the topics of your interest in the comment section below.
Investroy team is wishing you all a great upcoming weekend!

How to Use Fibonacci Retracement ? hello traders , today i'll talk abouut my favourite tools
the Fibonacci retracement tool is extremely useful and it help us to find the strong resistance and support area ( 0.618) .
How to use it :
Drawing Fibonacci retracement levels is a simple three-step process :
In an uptrend:
Step 1 – Identify the direction of the market: uptrend
Step 2 – Attach the Fibonacci retracement tool on the bottom and drag it to the right, all the way to the top
Step 3 – Monitor the three potential support levels: 0.236, 0.382 and 0.618
In a downtrend:
Step 1 - Identify the direction of the market: downtrend
Step 2 -Attach the Fibonacci retracement tool on the top and drag it to the right, all the way to the bottom
Step 3 Monitor the three potential resistance levels: 0.236, 0.382 and 0.618
In the next post, I will explain more about The golden ratio and how to use it in entering and exit .
for more educational ideas , signals and analysis follow us .

Trade like a casino! 🎰🎲💵Yep you heard me right you need trade like a casino 🎰
Key bit here is trade like the casino operates their business model.
Don't trade like the clients that frequent the casinos.
Why should you trade like a casino?
Profitable traders understand how casinos are successful.
Casinos are profitable and make money because they have an edge which they let play out.
They know probability is in their favour.
How many times have we all been at a roulette table thinking we have a 50% chance of winning betting on red or black.
We all seem to forget about that green zero on the table and here in lies the casinos edge.
With having an edge they let play out it's impossible for them not to make money.
The casino is comfortable with every outcome on the bets placed knowing the edge will play out.
Losses are seen as a cost of business, risk is controlled and emotions to are in check.
This is why the house always wins! 🎰🤑
If you as a trader apply the same logic's to your trading strategies the end results will be the same as the casino.
If you choose to trade like one of the clients in the casino with no fixed rules you essentially are gambling with you trading.
Subjectivity and emotions will come in to play.
Random winning and losing runs will occur which will impact trading psychology.
This way of trading will only end in one way and that's by giving everything to the house or in this case your broker!
Development of a strategies with proven mathematical edges ensures you will become the house 🏦💰
Once an edge is established trust your strategy and let that edge play out.
-----------------------------------------
Please hit the 👍 LIKE button if you like my ideas🙏
Also follow my profile, then you will receive a notification whenever I post a trading idea - so you don't miss them. 🙌
No one likes missing out, do they?
Also, see my 'related ideas' below to see more just like this.
Thank you.
Darren

A lesson in Revenge Trading"Cut your losses short, but let your winners ride!"
We have heard that quote, one and a million times, it's one of the first things you hear when you start trading, a quote almost as known as
"Buy low, sell high"
And why is it so important and so widespread?.
The reason is pretty simple: You need to make more on your winning trades, to compensate all your losses and still make a profit.
Sounds pretty simple right?
Your win ratio and Risk to Reward are your most important stats,
Well it's easier said than done, and today I learned something about that coupled with revenge trading.
But what is revenge trading?
It's as simple as looking to make quick profits in a quick and aggressive way, after suffering losses, revenge trading also involves forgetting your own trading rules and risk management.
Anyone experienced trader can tell you the same, revenge trading is one of the worst things you can do and one of the fastest ways to losing your ENTIRE ACCOUNT
You can wipe out, months and even years, of savings and trading profits in a manner of hours or even minutes.
So when you take a loss, you should step away for a while, review what you are doing and get back in the game with a clear head.
In this case, I didn't take losses, I actually did make some profits
BUT I was angry that I didn't make all the profits from the top to the actual bottom.
So I revenge traded, even though I was up quite well in the day.
Instead of even following my own earlier analysis (linked below) I decided that the best way to make quick profits, was by trying to time the absolute bottom and get a high leverage long in there.
Not only I was increasing the leverage I was also increasing the risk, by trading against the trend and trying to time the exact moment the market reversed.
I didn't manage as you can see in the chart.
The lesson is pretty simple: Don't ever revenge trade and don't let good trades that weren't perfect enough make you become irrational.
I could have pretty good profits today, but I let myself become my own worst enemy.
ALWAYS PRACTICE RISK MANAGEMENT, RISK MANAGEMENT IS VITAL TO TRADING

KOTAKBNKPOSITIONAL LONG VIEW IN KOTAKBANK
KOTAKBANK STRONG SUPPORT ZONE 1760 CLBS
UPCOMING DAY SEE TGT 1840 1880 1940 +++

MY MORNING TRADING ROUTINE - Steps I take before I tradeComplete Routine:
06:30: Wake up – My Morning Routine Starts
I just get right up and start my day. Don’t hit the snooze button!
06:40: What’s My Daily Report Card Goal?
Each day my trading journal includes a specific goal that particular trading session, concrete actions that I’ll take to achieve that goal, and self-evaluation at the end of trading to gauge my success in reaching that goal.
The idea is to never trade without consciously working on some aspect of my trading.
06:50: Risk Control Process
I define the risk for the day :
Position sizing guidelines
Per-trade loss limits
Per-trade price targets
Daily loss limits
07:00: Frame The Context
I do a quick scan of my markets, and I frame the context by doing my analysis and establishing potential directional biases. This doesn’t take me a long time since I build upon yesterday’s analysis.
07:20: Define Market Conditions
Here I start by asking myself two questions:
Should I or shouldn’t I trade?
If I do trade, whether to do so cautiously or aggressively?
And then, I go through some variables to understand the market environment
07:30: Identify/Look For Setups
Now I understand what I want to improve on, my risk profile, market context, and how the market moves (the environment; fast, slow, etc.?)
I have specific setups and plays that I love to trade; I wait patiently for these setups to develop. Usually, they develop during London Open, but if there’s a setup at this very moment, I take it and immediately go into my breathing and meditation.
07:50: Deep Breathing + Meditation (Mental rehearsals)
This is where I get my mindset right. Breathing and meditation help me be and sustain a state of calmness and staying focused.
08:40: Cold Shower
Cold showers are amazing; they fill me with energy and the concentration to stay fully immersed in the present moment while I trade the markets.
09:00: Trade The London Open
I’m fully ready and confident to start my trading day. I’m focused, calm, and immersed in front of the screen.
Why We Need Routines:
As traders having routines in our life that encompasses all our desired best practices and habits is key to sustain consistent performance day in and day out in the markets. Trading is hard, and having to maneuver the world of trading without any routines or systems in place, is really doing yourself a disservice. Routines make your life easier. They reduce stress because you don’t have to think about what to do; your brain and body already know what to do because of the patterns you’ve set in place! This is quite amazing and really powerful; therefore, seek to build a routine to facilitate your trading performance.

how to risk smartly? position sizing, risk n reward, SL n TP 👌Risk refers to the probability of a negative event happening in your activities; an event that goes contrary to your intended outcome. Risk is part and parcel of the cryptocurrency trade. It is the chance of an undesired outcome on the trade, which translates to making losses. For instance, a 50% risk on a short position simply means that there is a 50% probability that the Bitcoin price will rise, resulting in a loss on your part.
Today, we take you through the simple rules to follow when managing risk in crypto trading.
Types Of Risk
The crypto trading world is exposed to four main types of financial risks:
Credit Risk
This risk affects crypto projects. It is the probability of the parties behind the crypto project failing to fulfill their due obligations. Credit risk is mostly attributed to theft and fraud in the crypto market. A good example is the hacking of Binance in 2018, which led to over $40 million loss.
Legal Risk
Legal risk refers to the probability of a negative event occurring with respect to regulatory rules. For instance, a ban on cryptocurrency trading in a specific country. A practical example of legal risk is when the states of Texas and North Carolina issued a cease-and-desist order to Bitconnect cryptocurrency exchange due to suspicion of fraud.
Liquidity Risk
Liquidity risk in respect to crypto trading refers to the chance of a trader being unable or incapacitated to convert their entire position to fiat currencies (USD, YEN, GBP) that they can use in their every-day spending.
Market Risk
Market risk refers to the chance of coin prices moving up or down contrary to your desire in an open position.
Operational Risk
Operational risk is the chance that a trader is unable to trade, deposit, or even withdraw money in their crypto wallets.
Main Risk Management Strategies
The rule of thumb in crypto trading is: “Do not risk more than you can afford to lose.” Given the gravity of risk in crypto trading, we generally advise traders to use not more than 10% of their budget or monthly revenue. Also, trading with borrowed money is not advisable as it puts them in a credit risk position.
Risk management strategies can be broadly categorized into three: risk/reward ratio, position-sizing, as well as stop loss & take profits.
1. Position Sizing
Position sizing dictates how many coins or tokens of cryptocurrency a trader is willing to buy. The probability of realizing great profits in crypto trading tempts traders to invest 30%, 50% or even 100% of their trading capital. However, this is a disruptive move that puts you at serious financial risks. The golden rule is: never put all your eggs in one basket. Here are three ways to achieve position sizing.
Enter Amount vs Risk Amount
This approach considers two different amounts. The first involves money you are willing to invest in every single deal. We advise traders to look at this amount as the size of each new order they take, regardless of its type. The second involves money at risk, i.e. the money that you stand to lose in case the trading fails.
This is how you define your enter amount:
A = ((Stack size * Risk per Trade) / (Entry Price – Stop Loss)) * Entry Price
Let’s say we wish to purchase BTC with USDT with a target of $13,000. Our parameters would be:
Stack Size: $5,000
Risk per Trade: 2%
Entry Price: $11,500
Stop Loss: $10,500
Our enter amount would be:
A= ((5,000 * 0.02) / (11,500 – 10,500)) * 11,500 = 1,150
The ideal amount to invest in this deal is $1,150 or 23%. However, due to our Stop Loss, we only risk 2% as it will stop the trade once it reaches the determined level.
Risk trading in cryptocurrency
Elder’s “Sharks” and “Piranhas”
This concept of position sizing relates to diversifying your investments. Dr. Alexander Elder, who is credited with the concept, suggests two rules:
Limiting every position to 2% risk. Elder compares risk to a shark bite. Sometimes you would wish to risk a huge amount, but the risk would be huge and catastrophic as a shark bite.
Limiting trading sessions to 6% per session. In a losing streak, you may end up spending everything you own little by little. Elder compares this risk to a piranha attack, which takes small bites of its victim until it consumes it all.
Following Elder’s sharks and piranhas approach results in no more than three open positions per 2% each or six ones per 1%. Limiting results in reverse compounding; losses get smaller and smaller with each subsequent loss you make.
Kelly Criterion
The Kelly criterion is a formula developed by John Larry Kelly in 1956. It is a position sizing approach that defines the percentage of capital to bet. It suits long-term trading.
A = (Success % / Loss Ratio at Stop Loss) – ((1 – success %) / Profit Ratio at Take Profit)
Using the previous example, the features would be:
Stock size: $5,000
Invested Amount: $1,150
Success %: 60%
Entry Price: $11,500
Stop Loss: $10,500
Loss Ratio: 1.10
Take Profits: $13,000
Our result would be:
A = (0.6 / 1.10) – ((1 – 0.06) / 1.13) = 0.19
This means you should not risk more than 19% of the entire capital of $5,000 for you to arrive at the best possible outcome in a series of deals.
2. Risk/Reward Ratio
The risk/reward ratio compares the actual level of risk with the potential returns. In trading, the riskier a position, the more profitable it can get. Understanding the risk /reward ratio enables you to know when to enter a trade and when it is unprofitable. The risk/reward ratio is calculated as follows:
R = (Target Price – Entry Price) / (Entry Price – Stop Loss)
From the previous illustration:
Entry price: $11,500
Stop Loss: $10,500
Target price: $13,000
Our ratio would be:
R = (13,000 – 11,500) / (11,500 – 10,500) = 1.5 or 1:1.5
A ratio of 1:1.5 is good. We advise traders not to trade with a ratio lower than 1:1.
3. Stop Loss + Take Profit
Stop Loss refers to an executable order which closes an open position when a price decreases to a specific barrier. Take Profit, on the other hand, is an executable order that liquidates open orders when the prices rise to a certain level. Both are good approaches to managing risk. Stop Losses save you from trading in unprofitable deals while Take Profits let you get out of the trade before the market can turn against you.
You can make use of Trailing Stop Losses and Take Profits which follow the rate’s changes automatically. Such a feature, however, isn’t available at the majority of crypto exchanges. Fortunately, with crypto terminals like Superorder, you can set your Trailing Stop Losses and Take Profits right from the terminal.
Winning Strategies
Accept Failures
Risk is part and parcel of trading. Besides, we cannot eliminate it but only manage it. You should, therefore, accept your losses and rely on plan-based decision making to realize profits in future trades.
Consider Fees
New traders often do not know the fees that come along with trading. Such include withdrawal fees, leverage fees, etc. You should consider these in your risk management.
Focus on the Win Rate
Risks will always be there to discourage you from trading. However, focusing on the number of times you win helps to develop a positive attitude in trading.
Measure Drawdown
This refers to the total reduction of your initial funds after a series of losses. For instance, if you lost $1,000 from $5,000, your measure drawdown is 10%. The higher the amount, the more you would need to inject into a trade for it to recover. As Dr. Elder advised, stick to a 6% risk limit.
Please click LIKE button and Appreciate my hard work.
Must follow me for latest crypto real time updates.
Thank you.

Risk per unit (R) & ExpectancyIn this article, we will expand the notions presented in the first part of the series. If you haven’t read the first part, you can check it out below in our related ideas section.
We define risk as to how much you’ll lose per unit of your investment if you are wrong about the position. We called this in the first part initial risk (1R) . All your profits and losses should be related to your initial risk.
Example 1: You buy a stock at $100 and decide to sell it if it drops to $80. What’s your initial risk?
The initial risk is $20 per share. So, in this case, 1R is equal to $20. If you buy 10 shares then your total risk is $200. R represents your initial risk per unit.
Example 2: You want to do a foreign exchange trade with a $10k account, selling the EURUSD. Let’s say that $100 USD is equal to 77 Euros. The minimum unit you must invest is $10,000. You are going to sell if your investment drops by $1k. What is your risk? What’s 1R for you?
It may sound complex, but it is very simple. If you’d close your position if it drops $1k from $10k to $9k, then your initial risk is $1000 and that is equal to 1R.
R represents your initial risk per unit.
Let’s say that you have noted on your trading journal the following trades:
1. 400 CSCO at $23 - R $1000 - P&L $2,317
2. 80 IBM at $80 - R $1000 - P&L ($813)
3. 300 VLO at $50 - R $1000 - P&L $3,413
4. 400 HRB at $51 - R $1000 - P&L ($1,531)
The R multiples for these trades are:
1. 2.32 R
2. -0.81R
3. 3.41R
4. -1.53R
The average R for your system is: 0.84R
Expectancy really refers to the mean (average) R-multiple of your system. As a trader, if you want to be successful you need to start quantifying your trading performance. You should always calculate your R-multiple and it’s average (expectancy).
The expectancy of your system is the average of the R-multiples (both positive and negative) of your system . It tells you what you can expect in terms of R, on average over many trades.
This information is pretty straightforward and easy to grasp. In our example above if we have a system with an expectancy of 0.84R and we risk 1% per trade we should expect a profit of 0,84% per trade. After 100 trades you should be up 84%! The average however is not the total picture!
To understand how much your system can deviate from the expectancy, you must not only know the average R-value, you must also know the variability of R or standard deviation. The variability will tell us how far away from the mean most samples are likely to be. It would be great if all samples were at mean, but this is never the case because it would mean that there is no variability to the sample.
Now you truly understand why the 3rd and 4th golden rules that we mentioned in the first article are very important!
Trade with care.
If you like our content, please feel free to support our page with a like, comment & subscribe for future educational ideas and trading setups.

New Project Could be next "Money Maker""NFT token" seems to be a good project, connecting digital and conventional artists to the blockchain. Could be the next money maker. At the moment the prices are volatile but a little investment in this can be done at this point. at the time of writing price of NFT is 0.0000034990 usdt.
Not financial advice. Should invest at your own risk..!!!!

XAUXAG - Gold/Silver Ratio! XAUXAG - Gold/Silver Ratio!
Question I get asked: Why do you look at the XAU/XAG?
Simple answer: Measuring the strength. Which metal has a greater R/R potential and that's been silver. Now personally I am much more bullish Silver since last yr march, given analysing the market of both gold and silver, which I stated this in my year ahead video outlook for 2021. (Message privately if you'd like access)
I favour Silver for buying opportunities due to adding confluence analysis the XAU/XAG ratio
I do this with currencies (E.g EURGBP), cryptocurrencies (E.g ETCBTC) and many other assets.
Key Tip: The trend is your friend, until it's broken.
Have a great day ahead.
Trade Journal
(For educational purposes, not investment advice)

Introduction to Dow TheoryThe Dow Theory is the core of contemporary technical research. Its premises have stood the test of time and underpin the study of market behavior research. The basic principles of Dow Theory and their importance in today's markets will be discussed in this article.
Origins and History of the Dow Theory
Many of the early studies that contributed to what is now known as Dow Theory is credited to Charles H. Dow. Dow's successor, William P. Hamilton, continued to establish and organize many of Dow's initial early publications, including the Wall Street Journal editorials written at the turn of the twentieth century. Robert Rhea, a Hamilton student, was later responsible for categorizing, refining, and formal codifying Dow's fundamental principles, which were set out in Rhea's book The Dow Principle.
In 1884, Dow reported an 11-stock stock market average, which he later extended into a 12-stock Industrial Index and a 20-stock Railroad Average. Instead of attempting to gauge market activity by individual stock movement, Dow decided to build an index of stocks that would better represent the aggregate action of the markets. The averages' movement was intended to serve as a barometer of the overall business environment. Since then, the 12-stock Industrial Index has morphed into the Dow Jones Industrial Average, which now contains 30 stocks.
Market trends according to Dow Theory
Robert Rhea explains in this book that three distinct patterns are considered to prevail in the market according to Charles H. Dow.
1. Primary trend – that lasts from months to years
2. Secondary reaction (intermediate trend) – weeks to months in duration
3. Short term trend – days to weeks
The Primary trend
The primary pattern is by far the largest, and it is typically predicted to last months to years. Main trends, according to Rhea, are less vulnerable to distortion and therefore provide a more accurate indicator for investment decisions. There are 2 types of primary trends: primary bull trend and primary bear trend . An uptrend is described in Dow Theory as a series of successively higher highs and lows. The concept "downtrend" refers to a sequence of lower highs and lows.
Primary trends have 3 phases. A primary bull or bear trend consists of these 3 phases:
a) Accumulation phase
b) Trending phase
c) Distribution phase
Accumulation usually happens after a sharp and fast drop in values, usually as a result of companies releasing extremely negative results. At this point, the uninformed market participants are normally incredibly bearish, selling whatever shares they have left at any amount. Market investors who are well informed and trained continue to buy shares at incredibly low levels.
The uptrend and downtrend phases make up the trend process.
After a sustained and dramatic rise in prices, distribution usually occurs. Both newspapers and news reports are extremely bullish, and businesses appear to outperform. Uninformed market traders are prone to being too bullish, buying up whatever shares are available in the market at any expense, a condition known as excessive exuberance. Margin debt is at an all-time high. During the distribution process, smart investors begin to liquidate shares steadily, taking care not to push down rates too fast so that they can continue to sell at higher prices.
The secondary trend or reaction
The secondary trend or reaction moves or reacts in the opposite direction of the existing primary trend. It normally lasts a few weeks to three months, but it can last a little longer in some cases. The secondary reaction typically retraces one-third to two-thirds of the spectrum of the primary trend. Any retracement or reversal of more than two-thirds of a percent on big volume typically suggests that the secondary response is a new primary bear market. Dow Theory further emphasizes the value and psychological meaning of the 50% retracement stage, which is a viewpoint held by another influential technician, W. D. Gann.
The minor trend
Minor patterns aren't taken into account in Dow Theory. “The stock market is not rational in its fluctuations from day to day,” Hamilton wrote in his book The Stock Market Barometer. Minor patterns will last anywhere from a few days to a few weeks.
Trade with care.
If you like our content, please feel free to support our page with a like, comment & subscribe for future educational ideas and trading setups.

How To Avoid The Market Makers Stop Hunt Movement As part of the daily movement in the forex market is the stop hunting done by the market makers. They don't mean to hunt the normal and small trader at all, they are targeting the big investors and hedge funds you just happen to be in the wrong place at the wrong time.
As shown in No.1 this huge wick is an obvious stop hunt movement in this case the market makers are hunting the ones entered in the middle or at the end of the uptrend. Lesson learned here
"NEVER ENTER A TRADE IN THE MIDDLE OF A TREND ALWAYS WAIT FOR A RE-TRACEMENT"
In NO.2 after the price gave a good bearish signal ( hanging man candlestick ) it made a a shooting star candle with huge wick to hunt the stop losses. in this case lesson learned here
" WHEN YOU ENTER A TRADE WITH PRICE ACTION MAKE SURE TO PUT YOUR STOP LOSS ABOVE/BELOW IT WITH AT LEAST 20 - 30 PIPS"
In NO.3 when you trade you will see this low (blue line) broken so you would assume that it will continue to the downside and after you enter a sell trade NO.3 will occur. Lesson learned here is "DON'T ENTER AT THE END OF A SMALL TREND AND USE A GOOD BREAK SIGNAL"
And a last tip " TRY TO THINK AS A MARKET MAKER AND ANTICIPATE THE AREAS THEY WOULD HIT AND PUT YOUR STOP LOSS ABOVE/BELOW IT BY 20-30 PIP"

$EEENF Supernova!$EEENF 88 Energy- Project Peregrine; consisting of Merlin-1, Harrier-1 & UMIAT Wells
- UMIAT is estimated to have 124 Million Barrels of Oil
- 4 Billion Shares are owned by Nominee Brokers
- Sitting on 30 Billion potential gallons of High Grade Oil
- Near Conoco Phillips Willow Discovery
- An independent geologist said the find could be significant because it would show that an oil bearing regional geologic formation, where discoveries have been made, is larger than thought

Wolfe wave in USDCHFIt is for educational purpose only. And wolfe wave is one of the best wave structure.

The continuous feedback loop of a successful traderDo you know what’s more important than winning in trading? It is knowing exactly why you actually won . Why? So that you can do it constantly. Needless to say, it is equally important to know why you lost when you lost.
The successful trader is constantly winning money, no matter the conditions. The economy may be in recession … or not … Algorithmic trading may be accounted for most of the trading volume. The volatility may be over the edge or down to ridiculous levels due to the summer holidays. So what … these are all part of the job . You need to make money because this is your job and if you complain and blame external factors for your poor results then think about choosing another profession.
Many would ask how is that possible … to constantly make money in ever-changing markets? Among the other 999 little things, your overall strategy is built upon there is one directly linked to your consistency. That is the continuous feedback and adjustment loop of your trading approach . This is where your post-trade analysis takes place and where you should find out WHY you won or lost.
For a discretionary trader, this feedback loop is not an easy thing to put in place, but it’s crucially important to have it. Because, the more useful you want the feedback, the more accurate the analysis should be. The difficulty of building the whole feedback mechanism is finding a fine balance between the depth of the trading details you take into consideration and the time and effort needed for analyzing them. From personal experience, I can tell you that you may fail to have a useful mechanism if you are too superficial. You might as well get lost in “analysis paralysis” as well as if you go too deep. That level of needed compromise is somehow personal. You know you’ve reached it when it can answer the following questions:
1. Is your selection technique giving you enough opportunities per your time frame?
2. Are your entries able to give you the price moves you want?
3. Are your exit techniques able to cut your losers short and let the winners run?
If the answer is “No” to any of these questions then you need to ask the next question “Why?” and dissect the effectiveness of that particular technique. Be ready to do the required adjustments if necessary.
There is a point in a trader’s career when being able to answer these questions alone will be more useful than an advice from the mentor. From that point on you can be on your own.

Things I ask myself before a trade in cryptoThings I ask myself before a trade:
1 What's the market structure, range or trend?
2 Where are the major SR areas?
3 Can I lean my stops against SR?
4 Where would opposing pressure come in?
5 How is price moving, chop or clean?
6 Volatility expanding or decreasing?
