Trading Entries: Brutal Truths Nobody Tells You in crypto!
1.breakouts may fail
2.pullbacks may never come
3.pullbacks might become reversals
4.confirmation may be too late
5.you don’t need perfect entries
Hi guys..its the latest analyze chart .if you are interested any crypto that you want analyze with me and any questions please do not hesitate and comment below the chart!
if u like it press like-comment and folow me.thx
Educationalpost

Unsure About Your Trading Strategy in #crypto? (Then Do THIS)
1.stop trading
2.4 questions
Where did you learn it from?
Why does it work?
When does it work?
When doesn’t it work?
if you are interested any crypto that you want analyze with me and any questions please do not hesitate and comment below the chart!
if u like it press like-comment and folow me.thx

The 90-90-90 rule - Why do traders fail?"Many are called, but few are chosen". Ever heard this proverb?
This is certainly true for trading, in fact, there is even a rule in trading about this, the 90-90-90 rule. So what does this rule say?
"90% of traders lose 90% of their money in 90 days"
😱😱😱
That's right, statistics show that 90% of people who start trading lose the majority of their money in less than 3 months. But why is that so? In this post I will try to lay out the reasons for failure, if you are a new or struggling trader, I'm sure you'll find this useful. Let's get into it ...
🤯 EXPECTATIONS
Many start trading because they've seen or read about success stories, people becoming rich overnight, they might even have a friend who has been successful in trading and they think (to say it in Jeremy Clarckson's famous words) "How hard can it be?. With this approach, failure is imminent...
📐 NOT HAVING A PLAN
"If you fail to plan, you are planning to fail - Benjamin Franklin . Trading without a plan results almost certainly in failure. Your trading plan should include the definition of your setup, entry, stop loss, profit taking, trade management, risk management and money management.
🔄 NOT TESTING YOUR PLAN
OK, you have determined how you will trade, what defines your entries and exits, how much of your capital you will risk and how you will manage your trades. But do you know what is the expectancy of that plan? Do you know how much trades you will win on average, and how many you will lose? How much money can you expect to make?
Backtesting your plan, executing it flawlessly time after time on historical data will give you that information and the confidence to execute your plan time and time again without hesitation.
😱 EMOTIONS - THIS IS THE BIG ONE!
If did not take the time to create a trading plan and backtest it, you don't really know what you are doing and emotions will have the best of you.
Fear, greed, hope, excitement, anxiousness, boredom and frustration will drive your hard earned capital away from you.
Results of these emotions are : trading too much, letting your losers run and cutting winners short, revenge trading, overleveraging etc...
I could write an entire post about each of the emotions and how they can affect you while trading, but it would make this post too lengthy. Just know that emotions are your biggest enemy when trading, for best results you should be in a stoic state when trading.
🕺 EGO
"The market can remain irrational longer than you can remain solvent.". If you want to prove the market that you are right, you are doomed to fail. The market is always right, no matter what happens, so you better learn to accept that your analysis or prediction of what would happen was wrong and cut your losses. Fast!
📚 LACK OF EDUCATION
It takes many years to learn a skill or a profession, trading is no different. If you think about making lots of money without putting the time in to learn and test, you pretty much guarantee yourself to fail.
You wouldn't want a lawyer without education to defend you in court, or a self-proclaimed surgeon who learned on YouTube to operate on you, would you?
💰 STARTING CAPITAL TOO LOW
If you're starting with a low capital, you will tend to try and make it grow fast, resulting in taking too many trades, too high of a risk, too high leverage. If you start with a low capital, you'll have to be OK with the fact that it will grow slowly and that it will take (a lot of) time to build up a sizeable account.
🚦 BUYING OR FOLLOWING SIGNALS
"There is no such thing as easy money." You might think that you don't have the time to learn about trading, making and backtesting a trading plan. So why not follow signals?
Ask yourself what you know about this service? How profitable is it (and don't just go from the claims they make)? Do you know anything about the reason for a signal, why was it triggered?
Have you talked to other users who used the service, what do they think about it? Why is this person/company selling signals if they are so successful as they claim? Philanthropy ? 🤔
📉 INDICATORS OVERLOAD
Indicators can help you make decisions for trading, but too many indicators can and will lead to opposite signals or "analysis paralysis.
Most indicators are derived from price, so it makes sense to learn how to read price action and discover the story behind the candles.
🆕 THE NEXT SHINY OBJECT SYNDROME
You took the time to develop a trading plan and even tested it, but you run into a drawdown... Rather than counting on your experience and the expectancy that you know is there, you look for a new shiny method of trading, until the same thing happens again with this new method ... Rinse & repeat, never giving the chance for your original method, which you know was working when you tested it, to prove its worth ...
Alright, I think I have provided the main reasons why new or inexperienced traders fail. Knowing why they (or you) fail is one thing, doing something about it is not a small feat. But with enough dedication, persistance and the right mindset, you can prove these statistics wrong!
Feel like reasons are missing, let me know in the comments below.
So what is your story?
Are you a successful trader now but recognize these reasons for failure?
Are you a new trader? Was this helpful?
What did/will you do to overcome this?
What did/do you struggle most with?
Help the TradingView community by commenting below.
"Trading is a ruthless business that does not take any hostages, so you better come prepared." - Nico Muselle
Liked this post ? "Smash that like button!" 👍 - follow for more educational posts and alerts 🔔 when a new one is published.
Thank you for your visit! 🙏

5 Things You Should Stop Doing As A Trader1-listening to others
-you don’t know their trading plan
2-strategy hopping
-focus on one trading method
-learn more about the trading method
3-tweaking one strategy
-develop new strategies instead
4-thinking in terms of absolute
5-comparing yourself to others
if you are interested any crypto that you want analyze with me and any questions please do not hesitate and comment below the chart!
if u like it press like-comment and folow me.thx

🎓 EDU 4 of 20: A PROFESSIONAL TRADING APPROACH (FIST)Hi traders, wish you a happy and prosperous New Year.
In the last EDU post, we touched on the main factors that move currencies in the short, medium, and long run. Professional traders follow these influences to determine what currencies to buy and sell.
However, each trader has its own time horizon, so following long-term market determinants if you want to hold your trade for a few hours doesn’t make much sense. In fact, it’s counterproductive. Currencies can move in the opposite direction of their Purchasing Power Parity (PPP) rate, or Terms of Trade (ToT) for months and even years.
While these models work well to provide us with a possible market direction in the long-term, their short-term track-record is rather poor.
At CommaFX, we hold our trades mostly intraday or for a few days, and close them ahead of the Weekend (if a trade is still open on Friday.) This way, we can make more short-term trades and avoid the market risk of holding trades over the weekend. News that are releases over the weekend can have a significant impact on open trades after the markets open on Monday!
I am following the FIST approach, which is a global macro approach that allows us to take only high-probability trades. FIST stands for Fundamentals, Intermarket, Sentiment, and Technicals.
On the Fundamental side, I am following:
1. The current business cycle of a country through leading economic indicators such as housing starts, durable goods orders, and PMIs. Countries that are in the expansionary phase of the business cycle see their currencies strengthen, while countries that are in the recessionary phase usually see their currencies weaken over time.
2. Important news and themes: Such as Brexit, US stimulus, OPEC meetings, Central Bank commentaries...
3. Economic Indicators used by central banks to adjust their monetary policy: inflation rates, labor market indicators, economic growth.
On the Intermarket side, I am following the performance of other markets and asset classes that can have an impact on the FX market, such as:
1. Commodities: For commodity currencies like CAD (oil), INR (oil), AUD (copper, gold), NZD (dairy).
2. Stocks: The performance of the stock market can provide clues for future exchange rates (e.g. higher Nikkei 225 usually leads to JPY weakness).
3. Bonds and yields: Global capital chases the highest yield. When bond prices fall and yields rise in a country, the country’s currency will often strengthen.
If I see a strong divergence in the Intermarket (for example oil rises but the Canadian dollar falls, such as the case in the previous week), it gets our attention. I become bearish on the CAD from an Intermarket perspective.
On the Sentiment side, I am following risk appetite indicators and market sentiment as shown by the options and futures markets. What I pay attention to is:
1. The performance of risky assets vs safe-havens: stocks (risky), risk-currencies (AUD, NZD), oil (market optimism), metals (silver, copper) vs safe-havens such as gold, bonds, JPY and CHF. When risk sentiment is positive (risky assets are bought and safe-havens sold), I become bullish on stocks, AUD and NZD, and bearish on the JPY, CHF, and USD, for example.
2. Market positioning: I follow the positioning of fast money (hedge funds) and smart money as shown by the Commitment of Traders report. When the big guys become bullish on a currency and increase their bullish bias week over week, I become bullish as well.
3. Options put/call ratio: The put/call ratio shows how many put and call contracts are active for a currency. As the ratio rises (i.e. more puts than calls), this is usually a bearish sign for a currency, and vice-versa.
Finally, once I see a promising trading opportunity in the market after performing my Fundamental, Intermarket, and Sentiment analysis (matching strong vs weak currencies), it’s time to identify possible entry and exit points with the use of Technicals.
Bear in mind that I know what direction I want to trade (i.e. short USD/CAD) before even opening a price-chart! The chart is only used to find suitable levels for a selling position.
On the technical side, I focus on important retracement levels, volume profile, and price-action. I don’t trade breakouts, but wait for the market to come to my level (using LIMIT orders) to enter into a trade with an attractive reward-to-risk ratio.
This was a short introduction to how professional traders find trading candidates in the market. Unlike the usual retail trader who focuses only on charts, we know what we want to trade before even opening the chart!
A chart is the last thing I pay attention to, and my technical analysis takes me around 5 minutes to find where I want to enter into a trade. 90% of the time, I am only focused on fundamentals, intermarket, and sentiment.
If you found this post useful, please hit the “LIKE” button and follow. Also, I’ll try to respond to all questions you might have, just post them in the comment section below.
Stay tuned for the next part of our Educational Series! In total, there will be 20 posts that will CHANGE the way you trade and look at the markets – PROMISED!

15 Types of Financial Market Participants ExplainedIn this post, I’ll be going over the 15 types of financial market participants as listed above.
You want to keep your friend close, and your enemies closer. As an investor or a trader, jumping into the market without knowing what these entities are doing is like jumping into a battlefield with just a stick in your hand.
So understanding the roles of each of these entities can help you significantly later as you mature as an investor, especially if you’re a beginner.
Investment Banks
- Investment banks buy, sell, and issue stocks and bonds, lead mergers and acquisitions, conducts market research, and provide asset management services.
- They act as a bridge between people who want to invest their capital, and people who need investments.
- Investment banks can be more specifically divided into two types: bulge brackets and boutiques.
- Bulge brackets are general investment banks like Goldman Sachs, JP Morgan, Morgan Stanley, and Deutsche Bank.
- Boutiques are more specialized investment banks such as Lazard, Evercore, and Guggenheim.
Structure of an Investment Bank
- A general investment bank can be divided into three offices: the front, middle, and back office.
- The front office consists of four divisions: the investment banking division, sales and trading, asset management division, and research division.
- The front office refers to the divisions that directly interact with clients, and are in full charge of generating profits for the company.
- The image of investment bankers portrayed in movies generally all refer to the front office. These are the people who make six figure monthly salaries.
- The middle office is in charge of supporting the front office.
- They are responsible for risk management or capital management.
- The back office is in charge of the operations of the investment bank as a company, so it includes IT, HR, and other administrative teams.
Front Office Divisions Explained
1) Investment Banking Division (IBD)
- The investment banking division is in charge of everything that happens in the primary market.
- The primary market is where securities are created, and the secondary market is where those securities are traded.
- Normally when retail investors invest, it all happens in the secondary market.
- In the primary market, investment banks offer a variety of services including the issuance of stocks and bonds, leading an IPO, or leading an M&A.
- Teams are normally divided by sectors, but they can also be divided into specific teams depending on the deal they’re doing.
- Their day to day work involves company valuation, industry analysis, analyzing a company’s financials, preparing for presentations, and financial modelling. (When I say financial modelling, I mean that they use excel. They don’t really use extremely sophisticated statistical models in this division.)
2) Sales and Trading
- When you think of Ivy League alumni who work in finance, it usually refers to people in the investment banking division, or in sales and trading.
- But recently, this division has been dying, and is on a downtrend.
- Trading can be divided into two types: prop trading or proprietary trading, and flow trading.
- Prop trading refers to the type of trading that we know, where traders buy low, and sell high.
- Flow trading refers to order flows, where if a client makes an order the trading desk fills that order on the client’s behalf.
- In that process, they leave a small profit margin and take a certain amount of fees.
- In the past, both types of trading were extremely active.
- But with the global financial crisis in 2008, prop trading within investment banks got banned, according to the Volcker rule.
- As a result, most major banks spun off their prop trading desks, and the people who used to be prop traders in investment banks left to create their own hedge fund.
- What’s left now is flow trading, but since flow trading refers to simply filling orders on the customer’s behalf, this process has recently been automated to a huge extent, especially with the emergence of high frequency trading
- Along with this, their profit margins and commission started to decline, and the sales and trading industry as a whole is shrinking over time.
- As such, the teams left in this division are teams such as high frequency trading teams, quant teams, and OTC market traders. (OTC refers to over-the-counter, which is where customized products are bought and sold, as opposed to standardized products that we see in secondary markets.)
3) Research
- The research division is in charge of market research.
- They make analyst reports that we’re familiar with.
- But this is another division that’s dying.
- Research conducted by these institutions were actually provided to their clients as a token of gratitude for using their services, and paying commission.
- But, with brokers like WeBull and Robinhood offering zero commission, their business model deteriorated.
- Especially in Europe, laws have been set to distinguish payments for commissions and payments for research material, and people don’t really want to pay money for services like these.
- Lastly, with the development of data science, the way research is conducted has completely changed.
- It has become more technical, using machine learning techniques of pattern recognition, and it’s becoming more common on the buy side.
Mutual Funds, Hedge Funds, Proprietary Trading Firms
- In the case of mutual funds, the capital of the fund comes from people, or the general public.
- The capital for hedge funds come from accredited investors who qualify the capital requirement.
- Normally, these investors need to invest a minimum of $500,000 to $1 million.
- In the case of prop trading firms, they trade with their own money. Hence the term ‘proprietary’.
- In terms of their investments, mutual funds are mostly limited to investments in stocks and bonds.
- Hedge funds and prop trading firms don’t have any limitations or regulations in terms of the asset they want to invest in.
- Even in terms of the trading/investment strategies that are used, mutual funds strategies are quite limited and regulated heavily, as opposed to hedge funds or prop trading firms that have no restrictions in their strategies.
- The logic behind restricting strategies that mutual funds use is that mutual funds manage capital of the general public, and thus have to be more careful with how they manage their funds.
- The regulations that the government poses on mutual funds are essentially ways to protect the general public from potential losses that might incur.
- As such, even when it comes to revealing information, mutual funds need to be transparent about everything.
- In the case of hedge funds, the government acknowledges that accredited investors with $3-4 million to invest are probably aware of the potential risks, and thus is relatively less limited in having to reveal their information.
- Lastly, in the case of prop trading firms, because they’re trading with their own money, they have no obligation to reveal any of their information.
- This is why prop trading firms use exclusive trading techniques and strategies that cannot be exposed to the general public.
- Mutual funds take a 1-2% management fee, and don’t take any other incentive fees.
- Thus, they focus on gathering as many people as possible in order to capitalize on a huge management fee.
- They are also legally allowed to advertise and do sales.
- Hedge funds take 1-2% as management fees, and 15-20% in incentives. This is also known as the Two and Twenty.
- Hedge funds are also limited from advertising.
- Lastly, prop trading companies take all of the profits they generate, and thus do not need any advertising at all.
- Examples of mutual funds include Vanguard, Fidelity, and State Street.
- Famous hedge fund examples include Bridgewater Associates, Renaissance Technologies, and Elliott.
- Lastly, prop trading companies are companies like D. E. Shaw, Hudson River Trading, and DRW.
Private Equity
- Private equities are very similar to hedge funds in terms of their nature, the way they receive management fees and incentives.
- But as opposed to hedge funds that normally invest and trade in the secondary market, private equities directly invest in a company. Hence the name ‘private’ equity.
- A prime example is a leveraged buyout fund. This is when private equities acquire a huge stake within a company, increase its profitability, and sell their stake for a higher price.
- In movies, these people are portrayed as bloodless and merciless people who lay off tens of thousands of workers to cut costs of a company.
- Similarly, there are venture Capital funds that invest in early startups, and Growth Equity Funds that invest in startups at later stages.
Exchange Traded Funds (ETFs), Index Funds
- Before I explain index funds, it’s important that you understand exchange traded funds, or ETFs.
- An ETF is essentially a basket of securities that trades on an exchange like a stock.
- In mutual funds, when they have a fund that tracks an underlying index, it’s called an index fund.
- Similarly, an ETF that tracks an underlying index is an Index ETF.
- An Index ETF is essentially the same thing, but a security listed on an exchange, into smaller bits, so that individuals can buy and sell the ETF like a stock.
- For instance, for an individual to invest in all 500 companies on the S&P 500 index is extremely difficult.
- What institutions do is, they buy the shares of all 500 companies on the client’s behalf, creating a basket with all companies.
- From there, they sell the ownership of the basket to clients, which is the ETF.
- Because these companies actually own the underlying asset, they are not exposed to the risk of bankruptcy.
- This is a passive fund, in which a fund manager does not really intervene actively.
- Thus, the fund manager of an Index ETF just needs to mechanically buy and sell shares according to the index, so that the ETF can perform in correlation to the index.
- Ever since the global financial crisis in 2008, quantitative easing has pushed market indices to move upwards over time, making passive Index ETFs a very attractive option for investment.
Sovereign Wealth Funds, Pension Funds, Endowment Funds
- A sovereign wealth fund is a state-owned investment fund that invests in financial assets, and is run by the state.
- A pension fund is a fund that is set up by contributions from employers, unions, or other organizations to provide retirement benefits to its employees or members.
- Pension funds are one of the largest players in the market by size.
- They invest in stocks and bonds, but also increasingly stated exposing themselves to other asset classes.
- There are also endowment funds, which is a fund that invests with the money that was gifted to them.
- These funds are often run by universities, nonprofit organizations, and sometimes even churches.
- The funds operated by Harvard and Yale are known as Super Endowment Funds due to their fund size and impressive returns.
- A general portfolio that consists of 60% stocks and 40% bonds would give an annual return of 5.4%.
- Super Endowment Funds have managed to reach an annual return rate of 11.5% over the past 20 years.
- These funds have great network value, easy access to premium information, and expertise in alternative asset class investments.
- This means that they don’t invest in just stocks and bonds, but also real estate, private equities, emerging equities, global bonds, and natural resources.
Brokers, Dealers, Exchanges
- Brokers play the role of middlemen who connect buyers and sellers within a market, and profit from commissions.
- Exchanges play the same role within the cryptocurrency market.
- Dealers play the role of market makers for customized financial products that are traded in the OTC markets.
- Essentially, they take the opposite position of the person trying to trade.
- Dealers mostly do business with institutional investors, because individual investors normally don’t trade customized financial products.
- As a rule of thumb, when someone says dealers, think of investment bankers who trade interest rate swaps, bonds, or CBS over the counter.
Insurance Companies
- Moving onto insurance companies; they receive premiums from their clients, and while their role is to pay their clients back in case of an accident, during day to day operations, they also participate in the financial markets with the capital they have.
- However, compared to the size of their fund, they play a relatively less significant role in the market.
Federal Reserve Board
- The Federal Reserve Board, or Fed, consists of 12 regional federal banks.
- They control the national monetary policy, supervise and regulate banks, and maintain financial stability.
- There’s a colloquial term that ‘the Fed prints money’, but this is not to be taken literally.
- One of the ways in which they control money supply is by buying or selling bonds in the open market, also called the open market operations.
- One of the reasons that all asset markets have been so bullish ever since the market drop in March is because the Fed has increased money supply at an unprecedented rate, thereby inflating asset prices.
Limited Liability Companies
- Limited liability companies are also players within the financial markets.
- They initiate share buybacks, give out dividends to shareholders, and insider transactions take place as well, which is actually highly illegal.
- Insider transaction refers to an insider of the company trading the company’s shares based on information asymmetry.
- For instance, if an executive at Pfizer bought the company’s shares before the vaccine announcement, knowing that the vaccine was ready, that would be considered insider trading, and he’d do jail time for it.
Securities and Exchange Commission (SEC)
- The Securities and Exchange Commission is in charge of imposing federal securities laws and regulating the stock and options exchange.
- In the example suggested previously of an executive from Pfizer, the SEC would be the entity to investigate the case.
Retail Investors, Accredited Investors
- Retail investors refer to the general public that take part in the financial market.
- These are the people who work 9-5 jobs, and invest in stocks over the long run, or sometimes they’re full time traders and investors.
- Accredited investors are similar to retail investors in that they are an individual, but they’re different from other retail investors in the sense that they’re acknowledged by the SEC.
- Essentially, the government understands that an accredited investor has more knowledge and capital, and is capable of bearing more risk compared to the average retail investor.
- Thus, they get more opportunities to participate in the financial market that normal retail investors don’t.
- For instance, they can buy private companies that aren’t listed on the secondary markets, and they can invest their capital in hedge funds.
- To become an accredited investor in the US, your net worth must exceed $1 million, not including primary residence, or your annual income must exceed $200,000 for the past 2 years, or $300,000 in annual income with your spouse for the past 2 years.
If you like this educational post, please make sure to like, and follow for more quality content!
If you have any questions or comments, feel free to comment below! :)

📚 Learn More 💰 Earn More with us: FLAG = Impulse + Correction📚 LEARN MORE
💰 EARN MORE
With ForecastCity
FLAG pattern Definition:
A FLAG pattern is a continuation chart pattern, named due to its similarity to a flag on a flagpole.
A flag is a relatively rapid chart formation that appears as a small channel after a steep trend, which develops in the opposite direction.
After an uptrend, it has a downward slope. After a downtrend, it has an upward slope.
IMPULSE Definition:
A “flag” is composed of an explosive strong price move forming a nearly vertical line.
This is known as the "IMPULSE" or ”flagpole”.
The sharper the spike on the flagpole, the more powerful the bull flag can be.
Corrective Wave Definition:
After an uptrend, it has a downward slope. After a downtrend, it has an upward slope.
This downward or upward slop known as "Corrective Wave".
Flag patterns can be bullish or bearish:
A bullish flag is known as a Bull Flag.
A bearish flag is known as a Bear Flag.
How to Trade FLAG Patterns:
When the trend line resistance on the flag breaks, it triggers the next leg of the trend move, and the price proceeds ahead.
Breakouts happen in both directions but almost all flags are continuation patterns.
This means that Flags in an uptrend are expected to break out upward and Flags in a downtrend, are expected to break out downward.
❤️ If you find this helpful and want more FREE forecasts in TradingView
. . . . . Please show your support back,
. . . . . . . . Hit the 👍 LIKE button,
. . . . . . . . . . Drop some feedback below in the comment!
❤️ Your Support is very much 🙏 appreciated! ❤️
💎 Want us to help you become a better Forex trader ?
Now, It's your turn !
Be sure to leave a comment let us know how you see this opportunity and forecast.
Trade well, ❤️
ForecastCity English Support Team ❤️

📚 Learn More 💰 Earn More with us: FLAG = Impulse + CorrectionFLAG = Impulse + Correction
📚 LEARN MORE
💰 EARN MORE
With ForecastCity
After a significant drop in Bitcoin price , the price is in a correction wave.
What makes the chart interesting today is that:
. Bitcoin is likely to challenge the 18042 ~ 18227 resistance area.
. A break above 18227 could push the pair to the 19487 area .
. A resistance rejection , however could lead to another retest of the lower supports.
Will the Bitcoin see a rejection from the resistance area or an upside breakout?
No one knows it! We have to wait and see!
❤️ If you find this helpful and want more FREE forecasts in TradingView
. . . . . Please show your support back,
. . . . . . . . Hit the 👍 LIKE button,
. . . . . . . . . . Drop some feedback below in the comment!
❤️ Your Support is very much 🙏 appreciated! ❤️
💎 Want us to help you become a better Forex trader ?
Now, It's your turn !
Be sure to leave a comment let us know how you see this opportunity and forecast.
Trade well, ❤️
ForecastCity English Support Team ❤️

📚 Learn More 💰 Earn More with us: FLAG = Impulse + CorrectionFLAG = Impulse + Correction
📚 LEARN MORE
💰 EARN MORE
With ForecastCity
After a significant drop in Bitcoin price , the price is in a correction wave.
What makes the chart interesting today is that:
. Bitcoin is likely to challenge the 18042 ~ 18227 resistance zone.
. A break above 18227 could push the pair to the 19487 area .
. A resistance rejection , however could lead to another retest of the lower supports.
Will the Bitcoin see a rejection from the resistance zone or an upside breakout?
No one knows it! We have to wait and see!

📚 💰 Descending Triangle in GBPNZD - "Learn More Earn More"📚 LEARN MORE
💰 EARN MORE
With ForecastCity
Descending Triangle Definition:
A Descending Triangle is a type of triangle chart pattern that occurs when there is a support level and a slope of lower high.
It is defined by two lines:
. A horizontal support line running through valleys.
. A Downtrend line drawn through the peaks.
The lower highs indicate more sellers are gradually entering the market and selling pressure increases as price consolidates moving further towards the apex.
A Descending Triangle is classified as a continuation chart pattern .
If price can break through the support level, that level will now act as a resistance level.
Breakouts can also happen in both directions. Statistically, downward breakouts are more likely to occur, but upward ones seem to be more reliable.
In most cases, the sellers will win this battle and the price will break out past the support. But Sometimes the support level is too strong, and there is simply not enough selling power to push it through. Therefore you should be ready for movement in EITHER direction.
ENTRY:
We would set an entry order below the support line and above the slope of the lower highs.
TARGET:
Target is approximately the same distance as the height of the triangle formation.
❤️ If you find this helpful and want more FREE forecasts in TradingView
. . . . . Please show your support back,
. . . . . . . . Hit the 👍 LIKE button,
. . . . . . . . . . Drop some feedback below in the comment!
❤️ Your Support is very much 🙏 appreciated! ❤️
💎 Want us to help you become a better Forex trader ?
Now, It's your turn !
Be sure to leave a comment let us know how you see this opportunity and forecast.
Trade well, ❤️
ForecastCity English Support Team ❤️

📚 💰 Ascending Triangle in AUDCAD - "Learn More Earn More" 📚 LEARN MORE
💰 EARN MORE
With ForecastCity
Ascending Triangle Definition:
An ascending triangle is a type of triangle chart pattern that occurs when there is a resistance level and a slope of higher lows.
It is defined by two lines:
. A horizontal resistance line running through peaks.
. An uptrend line drawn through the bottoms.
The higher lows indicate more buyers are gradually entering the market and buying pressure increases as price consolidates moving further towards the apex.
An ascending triangle is classified as a continuation chart pattern.
If price can break through the resistance level, that level will now act as a support level.
Breakouts can also happen in both directions. Statistically, upward breakouts are more likely to occur, but downward ones seem to be more reliable.
In most cases, the buyers will win this battle and the price will break out past the resistance. But Sometimes the resistance level is too strong, and there is simply not enough buying power to push it through. Therefore you should be ready for movement in EITHER direction.
ENTRY:
We would set an entry order above the resistance line and below the slope of the higher lows.
TARGET:
Target is approximately the same distance as the height of the triangle formation.
❤️ If you find this helpful and want more FREE forecasts in TradingView
. . . . . Please show your support back,
. . . . . . . . Hit the 👍 LIKE button,
. . . . . . . . . . Drop some feedback below in the comment!
❤️ Your Support is very much 🙏 appreciated! ❤️
💎 Want us to help you become a better Forex trader ?
Now, It's your turn !
Be sure to leave a comment let us know how you see this opportunity and forecast.
Trade well, ❤️
ForecastCity English Support Team ❤️

📚💰Head and Shoulders in GBPCAD - Learn More Earn More with US📚 LEARN MORE
💰 EARN MORE
With ForecastCity
Head and Shoulders Definition:
A head and shoulders pattern is also a trend reversal formation.
It is formed by a peak (left shoulder), followed by a higher peak (head), and then another lower peak (right shoulder).
A “ Neckline ” is drawn by connecting the lowest points of the two troughs. Neckline support does not need to be strictly horizontal.
. This illustrates that the upward trend is coming to an end.
. When a Head and Shoulders formation is seen in an uptrend, it signifies a major reversal.
. The pattern is confirmed once the price breaches the neckline support
In this example, we can easily see the head and shoulders pattern.
How to Trade the Head and Shoulders Pattern:
ENTRY:
we put an entry order below the neckline.
TARGET:
We can also calculate a target by measuring the highest point of the head to the neckline.
This distance is approximately how far the price will move after it breaks the neckline.
❤️ If you find this helpful and want more FREE forecasts in TradingView
. . . . . Please show your support back,
. . . . . . . . Hit the 👍 LIKE button,
. . . . . . . . . . Drop some feedback below in the comment!
❤️ Your Support is very much 🙏 appreciated! ❤️
💎 Want us to help you become a better Forex trader ?
Now, It's your turn !
Be sure to leave a comment let us know how you see this opportunity and forecast.
Trade well, ❤️
ForecastCity English Support Team ❤️

📚💰Inverted Head and Shoulders in VETUSDT -Learn More Earn More📚 LEARN MORE
💰 EARN MORE
With ForecastCity
Inverted Head and Shoulders Definition:
A head and shoulders pattern is also a trend reversal formation.
It is formed by a Valley (left shoulder), followed by a Lower Valley (head), and then another Higher Valley (right shoulder).
A “ Neckline ” is drawn by connecting the highest points of the two Peaks. Neckline resistance does not need to be strictly horizontal.
This illustrates that the downward trend is coming to an end.
When a Head and Shoulders formation is seen in a downtrend, it signifies a major reversal.
The pattern is confirmed once the price breaches the neckline resistance.
In this example, we can easily see the head and shoulders pattern.
How to Trade the Head and Shoulders Pattern:
ENTRY:
we put an entry order above the neckline.
TARGET:
We can also calculate a target by measuring the lowest point of the head to the neckline.
This distance is approximately how far the price will move after it breaks the neckline.
❤️ If you find this helpful and want more FREE forecasts in TradingView
. . . . . Please show your support back,
. . . . . . . . Hit the 👍 LIKE button,
. . . . . . . . . . Drop some feedback below in the comment!
❤️ Your Support is very much 🙏 appreciated! ❤️
💎 Want us to help you become a better Forex trader ?
Now, It's your turn !
Be sure to leave a comment let us know how you see this opportunity and forecast.
Trade well, ❤️
ForecastCity English Support Team ❤️

📚 💰 Descending Triangle in ETHBTC - "Learn More Earn More" 📚 LEARN MORE
💰 EARN MORE
With ForecastCity
Descending Triangle Definition:
An Descending Triangle is a type of triangle chart pattern that occurs when there is a support level and a slope of lower high .
It is defined by two lines:
. A horizontal support line running through valleys.
. A Downtrend line drawn through the peaks.
The lower highs indicate more sellers are gradually entering the market and selling pressure increases as price consolidates moving further towards the apex.
An Descending Triangle is classified as a continuation chart pattern.
If price can break through the support level, that level will now act as a resistance level.
Breakouts can also happen in both directions. Statistically, downward breakouts are more likely to occur, but upward ones seem to be more reliable.
In most cases, the sellers will win this battle and the price will break out past the support. But Sometimes the support level is too strong, and there is simply not enough selling power to push it through. Therefore you should be ready for movement in EITHER direction.
ENTRY:
We would set an entry order bellow the support line and above the slope of the lower highs.
TARGET:
Target is approximately the same distance as the height of the triangle formation.
❤️ If you find this helpful and want more FREE forecasts in TradingView
. . . . . Please show your support back,
. . . . . . . . Hit the 👍 LIKE button,
. . . . . . . . . . Drop some feedback below in the comment!
❤️ Your Support is very much 🙏 appreciated! ❤️
💎 Want us to help you become a better Forex trader ?
Now, It's your turn !
Be sure to leave a comment let us know how you see this opportunity and forecast.
Trade well, ❤️
ForecastCity English Support Team ❤️

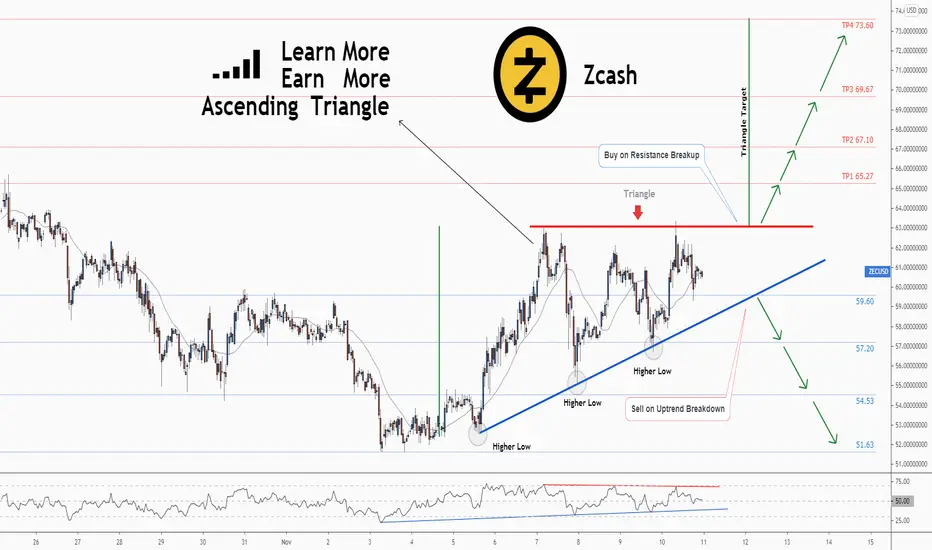
💡Ascending Triangle in ZECUSD - "Learn More Earn More" With USAscending Triangle Definition:
An ascending triangle is a type of triangle chart pattern that occurs
when there is a resistance level and a slope of higher lows .
It is defined by two lines:
. A horizontal resistance line running through peaks.
. An uptrend line drawn through the bottoms.
The higher lows indicate more buyers are gradually entering the market
and buying pressure increases as price consolidates moving further towards the apex.
An ascending triangle is classified as a continuation chart pattern .
If price can break through the resistance level, that level will now act as a support level.
Breakouts can also happen in both directions. Statistically,
upward breakouts are more likely to occur, but downward ones seem to be more reliable.
In most cases, the buyers will win this battle and the price will break out past the resistance.
But Sometimes the resistance level is too strong,
and there is simply not enough buying power to push it through.
Therefore you should be ready for movement in EITHER direction.
ENTRY:
We would set an entry order above the resistance line and below the slope of the higher lows .
TARGET:
Target is approximately the same distance as the height of the triangle formation.
❤️ If you find this helpful and want more FREE forecasts in TradingView
. . . . . Please show your support back,
. . . . . . . . Hit the 👍 LIKE button,
. . . . . . . . . . Drop some feedback below in the comment!
❤️ Your Support is very much 🙏 appreciated! ❤️
💎 Want us to help you become a better Forex trader ?
Now, It's your turn !
Be sure to leave a comment let us know how you see this opportunity and forecast.
Trade well, ❤️
ForecastCity English Support Team ❤️
👀 TECH ANALYSIS VS STRATEGY 👀 READ ME 👀And there we have it... No pretty lines, NO stress, NO technical analsyis, NO more wasted time on the charts
ONE of the main reasons for people wanting to trade forex is for not only the financial benefit but to have FREEDOM!
so why would you then spend ALL DAY performing technical analysis on the charts 👀
in hand causing you the stress, the bad night sleep, the anxiety, the bad mood swings...
ps.
this trade is now running at a 5% account gain, just risking 1% per trade we place.
******************************************************************************************************************************************************************
What is our strategy?
Our strategy is a trend following strategy - that is coded in pine script to use with the trading view platform - the entries are shown automatically! NOTHING is done manually, it can be used on any instrument and time frame. However, we have hard coded specific parameters for when trading the H1 time frame, so we can back up over 4200 previous trades to confirm our edge from previous data. This gives us confidence in execution and belief in our trading strategy for the long term.
The strategy simply sits in your trading view, so you will see exactly what we see - the trade, entry price, SL and multiple TPs (although we hold until opposite trade as this is the most profitable longer term plan), lot size, etc.
This could be on your phone trading view app, or laptop of course.
The hard work is done, so we have zero chart work time, no analysis, no time front of the chart doing technical analysis - technical analysis is very subjective - you may see different things at different times - how do you have a rigid trading plan on a H&S shoulder pattern? Your daily routine, diet, sleep, exercise can affect what you 'see' and your decision making, this doesn't happen when a strategy is coded like this; what we do have is a mechanical trading strategy...
What does this mean?
It means, we are very clear on our entry and our exit and use strict risk management (this is built in - put in your account size, set your risk in % or fixed amount and it will tell you what lot size to trade!) so we have no ego with our position and we are comfortable with all outcomes - its simply just another trade. This free's our mindset from worry and anxiety as we take confidence from knowing our edge is there and also that we have used sensible risk management.
The strategy itself can be used as a live trading journal too!
