Mastering 2025 in Trading: Dive into Psychological PreparationThe year 2025 has well begun, and while many traders may have set goals and plans, the true challenge lies in executing them with consistency and mental clarity.
The markets are already moving, and it’s crucial to recalibrate and solidify your psychological foundation to thrive this year.
Let’s explore seven advanced strategies to mentally prime yourself for trading success, with actionable insights to implement immediately.
________________________________________
1. Conduct a Comprehensive Annual Review
Although the calendar has turned, reviewing your 2024 performance is still invaluable for shaping your 2025 approach.
• Steps to Take:
o Evaluate Performance: Analyze trades from 2024 to identify patterns, strengths, and areas needing improvement. Reflect on both technical execution and emotional responses.
o Analyze Metrics: Beyond win rates, consider risk-reward ratios, maximum drawdowns, and adherence to your trading plan. Did you manage risk effectively? Were you disciplined in execution?
o Adjust Accordingly: Use these insights to adapt your strategy. For instance, if you performed better in trending markets, focus on those setups this year.
• Advanced Tip: Take note of how you handled different market conditions—such as high volatility versus range-bound markets—and create specific strategies for handling similar scenarios in 2025.
________________________________________
2. Develop Mental Toughness
The start of a new year often brings heightened emotions—excitement, pressure, or even lingering frustration from the previous year. Mental toughness is essential for maintaining discipline and objectivity.
• Strategies for Resilience:
o Daily Visualization: Spend five minutes each morning visualizing how you’ll respond to various scenarios (e.g., unexpected losses or sudden market spikes).
o Emotion Tracking: Alongside your trading journal, log your emotions before, during, and after trades. This will reveal emotional triggers that may affect decision-making.
• Advanced Tip: Practice reframing setbacks. Instead of viewing a loss as failure, see it as feedback. Develop a personal mantra, such as "Every trade is a lesson," to maintain a growth mindset.
________________________________________
3. Establish a Pre-Trading Routine
Consistency is key, and a structured pre-trading routine can help you start each session with focus and clarity.
• Key Elements of an Advanced Routine:
o Market Context Review: Assess broader market narratives, such as macroeconomic events, sector performance, or sentiment shifts, to understand the trading landscape.
o Refinement of Strategy: Define specific setups you’re looking for and remind yourself of your risk parameters.
o Mindfulness Practice: Spend five minutes meditating or practicing controlled breathing to center yourself before the trading session.
• Advanced Tip: Include a quick "mental rehearsal" of your trading plan. Imagine executing trades calmly and sticking to your rules, even in volatile conditions.
________________________________________
4. Set Specific, Measurable Goals
With the year already started, it’s important to focus on actionable goals that emphasize process over outcomes.
• Process-Oriented Goals:
o Instead of vague profit targets (e.g., "earn 20% this year"), focus on measurable habits, such as "review every trade for compliance with my plan."
o Break annual goals into quarterly, monthly, or weekly objectives to maintain momentum.
• Advanced Tip: Use a habit tracker or performance dashboard to monitor your adherence to rules, emotional discipline, and progress toward milestones. Adjust goals based on your evolving performance.
________________________________________
5. Create a Structured Trading Plan
Your trading plan isn’t static—it should evolve as you gain insights and adapt to market conditions. Starting the year with a clear, structured plan is vital.
• Enhancements for 2025:
o Adapt to Volatility: Assess the first 20 days of trading this year to gauge volatility and adjust your risk parameters if needed.
o Scenario Planning: Incorporate contingency plans for unexpected events, such as black swan market moves.
• Advanced Tip: Review and tweak your trading plan bi-weekly during the first quarter to ensure it aligns with both market realities and your performance.
________________________________________
6. Balance Information Intake
In today’s information-rich world, traders must strike a balance between staying informed and avoiding information overload.
• Steps to Filter Information:
o Set Boundaries: Allocate specific times to consume news and stick to them. Avoid constant updates, which can lead to emotional decision-making.
o Focus on Sources: Select a handful of reliable news outlets that align with your trading focus, and ignore sensationalist or irrelevant content.
• Advanced Tip: Use AI tools or curated platforms to filter market-relevant data. For example, set alerts for key economic releases instead of scrolling through endless feeds.
________________________________________
7. Embrace Continuous Learning
The beginning of the year is the perfect time to commit to self-improvement, not just in strategy but also in trading psychology.
• Actionable Learning Framework:
o Daily Microlearning: Dedicate 10–15 minutes daily to reading, watching videos, or studying advanced topics such as behavioral finance or quantitative analysis.
o Weekly Reflection: Use weekends to review your trading journal, analyze mistakes, and refine your approach.
o Community Engagement: Participate in forums, webinars, or mentorship programs for shared insights and accountability.
• Advanced Tip: Focus on specific weaknesses identified in your annual review. For example, if exiting trades too early was an issue in 2024, study advanced exit strategies and backtest them.
________________________________________
Conclusion
The markets have already started testing traders in 2025, but it’s never too late to fortify your psychological and strategic foundation. By implementing these seven advanced techniques, you can navigate the challenges and seize the opportunities that the year presents.
Remember, trading success is a marathon, not a sprint. Begin the year with a disciplined and resilient approach, and you’ll be well-positioned for sustainable growth. Here’s to a prosperous and fulfilling trading journey in 2025!
Educationalpost

The Four Horsemen of Trading: Overcoming the Emotional Pitfalls
Investing and trading are often viewed as purely logical activities. Many assume that success in the markets depends solely on mastering data, charts, and economic theories. However, the reality is that emotions frequently play an outsized role in influencing decisions, often to the detriment of traders. In his 1994 classic I nvest Like the Best, James O'Shaughnessy described the four common psychological pitfalls that derail investors: fear, greed, hope, and ignorance. These "Four Horsemen of the Investment Apocalypse" are as relevant today as ever, especially in the new market conditions and uncertanty.
Let’s explore each of these emotional pitfalls in detail, understand their impact, and discuss strategies to overcome them.
________________________________________
1. Fear: The Paralyzing Grip of Uncertainty
Fear is perhaps the most immediate and visceral emotion traders experience. It manifests in two primary ways: the fear of losing money and the fear of missing out.
Fear of Losing Money
This fear often causes traders to exit positions prematurely, robbing them of potential profits. For instance, a trader may close a trade the moment it moves slightly against them, even if their analysis indicates a high likelihood of eventual success. This behavior stems from a deep-seated aversion to loss, amplified by the memory of past trading failures.
Fear of Missing Out
FOMO drives traders to enter markets impulsively, often at inopportune times. Seeing a rapid price increase can tempt traders to jump in without proper analysis, only to be caught in a reversal.
How to Overcome Fear
• Develop a Plan: A solid trading plan with predefined entry, exit, and stop-loss levels helps remove the uncertainty that fuels fear.
• Focus on the Process: Shift your attention from individual trade outcomes to the consistency of following your strategy.
• Accept Losses as Part of Trading: View losses as a natural and manageable aspect of trading rather than personal failures.
________________________________________
2. Greed: The Endless Pursuit of More
Greed is the counterbalance to fear. It drives traders to seek excessive gains, often at the expense of sound decision-making. Greed clouds judgment, leading to overleveraging, chasing unrealistic profits, and deviating from planned strategies.
Examples of Greed in Trading
• Moving profit targets further as a trade approaches them, hoping for larger gains.
• Ignoring exit signals in anticipation of an extended rally, only to watch profits evaporate.
• Taking on larger positions than risk management rules would typically allow, driven by overconfidence.
How to Overcome Greed
• Set Realistic Goals: Establish achievable profit targets based on market conditions and your trading strategy.
• Stick to Risk Management Rules: Never risk more than a predetermined percentage of your trading account on a single trade.
• Practice Gratitude: Recognize and appreciate the profits you’ve made instead of constantly chasing more.
________________________________________
3. Hope: Holding Onto Losing Trades
Hope is a double-edged sword in trading. While optimism can keep traders motivated, unchecked hope often leads to poor decisions. Traders driven by hope may hold onto losing positions far longer than they should, convinced that the market will eventually "come back." This refusal to cut losses can result in significant drawdowns.
The Danger of Hope
Hope clouds rational judgment. Instead of objectively assessing the market’s signals, hopeful traders anchor their decisions on a desired outcome. This emotional attachment to trades often leads to ignoring stop-loss levels or adding to losing positions, compounding the damage.
How to Overcome Hope
• Use Stop-Loss Orders: Always set stop-loss levels when entering a trade and stick to them without exception.
• Detach Emotionally from Trades: View trades as probabilities, not certainties. Focus on long-term outcomes rather than individual results.
• Review Performance Regularly: Regularly assess your trading performance to identify patterns of hopeful decision-making and correct them.
________________________________________
4. Ignorance: Trading Without Knowledge
Ignorance is the foundational pitfall that enables fear, greed, and hope to thrive. A lack of knowledge or preparation often leads traders to make uninformed decisions, increasing the likelihood of costly mistakes.
Manifestations of Ignorance
• Entering trades based on rumors or tips without independent analysis.
• Failing to understand market dynamics, such as how economic events impact prices.
• Overestimating the predictive power of a single indicator or strategy without considering the broader context.
How to Overcome Ignorance
• Invest in Education: Learn about trading strategies, technical analysis, risk management, and market fundamentals.
• Stay Informed: Keep up with economic news, market trends, and industry developments.
• Practice in Simulated Environments: Use demo accounts to refine your strategies and gain experience before risking real capital.
________________________________________
Combating the Four Horsemen: A Holistic Approach
To succeed in trading, you must address all four horsemen simultaneously. Here’s a comprehensive strategy to help you stay disciplined:
1. Create a Detailed Trading Plan: A well-thought-out plan acts as a roadmap, reducing the influence of emotional decisions.
2. Implement Strict Risk Management: Set clear rules for position sizing, stop-loss levels, and profit targets to minimize the impact of fear and greed.
3. Keep a Trading Journal: Record every trade, including the rationale behind it, the emotions you felt, and the outcome. Reviewing this journal helps you identify and correct emotional patterns.
4. Develop Emotional Awareness: Practice mindfulness to recognize when emotions are influencing your decisions, and take a step back when necessary.
5. Seek Continuous Improvement: Trading is a skill that requires ongoing refinement. Stay curious, learn from your mistakes, and adapt to changing market conditions.
________________________________________
Final Thoughts
The Four Horsemen—fear, greed, hope, and ignorance—are ever-present challenges for traders. By recognizing these emotional pitfalls and implementing strategies to mitigate their impact, you can make more disciplined and objective decisions. Success in trading is not just about mastering the markets; it’s about mastering yourself. Approach each trade with preparation, detachment, and a commitment to continuous learning, and you’ll be well on your way to conquering these formidable adversaries.

Should You Follow Michael Saylor’s BTC Moves? Let’s Think TwiceIn the crypto world, Michael Saylor is a household name. The co-founder of MicroStrategy has become one of Bitcoin’s most vocal advocates, with his company accumulating a massive Bitcoin treasury. Many view his purchases as a signal of confidence, believing that if someone with his track record is buying, it must be the right move.
But is it wise to follow his lead without question?
Let’s take a closer look at the full story and consider why doing your homework is essential before jumping in headfirst.
The Rise of Michael Saylor: Bitcoin’s Biggest Cheerleader
Saylor didn’t become a prominent figure in the crypto space until 2020, when MicroStrategy announced its first Bitcoin purchase.
Since then, he has positioned himself as a thought leader in the industry, frequently championing Bitcoin as the ultimate store of value.
However, Saylor’s newfound reputation as a financial visionary often overshadows his earlier history—a history that’s worth examining.
A Look Back: The Dot-Com Bubble and MicroStrategy’s Decline
In the late 1990s, MicroStrategy rode the wave of the dot-com boom, with its stock soaring to impressive heights. But like many other tech companies of the era, it faced a harsh reality check when the bubble burst.
MicroStrategy’s stock plummeted, and for the better part of two decades, it languished near its lows.
During this period, Michael Saylor’s reputation as a business genius took a backseat. It wasn’t until Bitcoin’s meteoric rise—and MicroStrategy’s pivot to buying and holding Bitcoin—that Saylor regained the spotlight.
Is It Genius or Just Timing?
Here’s the question we need to ask: Is Michael Saylor’s success in Bitcoin a result of brilliant foresight, or was he simply in the right place at the right time?
Bitcoin’s Performance: The timing of MicroStrategy’s Bitcoin purchases coincided with a strong bull run in the market. This rise in Bitcoin’s value undoubtedly contributed to Saylor’s renewed status as a financial savant.
Reputation Rebound: It’s easy to appear “smart” when your investments are soaring. But how much of that success is due to skill, and how much is due to external factors like market trends?
The Danger of Blindly Following Big Names
While it’s tempting to follow someone like Michael Saylor, assuming he has insider knowledge or an unbeatable strategy, history teaches us a valuable lesson:
Even Experts Can Be Wrong: Many celebrated investors have made costly mistakes, especially when riding trends. The dot-com bubble is a prime example of how quickly fortunes can change.
Market Conditions Are Key: What worked for Saylor may not work for everyone, especially as market conditions evolve. Bitcoin’s past performance is no guarantee of future results.
The Importance of Doing Your Own Homework
Instead of blindly following big names, take the time to develop your own understanding of the market. Consider:
Risk Tolerance: Are you prepared for the volatility that comes with Bitcoin and other cryptocurrencies?
Market Fundamentals: Do you understand the underlying factors driving the asset’s value?
Your Strategy: Does buying Bitcoin (or any other asset) align with your financial goals and investment timeline?
Final Thoughts
Michael Saylor’s success with Bitcoin is undeniably impressive, but it’s essential to view his story in context. His rise to prominence as a Bitcoin advocate came after years of MicroStrategy’s struggles, and much of his newfound fame coincided with Bitcoin’s broader bull market.
Rather than simply mimicking his moves, take a step back and assess your own strategy. Remember, the smartest investors aren’t those who blindly follow the crowd—they’re the ones who do their research, weigh the risks, and make informed decisions.
In trading and investing, doing your homework is the real key to success. Don’t let someone else’s narrative cloud your judgment.

Lucky vs. Repeatability: A Key Insight for Smarter TradingTrading is a journey, one filled with highs, lows, and a constant drive to improve.
Recently, I came across an idea on Podcast that truly resonated with me: the concept of luck versus repeatability.
This distinction is critical—it’s the difference between chasing short-term gains that may never happen again and developing a strategy that can deliver consistent results over time. Let me explain.
The Role of Luck: Lessons from the 2017 ICO Boom
Think back to 2017, the golden age of initial coin offerings (ICOs). When a new crypto token launched, there was a rush to buy it, often driving the price up by 10x, 50x, or even 100x in a matter of days.
For many, this was a once-in-a-lifetime opportunity to turn small investments into life-changing wealth.
But what happened next?
That strategy no longer works today. The sheer number of tokens being created—thousands daily—means money is now spread too thin for any single token to experience those explosive gains. What worked in 2017 relied on luck, not on a repeatable edge in the market.
Luck is a fascinating aspect of trading. It can make you rich once, but without the skills to preserve and grow that wealth, it often fades away as quickly as it appeared.
Repeatability: Why Market Cycles Matter
Now let’s contrast this with something far more enduring: market cycles.
Markets have always oscillated between fear and greed.
During times of greed, prices often surge beyond their intrinsic value.
Conversely, fear can drive prices below their true value. These cycles aren’t random—they’re rooted in human psychology and have been evident for decades.
For example, during bull markets, optimism often pushes valuations to unsustainable levels. Then, a sudden shock—be it economic, political, or otherwise—triggers a wave of fear, and the cycle reverses.
This ebb and flow have happened in the past, and will likely continue into the future.
This is what makes market cycles repeatable. Unlike luck, which depends on being in the right place at the right time, repeatability allows you to build a foundation for sustainable success.
Compounding: The Key to Long-Term Growth
Once you adopt a repeatable trading strategy, you unlock the power of compounding. Even with a modest starting capital, consistent returns can lead to significant growth over time. The beauty of compounding lies in its exponential nature—small gains, when reinvested, can snowball into substantial wealth.
This doesn’t happen overnight, but that’s the point. Repeatable strategies thrive on patience and discipline, allowing you to grow your account steadily and responsibly.
A Common Mistake in Pullback Trading
Let’s take a practical example: pullback trading.
Many traders focus on waiting for the price to re-test a key level, like previous resistance that could turn into support. While this approach makes sense in theory, the market doesn’t always play by the rules. Prices often fail to re-test those levels, continuing their move without offering the ideal entry point.
The solution? Plan for multiple scenarios. Understand that pullbacks can vary in depth and structure, and be prepared to adapt. Flexibility is key when applying any repeatable strategy.
A Thought to Keep in Mind
One of the most liberating truths about trading is this: the market doesn’t care about you. It doesn’t know your goals, your dreams, or your trades. Losses aren’t personal—they’re just part of the game.
The real question is how you respond to them. Each loss is an opportunity to reflect, learn, and refine your approach. Over time, this process turns a good strategy into a great one.
Final Thoughts
As traders, we’re constantly faced with choices. Should we chase the next big thing, hoping for a stroke of luck? Or should we focus on developing strategies grounded in repeatable principles?
For me, the answer is clear. While luck may occasionally play a role, it’s the repeatable strategies—those built on solid foundations—that lead to lasting success.
The next time you evaluate a trading approach, ask yourself: Is this lucky, or is it repeatable? The answer might just reshape the way you trade.

THE 2ND TRADE OF THE DAY TO HIT THE STOPAs I posted on the post on NASDAQ earlier, this is our 2nd trade of the day to reach our stop and to be in loss after we made a profitable one on OIL which I will link to this post below.
You can check them and read what I explained in NASDAQ's post about how to stick to your plan and not let your emotions take over your trading.
Follow for more!

Trading Without a Plan: The Rollercoaster I Couldn’t Get OffWhen I started trading, I thought I didn’t need a plan. I’d jump into trades, figuring I’d make it work as I went along. For a while, I got lucky. But soon, luck ran out.
The Day I Realized I Needed a Plan
It hit me after a week of back-to-back losses. Every win I’d made was wiped out, and I didn’t understand why. I wasn’t following any rules—I was just hoping each trade would work out. And when it didn’t, I felt completely lost.
What Trading Without a Plan Did to Me
-My results were inconsistent: Some days were great, but most weren’t.
-I had no risk management: I’d risk too much on one trade and too little on another.
-I felt out of control: Without a plan, I was relying on gut feelings, and they failed me.
How I Fixed It
I decided to start over. I created a simple plan, back-tested it, and promised to stick to it. I set rules for how much I’d risk and reminded myself that small, consistent wins would add up over time.
What I Learned
-A plan gives you control and consistency.
-Risk management is key—it protects your account when trades don’t go your way.
-Trading without a plan isn’t trading. It’s gambling.
If you’re struggling with inconsistency or a lack of direction, send me a DM—I’ve been there and can help. I also have a webinar this Sunday to help you build a strategy and stay consistent.
Kris/ Mindbloome Exchange
Trade What You See

Strategies for Building Confidence and Achieving SuccessDid you know that psychological factors play a pivotal role in determining trading success, accounting for nearly 50% of an individual's performance? Among the various psychological barriers traders face, the fear of making mistakes is often the most significant challenge to overcome.
This fear frequently manifests as indecision, overthinking, or even a complete avoidance of trading opportunities. When traders adopt an overly cautious approach, they risk missing out on valuable opportunities, disregarding their research, or making ill-timed decisions. Such indecision stems from a preoccupation with avoiding errors instead of focusing on making strategic moves. Consequently, this mindset can lead to outcomes that negatively impact overall performance.
To foster the confidence and decisiveness necessary for successful trading, overcoming the fear of mistakes is essential. By confronting and addressing this fear directly, traders can transition from a mindset of wariness to one characterized by calculated risk-taking—an essential quality for achieving long-term success in the markets.
Understanding the Influence of Fear in Trading
The psychological effects of fear on trading are profound, often subtly steering decision-making processes in ways that may go unnoticed. At its core, fear stems from deep-rooted concerns about various forms of loss, including financial, reputational, and self-esteem related to trading success. This fear can transform the trading experience into a high-stakes endeavor, where every potential misstep feels consequential. Such a mindset can drain mental energy and cultivate habits that hinder long-term success.
One of the most detrimental consequences of fear is "analysis paralysis." Traders find themselves caught in a loop of excessive information-seeking or waiting for the “perfect” trade setup. This over-analysis leads to crippling indecision at vital moments, resulting in missed opportunities and delayed entries that ultimately diminish potential profitability. In fast-moving market conditions, this paralysis can be particularly harmful, as chances can evaporate before traders can act.
Moreover, fear often results in a risk-averse mentality, steering traders towards prioritizing safety over growth. In an effort to minimize potential losses, they may focus on low-yield investments while avoiding riskier options that could offer greater rewards. This tendency can manifest in prematurely exiting trades to secure minor profits rather than allowing their strategies to play out to completion. Such premature exits limit potential gains and obstruct the trader’s ability to navigate complex market dynamics where well-calculated risks can yield significant rewards.
The fear of making mistakes can be particularly crippling, triggering self-doubt that leads traders to constantly second-guess their decisions. This self-doubt tends to result in erratic strategy adjustments or, in some cases, an outright withdrawal from trading altogether. Such fluctuations undermine trading discipline, especially when traders struggle to approach the markets with clarity and composure. This habitual reevaluation of strategies not only leads to lost opportunities but also fosters a lingering uncertainty about one’s trading capabilities.
Recognizing the influence of fear is critical for developing resilience. Once traders understand the role fear plays in their decision-making, they can convert paralyzing hesitation into calculated confidence, enabling them to focus on sustainable long-term growth. Embracing challenges and viewing setbacks as learning opportunities are crucial steps in enhancing one’s trading journey.
Read also:
Common Mistakes Traders Make Due to Fear
Fear can trigger a series of mistakes that disrupt a trader’s strategy and undermine their self-confidence. One prevalent error stems from impulsive selling. In the face of sudden market downturns, the anxiety of incurring losses often drives traders to liquidate their assets hastily, resulting in selling at unfavorable prices instead of staying the course or waiting for the market to rebound. For instance, during unexpected dips, some traders resort to panic-selling to quickly “cut their losses,” only to witness a rebound shortly after, transforming what could have been a temporary setback into actual financial loss. This impulsive action erodes long-term profitability and disrupts the trader’s adherence to their planned strategy.
Another common pitfall is clinging to losing positions for too long. Here, fear of acknowledging a loss blinds traders to clear exit signals, causing them to hope that a trade will turn around. Consider a situation where a trader remains invested in a stock that continues to falter despite negative indicators. The fear of conceding a “failed” investment can leave a trader trapped in a stagnant position, missing the opportunity to exit early and curtail losses. The psychological attachment to the original investment decision exacerbates this reluctance, making it difficult to detach from the trade when it no longer aligns with their investment strategy.
Avoiding profitable opportunities represents yet another fear-driven error. Traders may recognize a potentially rewarding trade but hesitate due to fear of making an erroneous decision. This hesitation leads to missed entry points, resulting in substantial gains slipping through their fingers. In the fast-paced forex market, for instance, traders who delay their entries due to apprehension often find that the moment has passed, thus limiting their earning potential. Over time, such patterns of avoidance can amplify self-doubt, creating a vicious cycle of missed chances and hesitation.
These common mistakes highlight the necessity for traders to address and manage fear proactively. Without effective strategies to navigate fear, it can become a formidable barrier to disciplined and successful trading, keeping traders trapped in cycles of lost opportunities and unnecessary losses.
Strategies for Conquering the Fear of Mistakes in Trading
To successfully overcome the fear of mistakes in trading, a combination of education, risk management, and emotional regulation is crucial. Here are several key strategies that can help traders cultivate confidence and make more decisive, well-informed choices.
Enhance Knowledge and Build Confidence
One of the most effective ways to counteract fear is by enhancing trading knowledge. A solid understanding of trading principles, strategies, and market mechanics can significantly alleviate uncertainty and mitigate anxiety. When traders are well-informed, they start to perceive mistakes as part of the growth process rather than threats to avoid. Investing time in learning both technical and fundamental analysis, market trends, and trading tools can empower traders to make decisions based on data rather than emotion.
For example, mastery of reading and interpreting candlestick patterns or understanding economic indicators provides traders with a sense of control, enabling them to make confident decisions. Moreover, staying abreast of market news and developments helps to dispel unpredictability, allowing traders to feel prepared for various scenarios.
Embrace Risk with Structured Approaches
Fear in trading is often closely tied to the possibility of loss, but risk is an inherent aspect of all trading. Implementing structured risk management strategies enables traders to engage in the market with a sense of security. Establishing Stop Loss and Take Profit levels prior to entering a trade is essential for defining acceptable risk and limiting exposure. Even if a trade doesn’t unfold as expected, knowing that losses are controlled helps reduce panic and regret.
Position sizing is another effective technique. By risking only a small percentage of their capital on each trade, traders can minimize the impact of any single loss on their portfolio. This thoughtful acceptance of risk helps shift the perspective from fearing loss toward understanding it as a part of growth. When traders recognize that not every trade will succeed, but that losses can be managed, they are more likely to approach trading with clarity and confidence.
Cultivate Emotional Discipline
Emotional discipline is vital in managing fear during trading. Mindfulness practices—including deep breathing exercises and meditation—can equip traders with the tools necessary to remain grounded, promoting calm and rational decision-making. Additionally, making a habit of journaling can aid in reflecting on trades, emotions, and outcomes, helping traders identify patterns conducive to fear-induced decision-making.
Visualization techniques are also powerful tools for emotional management. Imagining successful trades and favorable outcomes allows traders to focus on their strengths and alleviate anxiety about potential mistakes. Regular practice of visualization can foster resilience, enabling traders to confront setbacks without succumbing to fear.
Through a combination of enhanced knowledge, effective risk management, and emotional discipline, traders can cultivate greater control and confidence. By integrating these strategies, they can gradually transform their fear of mistakes into a tool for learning and improvement, enhancing their overall trading experience.
Developing a Growth Mindset for Resilience
Fostering a growth mindset in trading is essential for promoting resilience and optimizing performance. This perspective encourages traders to view mistakes not as failures but as valuable learning experiences. By adopting this approach, traders can remain motivated in the face of setbacks, analyzing their trades with objectivity rather than discouragement. They focus on identifying patterns, recognizing areas for growth, and adjusting strategies accordingly.
This transformative mindset positions errors as integral to the learning process, facilitating skill development and better decision-making over time. By perceiving mistakes as stepping stones rather than obstacles, traders can refine their strategies, ultimately boosting their confidence. This commitment to continuous improvement is crucial for attaining long-term success in trading.
Moreover, traders who cultivate a growth mindset are more resilient, allowing them to maintain focus and motivation amid market challenges. This resilience empowers them to adapt to fluctuating market conditions, drawing lessons from both successes and failures and approaching trading with renewed determination. As they embrace a growth-oriented perspective, traders become better equipped to navigate the complexities of financial markets, improving their ability to thrive amid uncertainty. Ultimately, adopting a growth mindset elevates individual performance while transforming the trading journey into an enriching process of exploration and advancement.
Read also:
Practical Tips for Cultivating Confidence in Your Trading Journey
Building confidence in trading is a gradual journey, enhanced by small yet impactful steps that promote a positive mindset and reduce fear over time. Here are some effective strategies to consider:
1. Set Achievable Goals: Break down larger objectives into smaller, achievable steps. Each small victory reinforces a sense of capability and nurtures assurance in trading skills.
2. Celebrate Wins: Acknowledge both minor and major successes to foster a sense of achievement. Celebrating milestones helps to refocus on progress rather than setbacks.
3. Use Demo Accounts: Practicing with demo accounts provides a risk-free environment for traders to test their strategies and decision-making skills. This hands-on experience enhances preparedness, boosting confidence when transitioning to live trading.
4. Commit to Consistent Practice: Regular practice is essential for building confidence. Familiarity with market scenarios and decision-making processes reduces the likelihood of fear dominating thoughts and actions.
By incorporating these practical tips, traders can gradually strengthen their confidence, ultimately paving the way for more decisive and successful trading experiences.
Read Also:
Conclusion
Fear in trading isn’t inherently detrimental; when approached effectively, it can become a valuable asset that strengthens decision-making and promotes personal growth. By recognizing and managing fear, traders can prevent it from dictating their actions and instead utilize it to maintain discipline and focus.
Strategies such as cultivating a growth mindset, achieving small victories, and engaging in low-risk environments are all effective methodologies to harness fear constructively. Each of these approaches aids in developing a resilient trading mentality, allowing traders to transform anxiety into motivation. Ultimately, by viewing fear as a catalyst for improvement rather than an impediment, traders can navigate market complexities with enhanced clarity and intent, paving the way to sustainable success.
✅ Please share your thoughts about this educational post in the comments section below and HIT LIKE if you appreciate! Don't forget to FOLLOW ME; you will help us a lot with this small contribution

How Often Do Professional Traders Actually Trade?One of the biggest misconceptions in trading is the belief that successful traders are constantly active in the market. Many imagine professionals glued to their screens, executing trade after trade, chasing every price movement. The reality is much different. Professional traders focus more on quality than quantity. They understand that in the world of trading, less is often more.
The Pitfalls of Over-Trading
Over-trading is one of the most common reasons traders struggle, particularly beginners. There’s a certain allure to being “in the action,” and it’s easy to confuse frequent trading with productivity. However, every time you take a position, you are exposing your account to risk. Without a solid reason for entering, backed by a clear trading edge, trading becomes nothing more than gambling.
Amateur traders often fall into this trap. They believe that the more they trade, the faster they will achieve their goals. But what they fail to realize is that over-trading often leads to poor decision-making, over-leveraging, and emotional trading—all of which can quickly deplete a trading account.
Professional traders take the opposite approach. They know that the market will always present opportunities, and there’s no need to chase every move. Instead, they focus on patiently waiting for setups that align with their proven strategies, where they have a clear edge. This disciplined approach minimizes unnecessary risk and maximizes profitability over the long term.
The Foundation of Success: Mastering One Strategy
Professional traders don’t rely on luck or randomness to succeed. Their consistency comes from mastering a specific trading strategy. Instead of dabbling in multiple approaches, they dedicate time and effort to understanding and refining one methodology. This gives them the ability to quickly identify high-quality setups that fit their criteria.
For example, some traders specialize in price action trading, focusing on candlestick patterns and market structure to guide their decisions. Others might rely on Elliott Waves or fundamental analysis. The key is that they don’t deviate from their chosen method, and they don’t let market noise distract them.
By sticking to one strategy, professional traders also develop a deep understanding of how it performs under different market conditions. This reduces uncertainty and helps them avoid impulsive trades, which often stem from frustration or fear of missing out (FOMO).
Patience and Discipline: The Cornerstones of Professional Trading
Patience is arguably the most underrated skill in trading. While it’s easy to talk about, it’s much harder to practice, especially for beginners who feel pressured to “do something” whenever the market moves. Professionals, however, are comfortable sitting on the sidelines for extended periods if necessary.
They understand that waiting for the right opportunity is far more valuable than being constantly active. This patience stems from experience and the knowledge that not every market movement is worth trading. Many professionals only trade a few times a week, or even less, because they’re selective about the setups they act on.
Discipline complements patience. It’s one thing to recognize a good trading opportunity, but it’s another to follow through with proper execution. Professional traders have strict plans in place, outlining their entry, stop loss, and target levels. They don’t deviate from these plans, even when emotions or market conditions tempt them to.
This disciplined approach ensures that their trading decisions are consistent and not influenced by short-term emotions or irrational impulses.
Trading Frequency: How Often Do Professionals Trade?
The frequency of trades among professionals varies, but those who achieve consistent success often lean towards less frequent trading. Swing traders, who operate on daily or 4-hour charts, might place only a handful of trades each week or even month. Positional traders take this approach even further, sometimes executing just a few well-considered trades per year.
The common denominator among these traders is their selectivity. They don’t trade for the sake of trading. Instead, every position they take is deliberate, guided by a well-defined setup that aligns with their strategy. For them, trading less frequently doesn’t mean missing out—it means focusing on high-probability opportunities while avoiding unnecessary risks.
One reason professionals favor fewer trades is their preference for higher timeframes. Daily and 4-hour charts provide a clearer, more reliable perspective on the market, filtering out the noise and unpredictability of smaller timeframes. This approach allows them to make informed, calculated decisions and avoid the stress and over-analysis that come with constant market monitoring.
The Power of Quality Over Quantity
One of the most important lessons in trading is that quality matters far more than quantity. Professional traders know this, which is why they prioritize high-probability setups over constant activity.
They view trading as a long-term game, where consistency is the goal. Every trade they take has a clear reason behind it, supported by their strategy and risk management rules. They don’t trade for excitement or to “make up” for losses. Instead, they focus on making the right decisions at the right time.
For aspiring traders, the message is simple: slow down. Don’t fall into the trap of thinking that more trades equal more success. Take the time to master one strategy, be patient for quality setups, and stay disciplined in your execution.
Conclusion
Professional forex trading is about precision, not frequency. By trading less often and focusing on high-quality setups, professionals minimize risk and maximize their chances of success. They’ve learned to embrace patience and discipline, understanding that trading isn’t about chasing every move—it’s about waiting for the right opportunities and making the most of them.
If you’re serious about becoming a successful trader, it’s time to rethink the idea that you need to be constantly active. Take a step back, refine your strategy, and remember: the best traders know when to trade and, just as importantly, when not to.

Mastering RSI: The Complete and CORRECT Way to Trade ItThe Relative Strength Index (RSI) is one of the most popular and widely used indicators in trading.
Despite its prevalence, many traders misuse it or are unaware of its full potential. RSI isn't just about identifying overbought and oversold conditions; when applied correctly, it becomes a robust tool for trend confirmation, reversals, momentum acceleration, and much more.
This guide explores how to unlock the full power of RSI and avoid common pitfalls.
What Is RSI?
Developed by J. Welles Wilder Jr., RSI measures the speed and magnitude of price changes over a specified period. It oscillates between 0 and 100, with the following traditional zones:
Above 70: Indicates overbought conditions, where the price may reverse or consolidate.
Below 30: Indicates oversold conditions, where the price may rebound or reverse upward.
However, it’s important to note that RSI above 70 or below 30 can sometimes indicate trend acceleration rather than an immediate reversal—especially in strong trending markets, discussed in #6
The real reversal signal comes after RSI crosses back below 70 (for overbought) or back above 30 (for oversold). Understanding this distinction is critical to using RSI effectively.
1. Overbought and Oversold Conditions
The classic use of RSI involves identifying overbought and oversold levels:
Overbought: RSI rises above 70 and then drops back below it, signaling potential selling pressure.
Oversold: RSI falls below 30 and then moves back above it, indicating potential buying interest.
These signals are more effective when combined with tools like support/resistance levels or trendlines.
2. Centerline Crossover
The 50-level on RSI is a reliable trend indicator:
Above 50: Bullish momentum dominates.
Below 50: Bearish momentum dominates.
Use these crossovers to confirm trends:
Enter long trades when RSI is above 50.
Enter short trades when RSI is below 50.
3. Divergences
Divergences between RSI and price can signal potential trend reversals:
Bullish Divergence: Price makes lower lows, but RSI forms higher lows.
Bearish Divergence: Price makes higher highs, but RSI forms lower highs.
These divergences highlight weakening momentum and often precede reversals.
4. RSI Patterns
RSI can form recognizable chart patterns, such as triangles, head-and-shoulders, or double tops/bottoms. These patterns often precede price moves:
Triangles: A breakout on RSI often signals a strong price move.
Double Tops : A topping pattern on RSI warns of potential price declines.
5. Failure Swings
Failure swings occur when RSI enters an extreme zone (above 70 or below 30) but fails to sustain momentum and reverses. This is a strong reversal signal and can precede significant price moves:
Bullish Failure Swing:
RSI dips below 30.
It rises but dips again, staying above 30.
RSI breaks its previous high, signaling a bullish reversal.
Bearish Failure Swing:
RSI rises above 70.
It falls but rises again, staying below 70.
RSI breaks its previous low, signaling a bearish reversal.
How to trade it:
For a bullish failure swing, enter long when RSI confirms the higher low and breaks above the previous swing high.
For a bearish failure swing, enter short when RSI confirms the lower high and breaks below the previous swing low.
6. Momentum Acceleration Strategy
While RSI is traditionally used for spotting overbought and oversold conditions, it can also identify momentum acceleration during strong trends:
Above 70: In strong uptrends, when RSI rises above 70 and stays there, it signals upward acceleration, indicating buyers are in control.
Below 30: In strong downtrends, when RSI dips below 30 and stays there, it signals downward acceleration, with sellers driving the market lower.
How to trade it:
In uptrends, treat RSI staying above 70 as a sign of strength and look for pullbacks to enter long positions.
In downtrends, use brief rebounds as opportunities to short while RSI remains below 30.
7. Multi-Timeframe Strategy
Analyzing RSI across multiple timeframes enhances accuracy:
Use the higher timeframe (e.g., daily) to identify the overall trend.
Use the lower timeframe (e.g., 1-hour) to time trade entries.
Example:
If RSI on the daily chart is above 50 (bullish trend), look for hourly RSI dips below 30 to enter long trades.
If RSI on the daily chart is below 50 (bearish trend), wait for hourly RSI to reach overbought levels above 70 to short.
Tips for Advanced RSI Use:
Adjust RSI Settings: Shorter periods (e.g., 7) make RSI more sensitive, while longer periods (e.g., 21) smooth out signals for longer-term trends.
Combine RSI with Other Tools: Use RSI alongside moving averages, Fibonacci retracements, or Candlesticks.
Risk Management: Always pair RSI signals with a stop-loss strategy to manage risk effectively.
PRO TIP: As I like to say "Trade the price, not the indicator."
Use RSI as a confirmation tool, not the main signal.
For example, a price reversal from resistance or a bullish engulfing candle becomes far more reliable when backed by RSI signals.
Conclusion
RSI is far more versatile than many traders realize. While it’s traditionally used for identifying overbought and oversold levels, strategies like momentum acceleration and failure swings add depth to its utility. By combining RSI with centerline crossovers, divergences, multi-timeframe analysis, and chart patterns, traders can pinpoint entries, reversals, and momentum shifts with more precision and trade more confidently.
Key Takeaways:
- RSI staying above 70 or below 30 in trends signals momentum acceleration.
- Failure swings offer reliable reversal signals when RSI breaks key levels.
- Combining RSI strategies with other tools and proper risk management leads to more confidence

How Cryptocurrencies Are Becoming Everyday Asset?Hello, Traders!
Bitcoin continues to trend upward! Do you know Satoshi Nakamoto's original idea for the leading crypto? It is a fact that Bitcoin was first referred to as “electronic cash,” highlighting its purpose as a means of everyday payment.
When BTC first appeared in 2009, its creator, Satoshi Nakamoto, had a clear goal: to create a digital currency that anyone could use to make payments without relying on banks or governments. It was meant to be fast, borderless, and simple – a way to take control of your money.
Over time, Bitcoin, and other cryptocurrencies have become powerful trading and investing assets. However, using crypto for daily spending is still more challenging than Satoshi had imagined. Let’s discuss how crypto is moving closer to everyday money and the remaining challenges 👇🏻
Cryptocurrencies Were Meant to Be…
Yes, Bitcoin was originally designed to function as digital cash. Its peer-to-peer nature allowed users to send value globally with speed and relatively low fees. However, several practical limitations emerged as adoption grew, making it less ideal for everyday payments.
⚫ One of the primary challenges is BTC's transaction scalability. The limited block size and network throughput result in longer confirmation times and higher fees during periods of network congestion, which is impractical for minor or routine transactions.
⚫ Additionally, BTC's volatility in value introduces uncertainty in its usability as a stable payment method. For daily purchases, consumers, and merchants often prefer assets with stable value to avoid fluctuations that can occur even within minutes.
⚫ Another significant barrier is the lack of universal regulation around crypto. Bitcoin and other digital assets are not legally recognized as payment methods in many regions, limiting their usability in retail and everyday transactions. Merchants may hesitate to accept cryptocurrencies due to unclear tax policies, legal restrictions, or the absence of a consistent framework governing their use.
Because of these limitations, stablecoins like USDT (Tether) and USDC (USD Coin) have gained popularity as payment tools in the cryptocurrency ecosystem. These assets offer the same advantages of blockchain-based transactions—speed, security, and borderless functionality—while addressing Bitcoin's volatility and high transaction costs. The transaction fees on networks such as Tron (for USDT) are generally much lower, making them more cost-effective for everyday payments.
So, this has created a shift: while Bitcoin remains a store of value and investment asset, stablecoins have become the go-to choice for routine transactions, offering practicality without compromising the benefits of cryptocurrency.
A Growing Trend
For newcomers, paying online with cryptocurrencies can feel 🤏🏻 overwhelming. It requires a solid understanding of blockchain transactions, choosing the correct network, and accounting for native transaction fees.
In contrast, transactions within exchanges are significantly simpler. When sending funds between accounts on the same platform, the process is typically automated, eliminating the need to calculate transaction fees manually. This ease of use has made exchanges a preferred environment for many crypto users, particularly those still learning the technical side of blockchain.
A growing trend in the market recently has been exchange-issued crypto cards, which are designed to simplify payments and reduce fees. With these cards, users can seamlessly pay using cryptocurrency without technical expertise.
Many crypto cards go beyond just simplifying payments—they also offer attractive perks, such as cashback in cryptocurrency. For instance, some cards reward users with digital assets for their spending.
One of the options worth noting is the WhiteBIT Nova , designed to provide a streamlined experience for both newcomers and seasoned crypto users. Unlike many standard offerings, this card combines simplicity with tangible benefits: no opening or service fees, customizable cashback, and convenient integration – ideal for those already using an exchange account, it bridges the gap between trading and real-world purchases effortlessly.
Conclusion
Cryptocurrency is increasingly becoming part of our everyday lives. Whether it’s for trading, investing, or simple payments, the tools available today are making digital assets more accessible than ever. It’s up to you to decide how best to use them—what currencies to hold, what payment methods suit your lifestyle, and how to manage transfers effectively.
As the crypto market continues to grow and evolve, its influence is reshaping how we think about money, payments, and even financial independence. Staying informed and adapting to these changes is essential to keeping up with the times in this fast-moving, innovative space.

Hunting for the Next 1000X Cryptocurrency:A Statistical AnalysisThe cryptocurrency world is a gold rush for dreamers chasing life-changing gains. With stories of tokens skyrocketing in value, the appeal is undeniable. But here’s the reality: with over 5,300 new tokens hitting the market daily in 2024, as reported by CoinGecko, your odds of finding the next PEPE, BONK, or SHIBAINU are incredibly slim. Most new cryptocurrencies fail within months, and many are scams designed to drain your wallet. Let’s break down the numbers and the challenges of uncovering a gem amidst the flood.
The Numbers: New Tokens and Their Survival Rate
By April 2024, over 540,000 tokens had already been launched — a staggering number. Yet, very few will ever succeed. Here’s a snapshot of the harsh realities:
Failure Rates: Around 80-90% of new tokens fail in their first year. This is often due to lack of purpose, poor adoption, or outright abandonment.
Rug-Pulls: A worrying number of tokens—about 10-15%, based on data from CertiK—are rug-pulls. This means developers vanish after pocketing investors' money.
Breakout Tokens: The odds of hitting it big are microscopic. In 2023, fewer than 50 tokens out of 830,000 reached 1000X growth, showing just how rare these success stories are.
What Does It Take to Achieve 1000X Growth?
For a token to grow 1000X, its market cap needs to multiply by 1,000. Achieving this requires a combination of:
Early Entry: You must buy in at the lowest prices, often during presales or right after launch.
Massive Hype or Demand: Whether through meme-driven excitement or actual utility, the token must capture the market’s attention.
Smart Tokenomics: Low supply or deflationary mechanisms can push prices sky-high.
The Odds of Finding the Next Moonshot
Let’s do some quick math:
Total Tokens Launched in 2024: With 5,300 tokens a day, around 2 million tokens were launched this year.
Success Rate for 1000X Growth: If fewer than 50 tokens reached 1000X in 2023, your chance of finding one is about 0.0026%, or 1 in 38,000.
The jump to 10,000X is even harder, requiring not just perfect timing but incredible luck and sustained demand.
In short, it’s like playing the lottery but with higher stakes and more scams.
The Risks You’re Up Against
Rug-Pulls and Scams
Some tokens are outright traps. Be wary of:
- Anonymous teams with no verifiable background.
- Projects making outrageous promises.
- Lack of liquidity locks or audits.
Market Overload
With millions of tokens flooding the market, standing out is harder than ever.
Speculative Hype
Even promising projects can implode if their growth is built solely on speculation, as seen with many memecoin fads.
How to Improve Your Odds
While the odds are stacked against you, there are ways to tip the scales slightly in your favor:
- Do Your Homework: Look for projects with clear value, experienced teams, and a real use case.
- Follow Trends: Emerging sectors like AI, GameFi, or decentralized sience are hot spots for innovation.
- Track Launch Platforms: Presale platforms and launchpads can be a good source of vetted tokens.
- Diversify: Spread your investments across multiple tokens to lower risk.
- Set Limits: Never invest more than you’re prepared to lose.
Final Thoughts
Chasing the next 1000X token in today’s crowded crypto market is an uphill battle. While success stories like PEPE make headlines, the reality is that most tokens fail, and many investors lose money. The key is to stay realistic, do thorough research, and focus on long-term, informed decisions. The crypto market rewards patience and strategy far more than blind luck. Good hunting!

Comprehensive Guide to Bull and Bear Flag PatternsBull and bear flag patterns are some of the most reliable and widely used chart patterns in technical analysis.
These patterns are particularly effective for traders who prefer trading with the trend, offering clear entry and exit points.
They appear frequently in trending markets and represent short consolidations before the trend resumes.
In this guide, we’ll cover the characteristics of bull and bear flags, trading strategies, and how to enhance your flag trading using multi-timeframe analysis.
What Are Bull and Bear Flag Patterns?
Bull and bear flags are continuation patterns, meaning they signal the potential for a price move to continue in the direction of the prior trend after a brief consolidation or retracement.
Bull Flag: This pattern occurs during an uptrend. After a sharp rise in price (the flagpole), the price begins to consolidate within a downward-sloping channel (the flag). A breakout to the upside typically follows, continuing the trend.
Bear Flag: In a downtrend, after a strong decline (the flagpole), the price consolidates in an upward-sloping channel (the flag). When the price breaks downward, it continues the downtrend.
These patterns are valuable for traders as they provide clear entry signals when the price breaks out of the flag's consolidation range.
Anatomy of a Flag Pattern
The flag pattern consists of two main components:
The Flagpole: This is the sharp price movement that occurs in the direction of the trend. It signifies strong momentum and establishes the direction in which the trend is moving.
The Flag: The flag is a period of consolidation or retracement that follows the flagpole. The price moves within parallel or slightly converging trendlines and typically retraces about 30% to 50% of the flagpole. The flag represents a pause in the market before the trend resumes.
Key Characteristics:
Bullish Flag: Occurs in an uptrend, and the consolidation takes place in a downward-sloping channel.
Bearish Flag: Occurs in a downtrend, and the consolidation takes place in an upward-sloping channel.
Volume (if you trade Crypto or stocks) tends to decrease during the consolidation phase and increases significantly at the breakout point, confirming the continuation of the trend.
Trading Strategies for Bull and Bear Flags
While bull and bear flags are relatively simple to identify, using different strategies can help enhance the effectiveness of trades. Here’s a breakdown of the most effective approaches to trading these patterns:
1. Breakout Strategy
The breakout strategy is a straightforward approach that traders use to enter a position when the price breaks out of the flag's consolidation. This marks the continuation of the trend and offers a high-probability setup.
Entry: Enter the trade when the price breaks above the upper trendline of a bull flag or below the lower trendline of a bear flag.
Stop-Loss: Place the stop just outside the flag’s opposite boundary (below the flag for bull flags or above for bear flags).
Take-Profit: Measure the length of the flagpole and project it from the breakout point. This will give you a target for where the price could potentially move.
2. Multi-Timeframe Strategy
The multi-timeframe strategy involves using multiple timeframes to analyze the flag pattern. This strategy can provide a more robust confirmation for entering the trade, as it gives you a broader perspective on the overall trend.
Higher Timeframe Analysis: Begin by analyzing a higher timeframe (e.g., the daily chart). Look for a strong trend, either bullish or bearish, and identify if a flag pattern is forming within this trend.
Lower Timeframe Confirmation: Once the pattern is identified on the higher timeframe, zoom in on a lower timeframe (e.g., the 1-hour or 4-hour chart) for precise entry points. Look for the price to break out of the flag pattern on the lower timeframe, confirming the trend continuation.
Why Use This Strategy?
Multi-timeframe analysis reduces the risk of false breakouts by confirming the broader trend on a higher timeframe.
It allows you to refine your entries by using a lower timeframe for greater precision.
Note:
A critical benefit of this strategy is its ability to significantly enhance the risk-to-reward (R:R) ratio, with the example presented achieving an impressive 1:5 ratio. This means that for every unit of risk taken, the potential reward is five times greater—a highly efficient use of capital and risk management.
3. Pullback Entry Strategy
The pullback entry strategy offers a more conservative approach to trading flag patterns. Instead of entering at the initial breakout, this strategy waits for a pullback toward the breakout level to confirm the trend’s continuation.
Entry: Enter the trade after the breakout has occurred but wait for the price to pull back to the flag’s trendline. This pullback gives you a better risk-to-reward ratio.
Stop-Loss: Place the stop just below the flag’s trendline for a bull flag or above it for a bear flag.
Take-Profit: As with the breakout strategy, project the flagpole's length from the breakout point for your target.
When Not to Trade Flag Patterns
While flag patterns are reliable, they are not always guaranteed to work. There are specific conditions when you should avoid trading them:
Choppy or Sideways Markets: Flags perform best in trending markets. If the market is choppy or moving sideways, flag patterns are less likely to lead to a strong breakout.
Weak Flags: If the flag's consolidation is too broad or the market loses momentum during the consolidation, the breakout may be weak or fail altogether.
Conclusion
Bull and bear flag patterns are essential tools in any trader's toolkit, offering high-probability setups in trending markets.
By understanding how to spot them, applying different trading strategies, and incorporating multi-timeframe analysis, traders can enhance their chances of success.
Final Tip: Always combine flag patterns with good risk management techniques, such as proper stop-loss placement and positive risk:reward.

Set-and-Forget Trading: A Path to Consistency and FreedomForex trading often feels like a full-time job, demanding constant attention and endless decision-making. However, the set-and-forget trading strategy offers a structured and stress-free alternative, allowing you to trade confidently while enjoying the freedom to focus on other aspects of life. Here, we’ll refine the essence of this strategy and show how it can lead to consistent, profitable results.
What Is Set-and-Forget Trading?
Set-and-forget trading is a disciplined approach where you analyze the market, identify key levels, place your trades with defined parameters, and step away. This method prevents over-trading, minimizes emotional interference, and fosters a calm, calculated mindset.
This strategy is especially appealing for traders balancing other responsibilities, offering the dual benefit of effective trading and time efficiency.
Mastering Key Market Levels
At the core of set-and-forget trading lies the identification of significant price levels, such as support, resistance, and trendlines. These levels act as your map for setting entries, stop-losses, and profit targets. The precision of your analysis at this stage determines the success of your strategy.
Key levels are not random—they are where the market historically reacts, making them the most probable zones for price movement.
Avoiding Common Pitfalls:
While set-and-forget is a powerful approach, it’s not without its challenges. Overanalyzing after placing your trades can lead to unnecessary adjustments, which defeats the purpose of this strategy. Similarly, setting unrealistic expectations can lead to frustration—accept that no strategy is perfect, and focus on long-term profitability. Finally, proper risk management is non-negotiable . Always adhere to your predefined stop-loss and position-sizing rules to protect your capital.
Placing Trades With Confidence
Once you’ve identified the key levels, craft a clear plan for each trade. Define your entry point, stop-loss, and take-profit levels. Limit orders are the cornerstone of this strategy, ensuring your trades are executed precisely at your chosen levels, even when you’re not actively watching the market.
This planning requires discipline but reduces the risk of hasty, emotionally charged decisions.
The Art of Letting Go
Perhaps the most challenging part of set-and-forget trading is stepping away from the charts after placing your trades. However, this step is crucial for maintaining discipline and avoiding impulsive changes to your strategy. Trust your analysis and let the market unfold naturally.
By walking away, you also protect yourself from overanalyzing minor fluctuations, which can lead to emotional and costly adjustments.
Why This Approach Works
The power of set-and-forget lies in its simplicity and alignment with key trading principles:
Emotional Discipline: By predefining trades, you avoid the temptation to deviate from your plan.
Time Efficiency: Spend less time glued to the screen and more time pursuing other goals.
Consistency: Trading from key levels with a clear plan fosters long-term profitability.
Handling Challenges With Grace
Even with set-and-forget, it’s vital to remain realistic. Not every trade will be a winner, and patience is required. Proper risk management, such as adhering to your stop-loss and avoiding excessive position sizes, ensures that even losses are manageable.
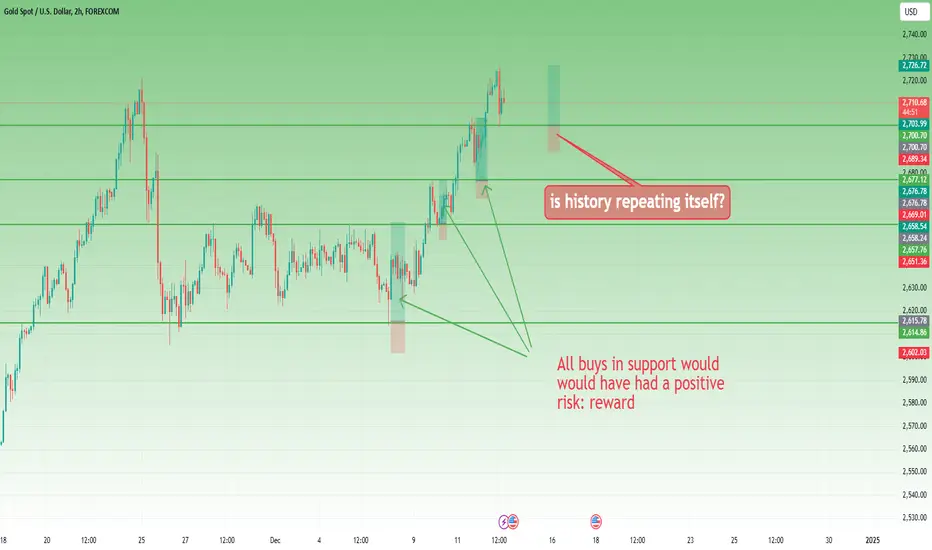
Another benefit of this approach is that when trades at key levels don’t hit their targets, price often rebounds or retraces, providing opportunities to minimize losses or exit at breakeven.
Final Thoughts
Set-and-forget trading is a mindset as much as it is a method. It requires patience, discipline, and trust in your strategy. By focusing on key levels, pre-planning trades, and letting the market work for you, you gain not just trading profits but also mental clarity and freedom.
If you’re ready to simplify your trading and embrace consistency, set-and-forget could be the transformative strategy you’ve been seeking.

Proffesional traders ONLY use limit orders. Here is whyIn the world of trading, precision, patience, and discipline set successful traders apart. One of the most powerful tools professional traders use to maintain this edge is the buy and sell limit order. These orders allow you to execute trades at predefined price levels, ensuring strategic and calculated decisions. Here’s why buy and sell limit orders are a cornerstone of professional trading—and why they should be part of your strategy.
1. Trade Only at Key Market Points
Limit orders enable you to focus on trading at strategic price levels, such as areas of strong support or resistance. These key market points are where the highest probability setups occur, giving you a distinct advantage over chasing prices or trading impulsively.
Why This Matters:
High-probability trades: Entering at key levels increases the chances of success, as these zones often align with institutional activity and large orders.
Better pricing: Waiting for the price to come to you ensures an optimal entry, increasing the quality of your trades.
For example, instead of buying as the price skyrockets, a professional trader sets a buy limit order at a pullback to a support level, ensuring they enter at a lower price with less risk.
2. If a Trade Is Not There, It’s Not There
Limit orders enforce discipline by ensuring you only trade when market conditions align with your plan. This approach prevents you from forcing trades in suboptimal conditions, a common mistake among less experienced traders.
How This Helps:
Avoid over-trading: Limit orders eliminate impulsive decisions and help you stick to your strategy.
Stay disciplined: You’ll only take trades that meet your criteria, ensuring consistency in your approach.
By accepting that “if a trade is not there, it’s not there,” you avoid unnecessary losses and save capital for high-quality setups.
3. Positive Risk-Reward Ratio Becomes Easier
Trading from key levels using limit orders naturally leads to favorable risk-reward ratios. By entering at strategic points, you can minimize your risk while maximizing your potential reward.
Why Limit Orders Are Ideal for Risk-Reward:
Tighter stop-loss placement: Key levels provide logical areas for stops, reducing the distance between your entry and stop-loss.
Larger profit potential: Trading near support or resistance increases the likelihood of significant price movements in your favor.
For instance, placing a sell limit order at a resistance level allows you to set a stop-loss just above the level while targeting a support zone below, often achieving a risk-reward ratio of 1:3 or higher.
4. Avoiding False Breakouts
One of the biggest drawbacks of trading breakouts is the prevalence of false breakouts, where the price moves briefly beyond a key level, triggers trades, and then reverses sharply. Limit orders help you sidestep this trap.
Why Limit Orders Are Better Than Breakout Trading:
False breakout protection: Limit orders wait for the price to return to a key level, avoiding impulsive entries.
Stronger validation: Entering at key levels ensures you are aligning with institutional activity rather than being caught in speculative moves.
Improved money management: Breakout trades often require wider stops, reducing efficiency, while limit orders allow for tighter, more strategic risk management.
By using limit orders, you position yourself to benefit from price reversals instead of getting caught in false moves.
5. Trade Without Constant Monitoring
One of the most practical benefits of limit orders is that they free you from having to watch the charts 24/5. Once you’ve done your analysis and identified key levels, you can set your limit orders and step away.
Benefits of Limit Orders for Time Management:
Reduced stress: No need to monitor every tick of the market; your orders are automatically executed when the price reaches your level.
Efficient use of time: You can focus on other tasks, projects, or simply enjoy your day while the market works for you.
Confidence in your plan: Trusting your analysis and pre-set limit orders reduces emotional strain, allowing you to trade with peace of mind.
This approach not only improves your time management but also enhances your overall trading performance by minimizing emotional decision-making.
6. Opportunity for Exit on B.E. or with Minimal Loss
When trading from key zones such as support or resistance, even if your target isn't reached and the market reverses and breaks the level, there’s often a rebound (in the case of support) or a retracement (at resistance). This price action typically gives you time to reassess the situation and close the trade at break-even or with a minimal loss.
Benefits of This Feature:
Reduced Losses: Limit orders placed at key zones give you a second chance to minimize risk if the market doesn’t go your way.
Improved Decision-Making: The retracement/rebound period allows you to evaluate the market's behavior calmly rather than reacting impulsively.
Enhanced Flexibility: You gain the opportunity to adjust your strategy in response to evolving price action.
This adds another layer of control and protection to your trades, reinforcing why limit orders are a powerful tool for professional traders.
7. The Best Way to Trade with Discipline and Control
Limit orders are the ultimate tool for maintaining discipline and control in your trading. By setting your orders in advance, you remove the emotional biases and impulsive behaviors that often lead to losses.
Why Limit Orders Promote Discipline:
Structured approach: They force you to pre-plan your trades, ensuring every decision aligns with your strategy.
Eliminate over-trading: By setting specific entry points, you focus only on the best opportunities.
Consistent execution: Limit orders ensure you enter trades based on logic and analysis, not gut feelings.
Conclusion: The Professional’s Tool for Success
Buy and sell limit orders are more than just a trading tool—they are a mindset. They embody the patience, discipline, and precision that define professional trading. By focusing on key levels, avoiding false breakouts, and trading with a positive risk-reward ratio, limit orders help traders achieve consistent and profitable results.
To recap, here’s why professional traders rely on limit orders:
- They ensure trades occur only at key market points.
- They prevent impulsive and undisciplined trading.
- They naturally enhance your risk-reward ratio.
- They protect you from the traps of false breakouts and poor money management.
- They free up your time and reduce stress by removing the need for constant market monitoring.
If you’re serious about improving your trading, start incorporating buy and sell limit orders into your strategy today. They’re not just a tool—they’re the foundation of a professional, disciplined approach to the markets.
Lessons from the Hawk Tuah Meme Coin SagaThe recent collapse of the Hawk Tuah meme coin offers several valuable lessons for crypto investors, particularly regarding the risks associated with celebrity-backed tokens and meme coins. Here's a comprehensive look at the event and its implications:
What Happened?
Haliey Welch, a viral internet personality known as the “Hawk Tuah Girl,” launched her cryptocurrency, HAWK, on the Solana blockchain. Initially, the token skyrocketed in value, reaching a market cap of nearly $490 million within hours. However, the excitement was short-lived as the coin's value plummeted by over 90% shortly after its peak, resulting in massive losses for investors.
Investigations revealed suspicious activity, including a small group of wallets controlling 80-90% of the token's supply. These entities quickly sold their holdings after the price surged, a tactic commonly referred to as a Rug- Pull .
Welch has faced accusations of orchestrating the scheme, although she denies any wrongdoing
Key Takeaways for Investors
1. Avoid Hype-Driven Investments
Meme coins often rely on hype rather than fundamentals. The initial surge in HAWK’s value was fueled by Welch’s popularity and aggressive promotion, which masked its lack of intrinsic value.
2. Beware of Celebrity Endorsements
Celebrities frequently endorse or launch crypto projects, but their involvement doesn't guarantee legitimacy. Past incidents with figures like Kim Kardashian and Floyd Mayweather highlight a recurring pattern of failed celebrity-endorsed tokens
3. Understand the Token’s Structure
The dominance of a few wallets in HAWK’s ecosystem made the token vulnerable to manipulation. Always investigate the tokenomics of a project , including the distribution and control of its supply.
Recognize the Signs of a Rug Pull
- Rapid price surges followed by sharp declines
- Concentrated ownership by insiders or “snipers”
- Lack of a clear use case or roadmap
- Exercise Caution with New Tokens
*Newly launched coins are highly volatile and prone to exploitation. In the case of HAWK, the lack of regulatory oversight compounded the risks
Lessons for Regulators
The Hawk Tuah incident underscores the need for stricter oversight of crypto markets, especially celebrity-backed projects. While decentralized finance (DeFi) promotes inclusivity, its openness can be exploited. Regulators like the SEC are already investigating such cases, which may lead to stricter rules on token launches and promotions
Conclusion
The collapse of the Hawk Tuah coin serves as a cautionary tale about the dangers of speculative investments in unregulated markets. While the allure of quick profits can be tempting, due diligence, skepticism of promotional tactics, and an understanding of market mechanics are crucial for navigating the crypto space.
Investors should remember: if something sounds too good to be true, it probably is . For long-term success in crypto, focus on projects with robust fundamentals, transparency, and proven utility.

When Investing Turns into GamblingThe distinction between high-risk investing and gambling is a nuanced topic that draws considerable debate among financial experts and everyday investors alike. At what point does a bold investing strategy transition into a gamble? This question is particularly pertinent as more individuals explore the world of trading, often with little experience or understanding of complex financial instruments.
Understanding Gambling
Gambling, at its core, involves wagering something of value on uncertain events with the hope of attaining a greater reward. The term is rooted in the Old English word ‘gamenian,’ which conveys the idea of playfulness or merriment. While this historical context hints at leisure, modern associations with gambling primarily lean towards casino games and sports betting—activities that often prioritize entertainment over profit.
Legally and socially, gambling is characterized by three fundamental elements: consideration (the wager), chance, and prize. It is primarily the element of chance that fundamentally separates gambling from investing as a disciplined practice.
Read Also:
Characteristics of High-Risk Investing
High-risk investing manifests in various forms and is typically characterized by volatile assets, leveraged positions, and intricate financial tools. Examples include CFDs, options trading, and short-selling. While these strategies can yield impressive returns, they come with heightened risks and the possibility of substantial losses, particularly for those who are inexperienced.
The key difference between gambling and investing generally hinges on skill versus chance. Professional CFD traders may acknowledge the unpredictability involved but can also apply strategic approaches to increase their chances of success. This skill component is often what investors cling to, differentiating their methodical approaches from pure gambling.
Read Also:
Psychological Drivers Behind High-Risk Investing
The psychological dynamics involved in high-risk investing bear significant similarities to gambling behaviors. A prominent factor is the dopamine rush associated with successful trades—an exhilarating feeling that can become addictive. While such responses are often embraced in gambling environments, they must be regulated in investing to prevent detrimental decision-making.
Fear of Missing Out (FOMO) also plays a crucial role in driving investors toward risky trades. In our social media-saturated era, tales of sudden wealth can instigate impulsive behaviors, propelling individuals into investments without adequate research or risk assessment.
Overconfidence bias is another pitfall; novice investors may overestimate their ability to navigate markets, often resulting in shallow analysis and misguided decisions. Coupled with loss aversion—the tendency to feel losses more acutely than equivalent gains—these cognitive biases can lead to irrational choices, mirroring behaviors common in problem gambling.
Read Also:
Perception vs. Reality
The interplay between perception and reality complicates the discourse around high-risk investing. Many individuals erroneously equate their financial activities solely with mastery over skill and chance. However, overconfidence can mislead beginners into adopting complex strategies without a robust understanding of the underlying mechanics. While they may perceive their actions as investments, outsiders may recognize them as reliance on sheer luck, categorizing such behaviors as gambling.
Emerging asset classes, like cryptocurrencies, add another layer of complexity. Their relative novelty means that market participants often lack the historical data necessary to inform sophisticated strategies, resulting in some deeming these investments as mere gambling.
The Importance of Self-Awareness
Ultimately, self-awareness emerges as a crucial aspect of distinguishing between high-risk investing and gambling. Understanding personal motivations is vital; the riskiness of an asset alone does not dictate its categorization. Allowing emotions to override a carefully charted financial strategy is indicative of gambling-like behavior. Similarly, employing untested or misunderstood strategies can signal a drift away from genuine investment practices toward a gambling mentality.
Read Also:
Final Thoughts
In the realm of finance, it is essential to maintain a clear bifurcation between calculated investing and haphazard gambling. Self-awareness, comprehensive research, and a disciplined approach to risk management are key to ensuring that individuals engage in sound investment practices, rather than crossing over into the unpredictable territory of gambling. Individuals must strive to understand the nuances of their financial choices, recognizing when the line is blurred and committing to informed decision-making. Only then can they navigate the market landscape with confidence and prudence.
Read Also:
✅ Please share your thoughts about this article in the comments section below and HIT LIKE if you appreciate my post. Don't forget to FOLLOW ME; you will help us a lot with this small contribution.

Breaking the Losing Spiral and Embracing Growth in TradingTrading can be exhilarating, but it also has its emotional traps.
In this post, I’ll guide you through understanding a common psychological pitfall—the spiral—and how you can develop the mindset of a winning trader. Whether you’re new to trading or looking to refine your approach, cultivating the right mental framework is crucial for long-term success.
The Dangerous Spiral
Let’s start by exploring what I call the spiral. This negative feedback loop often begins with a single, big, unexpected loss. Losses are an inevitable part of trading, but how you respond to them defines your trajectory as a trader.
Here’s how the spiral unfolds:
1. The Trigger: A Big Loss
A significant, unexpected loss can shake your confidence. Instead of pausing and reassessing, many traders feel an overwhelming urge to recover their losses immediately.
2. Revenge Trading
Driven by fear and frustration, you might rush into trades without your usual standards for quality. You lower your threshold and settle for mediocre setups, hoping to win back your money quickly.
3. Secondary Losses
These poorly planned trades often lead to further losses. Your equity curve, which may have been steady or climbing, begins to drop in sharp, painful steps.
4. Desperation
As losses mount, desperation sets in. Your judgment becomes clouded, and you’re no longer trading with a clear, strategic mindset.
6. Diminishing Accuracy
Emotional decision-making reduces your accuracy. Trades that might once have had a 70% success rate drop to 50% or even lower.
7. Bigger Losers, Total Losses
The combination of reduced accuracy and poor setups leads to larger average losses. Your total losses grow, and your account balance shrinks.
8. Loss of Confidence and Account Size
At this stage, the psychological damage is profound. You’re not just losing money—you’re losing belief in yourself. If your account balance drops significantly, the challenge of recovery becomes even steeper. For instance, a 50% account loss requires a 100% gain just to break even.
This spiral is self-inflicted, but the good news is that it’s avoidable.
Reversing the Cycle: The Positive Feedback Loop
Instead of spiraling downward, let’s focus on creating a positive feedback loop. This approach builds momentum in the right direction and fosters long-term growth:
1. High-Accuracy Trading
Prioritize quality over quantity. Only take trades that meet your well-defined criteria. This discipline lays the foundation for success.
2. Strong Profit-to-Loss Ratio
By focusing on high-quality setups, your average winners should outweigh your average losers. This creates a cushion for occasional losses and sustains your confidence.
3. Confidence Boost
Consistent, profitable trading reinforces your belief in your strategy and decision-making.
4. Scaling Up
With growing confidence and a larger account balance, you can responsibly increase your trade size. This amplifies your profits while maintaining discipline.
5. Compounding Success
The cycle repeats: High accuracy leads to higher profits, greater confidence, and continued account growth.
Key Takeaways for Building a Winning Mindset
Being a successful trader isn’t just about technical skills or aggressive strategies—it’s about mastering your emotions and mindset. Here are some tips to keep you on the path to growth:
Accept Losses as Part of the Process
Losses are inevitable. Instead of reacting emotionally, treat them as opportunities to learn and improve.
Step Back After a Loss
When you experience a big loss, resist the urge to trade immediately. Take a break to regain clarity and recalibrate your approach.
Maintain High Standards
Never compromise on the quality of your trades, even under pressure. Sticking to your strategy is critical for long-term success.
Focus on the Long Game
Trading is a marathon, not a sprint. Avoid the trap of trying to recover losses in a single day or trade.
Celebrate Small Wins
Recognize and appreciate your progress, no matter how small. Every step forward reinforces a winning mindset.
The Final Word
The mindset of a winning trader is built on discipline, patience, and emotional resilience. By avoiding the spiral and fostering a positive feedback loop, you can grow your trading account steadily and confidently. Remember, success in trading isn’t just about making money—it’s about staying in the game long enough to let your skills and strategy pay off.

THE CYCLE OF MARKET EMOTIONSWhen delving into the world of trading, one pivotal aspect often overlooked is psychology. In trading, we engage in two distinct psychological aspects: the collective psychology of the trading community and our unique mindset as individual traders. While we cannot change the psychology of the masses, understanding it is crucial. Equally important is the necessity to reflect on and, if needed, adjust our own psychological framework. In this article, we will primarily focus on the psychology of the individual trader.
The Complex Nature of Trading
As an aspiring trader, sooner or later, you will come to appreciate that the intricacies of trading go far beyond merely analyzing charts and fundamental data. It’s a common belief that a majority of new traders—around 80%—will face failure early on. If you haven’t experienced failure yet, consider yourself fortunate, and prepare for the inevitable realization: many of your trading challenges stem from within.
One of the most significant emotional hurdles traders face is fear—fear of missing opportunities, fear of losing money, fear of leaving profits untapped, and fear of making mistakes. If you wish to thrive in this field, overcoming these fears is essential.
The Weight of Fear
Throughout our lives, we’re conditioned to avoid being wrong and to strive to secure our finances. However, trading operates on a different frequency. Many traders dedicate their time solely to identifying promising trades. Once they enter a position, they often experience a tumultuous rollercoaster of emotions, ranging from anxiety over potential losses to elation during winning streaks. It’s vital to recognize that successful trading is not only about these emotions but about keeping them in check.
Experienced traders understand the fundamental role psychology plays in trading; conversely, novices may overlook or dismiss it. I aim to help you develop a better understanding of emotional management as a trader.
Prioritizing Survival
Before anything else, as a trader, you must prioritize staying in the game; survival comes first. Research shows that approximately 90% of traders fail before they ever achieve consistent profits. To belong to the successful 10%, you must adopt a different mindset.
It’s unfortunate that many individuals are drawn to trading due to the thrill it offers—the allure of quick profits with little initial capital. For such traders, the thrill often leads to reckless decisions, with no concrete strategy in place. Instead of following a thorough trading plan that accounts for risk management, they bounce from one tip to another, often neglecting the discipline crucial for success.
The Pitfalls of Emotional Trading
Trading motivated purely by excitement leads to poor decisions characterized by high risk and unfavorable odds. When a loss occurs, many traders seek external factors to blame: the market’s fluctuations, manipulation by large players, or insider trading. However, the harsh reality is that the primary person to be held accountable is you—the trader.
Accepting personal responsibility is a fundamental step towards becoming a successful trader.
Essential Ingredients for Trading Success
To navigate the path of successful trading, you will need to master four critical components: psychology, market analysis, a robust trading plan, and effective money management. In this exploration, we will focus primarily on the psychological component.
Read Also:
The Value of Psychological Awareness
People often ponder whether my background in psychology has contributed to my trading success. The answer is yes. Psychology equips me with the ability to face reality and introspect regarding my emotional responses. This training has taught me that dwelling on past mistakes or feeling regretful is unproductive—what truly matters is taking actionable steps for improvement.
Learn to view each trade as an isolated event, unaffected by previous or subsequent trades. Losses are an inevitable part of trading, and embracing them as a reality is crucial for long-term success.
Understanding Your Trading Style
It’s essential to reflect on your trading personality. Are you a discretionary trader—one who relies on instinct and external inputs such as news articles, broker tips, or peer opinions? Or are you a mechanical trader—someone who follows a well-defined trading plan, adapting it slowly over time while avoiding changes during open trades?
Identifying your style will not only help you understand your reactions to the stresses of trading but will also guide you in crafting a suitable trading plan.
Discovering the Secret to Success
Every trader grapples with the pressures of this challenging profession. Yet, what gives you an edge in this competitive landscape filled with seasoned professionals equipped with advanced tools? The answer lies within you.
Your perception shapes your trading experience. Only you can gauge how you will respond to criticism, endure losing streaks, or celebrate significant wins. Your beliefs and values dictate your attitude toward money, risk, excitement, and perseverance. Becoming aware of these elements is the first step toward mastery—controlling or, if necessary, transforming them.
Read Also:
Crafting Your Trading Plan
To better understand your trading persona, consider maintaining a trading journal. Document your emotional responses, trading behaviors, and overall experiences. This exercise will reveal vital insights about whether you're suited for a specific trading style—be it investment, day trading, or longer-term strategies—and help you craft an appropriate trading plan that aligns with your unique personality.
Read Also:
Conclusion: The Road Ahead
Trading is undoubtedly a difficult and stressful endeavor. However, with the right mindset and tools at your disposal, you can navigate this challenging field with confidence. This article serves as an introduction to understanding the vital psychological factors that can influence your trading performance. As you progress, remember to continually assess your emotional health and refine your trading strategy. Establish a comprehensive trading plan before you leap into future trades, ensuring that you’re as prepared as possible for the challenges ahead. With dedication and self-awareness, you can significantly increase your chances of thriving in the trading world.
By focusing on your mental approach and understanding the roots of your trading behavior, you can pave the way for a successful future in the exciting world of share trading.
Happy trading!
Read Also:
✅ Please share your thoughts about this educational post in the comments section below and HIT LIKE if you appreciate! Don't forget to FOLLOW ME; you will help us a lot with this small contribution

PROVEN STRATEGY FOR PROFITSThe Truth About the Holy Grail Market Strategy
Every trader dreams of finding that perfect strategy—the so-called "Holy Grail" that guarantees success. The one that wins every trade, beats every market condition, and transforms your account overnight.
Here’s the secret: it doesn’t exist.
Why do we chase it, then? Because we’ve been conditioned from a young age to believe there’s always a right answer. In school, careers, and life, we’re taught to strive for perfection and fear mistakes. This mindset slips into trading, where losses feel like personal failures instead of natural steps in the process.
Unfortunately, this is also why strategies claiming "100% accuracy" get so much attention. They feed into our hope of finding that mythical Holy Grail. People flock to these posts, hitting like, commenting, and even buying courses—all based on a fantasy. And the creators? They profit off this hope, knowing full well that no strategy is foolproof.
The reality is, trading isn’t about being right. It’s about being consistent. The pros aren’t chasing Holy Grails—they’re managing risk, mastering probabilities, and playing the long game.
If you’re stuck in the trap of searching for perfection, stop and ask yourself: Am I being sold a dream instead of learning the skills that matter?
Success in trading doesn’t come from avoiding losses but from mastering how to lose small and win big. Once you realize that, you’ll stop chasing myths and start building something real.
✨ Forget the Holy Grail. Focus on discipline, probabilities, and growth. ✨
FOLLOW ME FOR MORE SUCH CONTENT AHEAD
Till then,
HAPPY TRADING :)

1 - The Winning MentalityTo navigate the path of success, many individuals seek inspiration from the past. Historical figures teach us valuable lessons about achieving financial goals, avoiding common pitfalls, and navigating the complexities of life.
Trading stands out as one of the most demanding professions. Without proper training and education, mastering this field can be nearly impossible. What can aspiring traders do? The answer lies in learning from those who have excelled—studying their words, actions, writings, and seminars.
Every highly successful trader in the global currency market once started as a novice, transitioning from ordinary lives to remarkable success. None emerged from the womb as seasoned traders; each dedicated years to personal development, learning, and creating their own unique trading strategies. The names of such traders are now recognized by nearly all in the industry.
George Soros
George Soros, born György Schwartz in Budapest in 1930, grew up in a modest Jewish family. His family relocated to England in 1947, where Soros attended the London School of Economics, often juggling multiple jobs to make ends meet.
His journey took him to New York in 1956, armed with just $500. Over three decades on Wall Street, Soros gained notoriety for his innovative trading methods, amassing a fortune of $100 million.
A pivotal moment came on September 16, 1992, dubbed "Black Wednesday," when Soros famously shorted the British pound, profiting nearly $1 billion in a single day. Following similar strategies in Southeast Asia at the end of the 1990s, he declared a shift to philanthropy, ultimately donating approximately $32 billion to various causes.
On his 90th birthday, Soros shared a key insight into his success: his approach was more psychological than financial. He emphasized that distorted perceptions can lead to misguided actions—an understanding rooted in his concept of reflexivity.
Larry Williams
Born in Miles City, Montana in 1942, Larry Williams graduated from the University of Oregon before embarking on a varied career that ultimately led him to the stock markets. His interest sparked from observing stock price fluctuations, and he was particularly intrigued by the potential for profit despite market downturns.
By 1965, Williams was actively trading and became known for creating the acclaimed Williams %R indicator. He garnered remarkable success in the Robbins World Cup trading championship, where he achieved a staggering annual return of 11,376%, transforming a $10,000 investment into over $1.1 million.
Williams believed that historical events do not dictate future price movements, asserting that his indicators primarily shed light on current market conditions rather than predict future trends.
Steven Cohen
Stephen Cohen gained fame for his analytical prowess and his ability to anticipate market crises. Born in 1957, he demonstrated early on a talent for analysis, particularly through poker, where he honed skills in evaluating risk.
Cohen's trading career gained momentum after he invested $1,000 in a brokerage firm, subsequently launching S.A.C. Capital Partners with a $20 million initial fund. His savvy investment strategies led to an impressive annual profit nearing 50% at times, with his firm consistently outperforming competitors.
Even amidst market fluctuations, Cohen remained an active participant in his firm, demonstrating a hands-on approach that continues to define his success.
Paul Tudor Jones
Known for his discretion and aversion to fame, Paul Tudor Jones embarked on his trading journey in the 1970s with a clear ambition to succeed on Wall Street. Guided by influences from successful mentors, he initially traded on the cotton exchange, gradually transitioning to more lucrative futures trading.
His investment fund, Tudor Futures, grew substantially, particularly during periods of market volatility. Jones’s successful navigation led him to establish a renowned firm that today manages a diverse array of global investments, boasting a net worth of over $3 billion.
John Arnold
John Arnold represents a different path, as he transitioned from trading to entrepreneurship. He began his career at Enron, leveraging computer technology to excel in trading, ultimately earning $1 billion by 2001.
Following Enron’s collapse, Arnold founded Centaurus Energy Advisors, a hedge fund specializing in energy markets. Today, his business thrives with over $3 billion in assets, reflecting his exceptional leadership and strategic acumen.
Joe Lewis
Joe Lewis, billionaire and investor, built his wealth primarily through currency trading. Born in East London in 1937, he transitioned from a family catering business to becoming a formidable player in the financial markets.
Lewis achieved significant profits during the 1992 pound crisis, partnering with Soros. Now residing in the Bahamas, he actively manages the Tavistock Group, boasting investments across numerous industries.
Unpacking the Mindset of Successful Traders
The success stories outlined illustrate the diverse paths taken by some of the world’s most recognized traders. What common threads run through their journeys? Each trader faced significant challenges in their early years, and most were undeniably talented; however, talent alone does not guarantee success.
A defining characteristic of these traders is their unwavering focus on their objectives. Throughout their journeys, they sought knowledge from a variety of sources, driven by a desire to achieve their goals.
Despite the inevitable ups and downs, these traders recognized that perseverance and continuous learning are essential. For them, trading is not just a job but a lifelong passion.
Ultimately, success in trading—and in any endeavor—stems from tenacity, self-belief, specialized knowledge, and relentless pursuit of one’s goals. With a clear vision and dedicated effort, anyone can achieve remarkable success in the financial markets.
✅ Please share your thoughts about this educational post in the comments section below and HIT LIKE if you appreciate! Don't forget to FOLLOW ME; you will help us a lot with this small contribution

The Top Ten Money Habits Every Trader Should EmbraceSuccess in trading is more than just making strategic entry and exit decisions; it demands a holistic approach that encompasses effective profit realization, diligent capital protection, and a nuanced understanding of the psychological challenges posed by money. Many traders, especially novices, overlook these critical aspects, which can impede their journey to achieving full potential. By cultivating robust money habits, traders can sidestep common pitfalls and enhance their trading practices from haphazard speculation driven by luck to a disciplined methodology that enhances the chances of success over time.
Positive money habits function like the gears in a well-oiled machine. They help traders manage stress and maintain focus in the face of market volatility, enabling them to adhere to their strategies rather than succumbing to impulsive actions. In this article, we explore ten key money habits that successful traders embrace.
1. Conservatively Allocate Your Net Worth to Trading
In the realm of retail trading, the importance of a cautious approach to capital allocation cannot be overstated. New traders should consider investing only a small percentage of their total net worth into their trading accounts. This strategy serves several purposes, the foremost being financial preservation. When stakes are relatively low, the emotional impact of inevitable losses diminishes, allowing for greater objectivity and composure. This approach helps traders manage their mental resources, which are just as critical as financial capital, by minimizing the emotional stress associated with fluctuating account balances.
2. Limit Per-Trade Risk
The 1% rule is a cornerstone of sound risk management, advising traders to commit no more than 1% of their total capital to a single trade. Adhering to this guideline is essential for maintaining stability and consistency within one’s trading operations. Small, manageable losses preserve trading capital and serve as a buffer against the emotional turmoil that larger losses can cause. By keeping losses minimal, traders can maintain emotional balance and avoid engaging in destructive behaviors such as overtrading or deviating from their established strategies.
3. Implement Stop-Loss Orders
Stop-loss orders are a vital risk management tool that dictates a pre-established exit point for trades that begin to lose value. When conditions turn unfavorable, these orders automatically limit losses, transforming small setbacks into manageable situations, which prevents catastrophic financial consequences. By setting stop-loss orders, traders can detach from the emotional weight of each trade, reducing the temptation to react impulsively. Much like a life jacket keeps you afloat in turbulent waters, stop-loss orders protect traders from significant loss during market storms.
Read Also:
4. Know When to Stop Trading
Establishing a clear boundary for when to cease trading is essential to maintaining emotional health and discipline. Whether it’s after two consecutive losses or reaching a predetermined percentage of capital loss, these self-imposed limits serve as crucial safeguards against emotional decision-making and impulsive reactions to market shifts. Avoiding the trap of "chasing losses" is vital for long-term survival, as relentless attempts to recover lost funds can lead to reckless trading behavior.
Read Also:
5. Maintain Accurate Records to Understand Your Performance
Successful traders often keep a detailed trading journal to track their history of trades and analyze performance metrics. Regularly assessing key statistics—such as win/loss ratios, average trade sizes, and recurring mistakes—enables traders to identify patterns and areas for improvement. This diligent record-keeping allows for data-driven decision-making and objective assessments, facilitating strategic adjustments based on performance rather than emotion. In essence, a trading journal becomes more than a record; it transforms into an essential tool for growth and competitive advantage.
Read Also:
6. Keep Trading Capital Separate from Personal Finances
A fundamental principle for serious traders is to maintain a clear separation between trading funds and personal finances. This involves designating a specific amount of capital exclusively for trading, shielding everyday finances from the volatility that can arise in the markets. Treating trading as a business with its own financial structure fosters discipline and enables traders to navigate market fluctuations without compromising essential personal expenses, such as rent or family obligations.
7. Develop Emotional Control
Successful trading is deeply rooted in emotional discipline. This trait differentiates a professional trader from an amateur gambler. Those capable of regulating their emotions can execute their trading plans with confidence, resisting the lure of impulsive, fear-driven decisions. Regular self-evaluation and mindfulness techniques contribute to emotional resilience, fostering a mindset that prioritizes strategic processes over short-term returns. Practicing emotional control enhances consistency and ultimately serves as a pillar of long-term success.
Read Also:
8. Cultivate Patience for Sustainable Capital Growth
Patience is a valuable asset in the trading world. Success is often achieved incrementally, necessitating a disciplined and sustained approach to trading rather than a frantic dash for immediate profits. By adhering to risk management principles and avoiding over-leverage, traders can gradually build their accounts, acknowledging that success is a marathon, not a sprint. Impatience can lead to hasty decisions that undermine a trader’s strategy, while a patient, methodical approach allows for the powerful compounding of gains over time.
9. Maintain Balance Beyond Trading
It’s crucial for traders to remember that their self-worth should not solely depend on their trading outcomes. An inherent risk exists when traders overly identify with their trading performance, potentially clouding judgment and fueling emotional volatility. Fostering a balanced lifestyle that includes varied interests helps mitigate the effects of trading fluctuations on overall well-being. This broader perspective can help traders remain level-headed, ensuring that their mood and decision-making processes are not solely influenced by trading results.
10. Establish an Emergency Fund for Financial Security
Finally, traders should prioritize building an emergency fund covering several months’ worth of living expenses. This safety net provides mental clarity and reduces the pressure that arises from needing consistent trading income. The unpredictable nature of trading can lead to significant financial stress, making it essential to separate one’s day-to-day financial needs from trading outcomes. With an emergency fund in place, traders can focus on making rational decisions without the looming pressure of immediate financial obligations.
Conclusion
In summary, successful trading transcends the mechanics of market entry and exit; it encompasses a comprehensive approach to profit realization, capital protection, and psychological resilience. By adopting sound money habits, whether you are an experienced trader or just starting, you can enhance your trading methodology and significantly improve your chances for long-term success. These strategies, from prudent capital allocation to emotional discipline, form the backbone of a resilient trading practice. Ultimately, cultivating these habits transforms trading from a game of chance into a systematic, strategic endeavor, paving the way for consistent profitability over time.
✅ Please share your thoughts about this educational post in the comments section below and HIT LIKE if you appreciate! Don't forget to FOLLOW ME; you will help us a lot with this small contribution

FOMO: The Trader’s Silent Enemy and How to Defeat ItIn the world of trading, emotional influences can significantly impact decision-making and outcomes. Two contrasting profiles emerge: those shadowed by Fear of Missing Out (FOMO) and those who adhere to disciplined trading practices. Understanding these profiles can help traders navigate the often volatile and unpredictable landscape of financial markets.
Distinctions Between FOMO and Disciplined Traders
The fundamental differences between traders influenced by FOMO and their disciplined counterparts can be distilled into several critical areas:
Research and Due Diligence
Disciplined Trader: A disciplined trader approaches the market with caution, dedicating time to comprehensive research before making any trades. They analyze market trends, harness technical indicators, and assess the fundamentals of the assets they are considering.
FOMO Trader: In stark contrast, the FOMO trader tends to act impulsively, often entering trades based solely on a recent surge in an asset's price. This lack of due diligence can lead to poor decision-making and significant financial losses.
Psychological Well-being
Disciplined Trader: The peace of mind that comes from preparation and understanding fosters resilience. Disciplined traders possess a clear vision of their strategies, which translates into greater emotional stability during market fluctuations.
FOMO Trader: Conversely, FOMO traders live in a constant state of anxiety, driven by the fear of missing out on potential profits. This stress can cloud their judgment, resulting in hasty decisions that may not align with their long-term goals.
Read Also:
Setting Expectations
Disciplined Trader: Traders with discipline recognize that markets fluctuate, and they set realistic expectations for their trades. They understand that no asset will rise indefinitely and prepare themselves for potential downturns.
FOMO Trader: FOMO traders may harbor unrealistic expectations of perpetual price increases, often leading to poor risk management and reactions based on emotional impulses rather than careful analysis.
Additionally, disciplined traders maintain structured practices, such as keeping a trading journal and employing risk management strategies, including stop-loss and take-profit orders, to safeguard their investments.
The Psychological Origins of FOMO in Trading
FOMO is not simply a passing feeling; it is deeply rooted in psychological and emotional dynamics that affect traders' behaviors. Here are a few of the significant psychological components that fuel FOMO:
Emotional Drivers
- Fear: At its core, FOMO is driven by the fear of missing out on lucrative opportunities. This fear leads to impulsive decision-making without adequate analysis.
- Greed: The promise of quick gains can lead to overconfidence, where traders disregard their due diligence processes in favor of immediate rewards.
- Anxiety: Market volatility heightens anxiety, driving traders to act hastily out of fear of being left behind as prices surge.
- Jealousy: Observing others' success can cultivate feelings of jealousy, which may compel traders to chase performance without conducting their own assessments.
- Impatience: Many FOMO traders are eager for instant gratification, resulting in rushed trading decisions that may not align with their overall strategy.
Read Also:
External Influences
- Market Hype: The buzz surrounding trending assets—often amplified by social media and news platforms—creates urgency among traders to partake, regardless of personal conviction.
- Herd Behavior: Sensational news can trigger a collective rush to join in on trending trades, leading to exaggerated market movements and increased volatility.
- Cognitive Biases: Psychological biases, such as loss aversion and confirmation bias, can exacerbate FOMO, pushing traders to act on emotions rather than logic.
Strategies to Combat FOMO in Trading
Recognizing and overcoming FOMO is paramount for successful trading. Implementing the following strategies can help cultivate a disciplined mindset:
1. Craft a Thorough Trading Plan
A well-defined trading plan outlines clear entry and exit strategies, risk parameters, and criteria for asset selection. By establishing this framework early in your trading endeavors, you create a disciplined approach that minimizes the chances of impulsive decisions.
2. Utilize a Trading Checklist
Create a comprehensive checklist that evaluates various conditions and technical indicators before executing a trade. This practice encourages thorough research and analysis, helping to prevent hasty, emotionally-driven decisions.
3. Maintain a Trading Journal
Documenting each trade helps identify patterns in decision-making and allows for reflection on the motivations behind your trades. Analyzing past experiences can empower you to make more informed choices moving forward.
4. Develop a Consistent Trading Routine
Establishing a structured routine—whether it involves regular analysis or adhering to a specific sequence for trade execution—helps maintain discipline and reinforces a systematic trading approach.
5. Implement Risk Management Tools
Utilizing tools such as stop-loss orders aids in controlling the emotional toll of trading. These measures automatically mitigate losses and preserve capital, supporting a rational decision-making framework.
Read Also:
Final Thoughts: Building Resilience in Trading
Understanding the dynamics behind FOMO provides traders with important insights into their psychological triggers. The emotional roots of FOMO—shaped by fear, social influence, and psychological biases—underline the critical importance of maintaining a disciplined trading approach. By implementing structured strategies, such as creating a trading plan, utilizing checklists, maintaining journals, and employing risk management, traders can better navigate the complexities of financial markets. Ultimately, cultivating resilience against FOMO allows for more informed and confident decision-making, leading to long-term success in trading endeavors.
✅ Please share your thoughts about this educational post in the comments section below and HIT LIKE if you appreciate! Don't forget to FOLLOW ME; you will help us a lot with this small contribution

Look inside Silvers 4HR d/bottom, we find a bull trap!
This is what Silver wants us to believe to draw in renewed buying under 30.0.
They want to promote a false representation of Long-entry-buying, by cultivating this fake D/bottom on 4hr timeframe and I think 1hr and 2hr.
Check out the 1,2,3 minute timeframes and herein lies the bull-trap today. It's a bears head n'shoulders which when triggers will cause selling to sweep straight through these double bottoms even though they are on higher time frames.
It will be a huge silver sell-off and there was already one in the Asia session today.
Is it just me, or do you often wonder how these patterns get written at such pivotal points..?
I'm ready for a sell-off tonight in silver which will trigger the sell into gold.
Trading is risky. My thoughts only and I have not replicated ideas from anyone else. The only 1 news item I was influenced on today was for bearish prices in gold for the rest of the year, supply demand thing.
You will find a silver story from 2hours ago here.
www.tradingview.com
On gold:
www.tradingview.com
Happy thanks-giving USA. I understand you won't have a market today.
