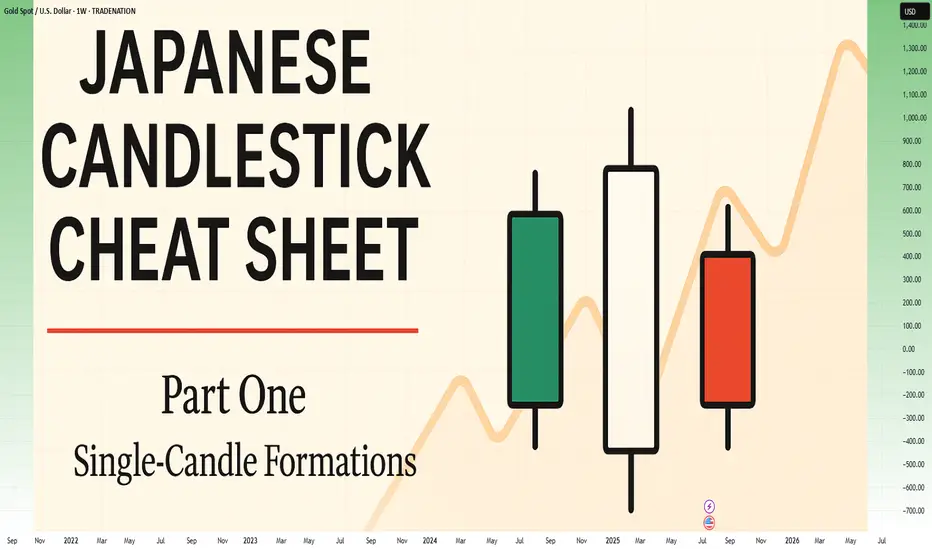
Japanese Candlestick Cheat Sheet – Part OneSingle-Candle Formations That Speak
Before you dream of profits, learn the one language that never lies: price.
Indicators are just subtitles — price is the voice.
Japanese candlesticks are more than just red and green bars — they reflect emotion, pressure, and intention within the market.
This series will walk you through the real psychology behind candlestick patterns — starting here, with the most essential:
🕯️ Single-candle formations — the quiet signals that often appear before big moves happen.
If you can’t read a doji, you’re not ready to understand the market’s hesitation.
If you ignore a hammer, you’ll miss the moment sentiment shifts.
Let’s start simple. Let’s start strong.
This is Part One of a five-part series designed to build your candlestick fluency from the ground up.
1. DOJI
Bias: Neutral
What is the Doji pattern?
The Doji candlestick pattern forms when a candle’s open and close prices are nearly identical, resulting in a small or nonexistent body with wicks on both sides. This pattern reflects market equilibrium, where neither buyers nor sellers dominate. Dojis often appear at trend ends, signaling potential reversals or pauses.
As a fundamental tool in technical analysis, Dojis help traders gauge the psychological battle between buyers and sellers. Proper interpretation requires context and experience, especially for spotting trend shifts.
Meaning:
Indicates market indecision or balance. Found during trends and may signal a reversal or continuation based on context.
LONG-LEGGED DOJI
Bias: Neutral
What is the Long-Legged Doji pattern?
The Long-Legged Doji captures a moment of intense uncertainty and volatility in the market. Its long wicks represent significant movement on both sides, suggesting that neither buyers nor sellers have control. This back-and-forth reflects the psychology of market participants wrestling for control, which often foreshadows a shift in sentiment. When traders see a Long-Legged Doji, it highlights the need to monitor for potential changes in direction.
They can appear within trends, at potential reversal points, or at consolidation zones. When they form at the end of an uptrend or downtrend, they often signal that the current trend may be losing momentum.
Meaning:
The prominent wicks indicate volatility. Buyers and sellers pushed prices in opposite directions throughout the session, ultimately reaching an indecisive close.
SPINNING TOP
Bias: Neutral
What is the Spinning Top pattern?
A Spinning Top is a candlestick with a small body and long upper and lower wicks, indicating that the market has fluctuated significantly but ultimately closed near its opening price. This pattern often points to a moment of indecision, where both buyers and sellers are active but neither dominates. Spinning Tops are commonly found within both uptrends and downtrends and can suggest that a trend is losing momentum.
For traders, a Spinning Top provides a valuable insight into market psychology, as it hints that the prevailing sentiment may be weakening. While Spinning Tops alone aren’t always definitive, they can serve as a precursor to larger moves if the following candles confirm a shift in sentiment.
Meaning:
Shows indecision between buyers and sellers. Common in both up and downtrends; signals potential reversal or pause.
HAMMER
Bias: Bullish
What is the Hammer pattern?
A Hammer candlestick appears at the end of a downtrend, with a small body and a long lower wick. This shape reflects a moment when sellers pushed prices lower, but buyers managed to absorb the selling pressure and drive prices back up before the close. This pattern is particularly important for spotting potential reversals, as it indicates that buyers are beginning to reassert control.
Hammers reveal the underlying psychology of a market where buying confidence is emerging, even if sellers have dominated for a while. To successfully trade this pattern, it’s essential to confirm the reversal with subsequent candles.
Meaning:
Showing rejection of lower prices. Signals potential bullish reversal, especially if followed by strong buying candles.
INVERTED HAMMER
Bias: Bullish
What is the Inverted Hammer pattern?
The Inverted Hammer forms at the bottom of a downtrend, with a small body and long upper wick. This pattern shows that buyers attempted to push prices higher, but sellers ultimately brought them back down by the close. The Inverted Hammer is an early sign of buyer interest, hinting that a trend reversal may be underway if subsequent candles confirm the shift.
Interpreting the Inverted Hammer helps traders understand where sentiment may be shifting from bearish to bullish, often marking the beginning of a recovery. Recognizing these patterns takes practice and familiarity with market conditions.
Meaning:
Showing rejection of higher prices. Can signal bullish reversal if confirmed by subsequent buying pressure.
DRAGONFLY DOJI
Bias: Bullish
What is the Dragonfly Doji pattern?
The Dragonfly Doji has a long lower wick and no upper wick, forming in downtrends to signal potential bullish reversal. This pattern reveals that sellers were initially in control, pushing prices lower, but buyers stepped in to push prices back up to the opening level. The Dragonfly Doji’s unique shape signifies that strong buying support exists at the lower price level, hinting at an impending reversal.
Recognizing the psychology behind a Dragonfly Doji can enhance a trader’s ability to anticipate trend changes, especially in markets where support levels are being tested.
Meaning:
Found in downtrends; suggests possible bullish reversal if confirmed by a strong upward move.
BULLISH MARUBOZU
Bias: Bullish
What is the Bullish Marubozu pattern?
The Bullish Marubozu is a large, solid candle with no wicks, indicating that buyers were in complete control throughout the session. This pattern appears in uptrends, where it signals strong buying momentum and often foreshadows continued upward movement. The absence of wicks reveals that prices consistently moved higher, with little resistance from sellers.
For traders, the Bullish Marubozu offers a glimpse into market psychology, highlighting moments when buyer sentiment is particularly strong. Learning to identify these periods of intense momentum is crucial for trading success.
Meaning:
Showing complete buying control. Found in uptrends or at reversal points; indicates strong buying pressure and likely continuation of the trend.
SHOOTING STAR
Bias: Bearish
What is the Shooting Star pattern?
The Shooting Star appears at the top of an uptrend, characterized by a small body and a long upper wick, indicating a potential bearish reversal. Buyers initially drove prices higher, but sellers took over, bringing prices back down near the open. This shift suggests that buyers may be losing control, and a reversal could be imminent.
Interpreting the Shooting Star gives traders valuable insights into moments when optimism begins to fade, providing clues about a potential trend shift.
Meaning:
Indicating rejection of higher prices. Signals a potential bearish reversal if followed by selling pressure.
HANGING MAN
Bias: Bearish
W hat is the Hanging Man pattern?
The Hanging Man candle forms at the top of an uptrend, with a small body and long lower wick. This pattern suggests that sellers attempted to drive prices down, but buyers regained control. However, the presence of a long lower shadow hints that sellers may be gaining strength, potentially signaling a bearish reversal.
The Hanging Man pattern reflects market psychology where buyers might be overextended, making it a valuable tool for identifying potential tops in trends.
Meaning:
Signals potential bearish reversal if confirmed by selling candles afterward.
GRAVESTONE DOJI
Bias: Bearish
What is the Gravestone Doji pattern?
With a long upper wick and no lower wick, the Gravestone Doji reveals that buyers pushed prices up, but sellers eventually regained control. Found in uptrends, it suggests that a bearish reversal could be near, as the upper shadow indicates buyer exhaustion. The Gravestone Doji often appears at market tops, making it a valuable indicator for those looking to anticipate shifts.
Understanding the psychology behind this pattern helps traders make informed decisions, especially in markets prone to overbought conditions.
Meaning:
Showing rejection of higher prices. Found in uptrends; signals potential bearish reversal if followed by selling activity.
BEARISH MARUBOZU
Bias: Bearish
What is the Bearish Marubozu pattern?
The Bearish Marubozu is a large, solid bearish candle without wicks, showing that sellers held control throughout the session. Found in downtrends, it signals strong bearish sentiment and suggests that the trend is likely to continue. The lack of wicks reflects consistent downward momentum without significant buyer support.
This pattern speaks about market psychology, offering traders insights into moments of intense selling pressure. Recognizing the Bearish Marubozu can help you align with prevailing trends and avoid buying into weakening markets
Meaning:
Showing strong selling pressure. Found in downtrends; signals continuation of the bearish trend or an intensifying sell-off.
👉 Up next: Double-candle formations – where price meets reaction.
Educationalposts
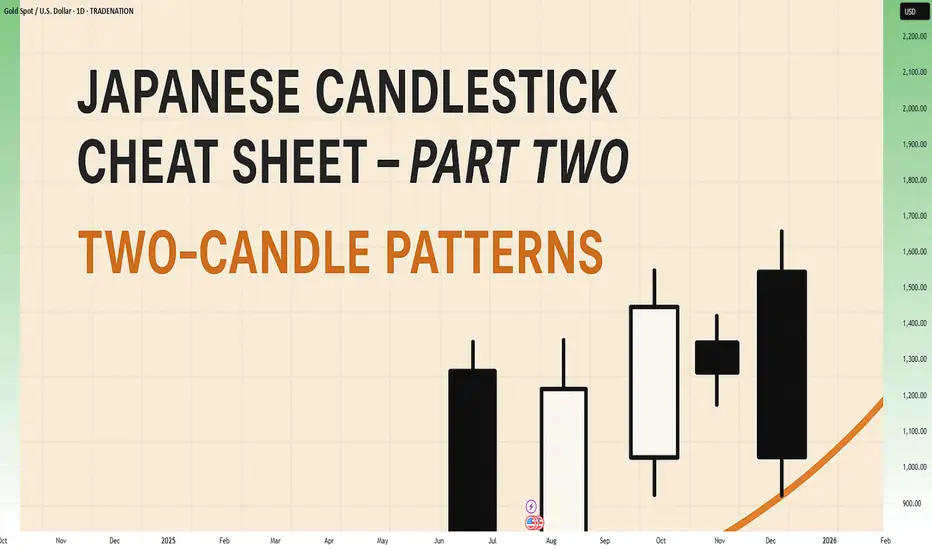
Japanese Candlestick Cheat Sheet – Part Two- 2 candle patternsTwo-Candle Patterns That Signal Shifts in Sentiment
Single candles whisper…
But two candles talk to each other — and when they do, they often reveal the first signs of a reversal or continuation.
In this second part of the series, we go deeper.
From engulfings to haramis, tweezer tops to piercing lines — these patterns don’t just look good on charts… they capture the psychological tug-of-war between buyers and sellers.
Price doesn’t lie.
And two candles in a row can say: “Something just changed.”
Learn to spot them early. Learn to listen when the chart speaks.
This is Part Two of your practical guide to mastering candlestick formations.
BULLISH KICKER
Bias: Bullish
What is the Bullish Kicker pattern?
The Bullish Kicker forms when a strong bullish candle follows a bearish one with no overlap between the two, indicating a sudden shift in sentiment. This pattern is a powerful indicator of a reversal as buyers take control. The sharp contrast between the bearish and bullish candles reflects a dramatic shift in market psychology, where bears are caught off-guard and forced to cover their positions.
Bullish Kickers are rare but extremely telling, providing a clear signal that sentiment is favoring buyers. Recognizing such decisive patterns can be a game-changer.
Meaning:
Found after downtrends or sell-offs; suggests a sudden shift in sentiment, indicating strong buying interest and potential trend reversal.
BULLISH ENGULFING
Bias: Bullish
What is the Bullish Engulfing pattern?
The Bullish Engulfing pattern occurs when a large bullish candle fully engulfs the previous smaller bearish candle, signaling a potential trend reversal. This pattern highlights a moment when buyers overpower sellers, often marking the beginning of upward momentum. Psychologically, it suggests that buyer confidence is returning, and sellers are losing their grip.
For traders, understanding Bullish Engulfing patterns can provide crucial entry points into emerging trends. Learning to identify and trade such patterns is essential for capturing momentum and new trends.
Meaning:
Typically found in downtrends, this pattern signals a potential bullish reversal as buyers overpower sellers, often indicating a shift toward upward momentum.
BULLISH HARAMI
Bias: Bullish
What is the Bullish Harami pattern?
The Bullish Harami consists of a small bullish candle within a preceding larger bearish one, indicating a pause in downward momentum and hinting at a potential reversal. This pattern shows that sellers are beginning to weaken as buyers cautiously test the waters. The Harami reflects a shift in sentiment from bearish to neutral, often marking a transitional phase in the market.
Interpreting the Bullish Harami helps traders spot moments when sentiment is shifting, potentially signaling the start of a trend change.
Meaning:
Seen in downtrends, it suggests indecision, with possible bullish reversal if the following candles confirm buying strength, indicating a weakening bearish trend.
PIERCING LINE
Bias: Bullish
What is the Piercing Line pattern?
The Piercing Line forms when a bullish candle opens below the previous bearish candle’s low but closes over halfway into it. Found in downtrends, this pattern reflects strong buying pressure as buyers step in at lower prices, creating a potential bullish reversal. The Piercing Line pattern suggests that sentiment may be shifting as buyers gain confidence.
This pattern’s strength lies in its psychological impact, revealing moments when buyers are willing to take risks. Recognizing these signs early can provide valuable insights for traders looking to time entries.
Meaning :
Found in downtrends, this pattern suggests a possible bullish reversal if buying continues, as sellers lose control to buyers.
TWEEZER BOTTOM
Bias: Bullish
What is the Tweezer Bottom pattern?
The Tweezer Bottom pattern is characterized by two consecutive candles with nearly identical lows, one bearish and one bullish. This pattern often signals the end of a downtrend, as the matching lows suggest a strong support level where buyers are stepping in. The Tweezer Bottom highlights market psychology at work, with sellers unable to push prices lower, reflecting renewed buying interest.
Tweezer Bottoms are ideal for traders looking to identify support zones and potential reversal points. By understanding this pattern’s significance, traders can make informed decisions.
Meaning:
Found in downtrends, it signals potential reversal, showing strong support at the matching low, suggesting buyers are stepping in.
BEARISH KICKER
Bias: Bearish
What is the Bearish Kicker pattern?
The Bearish Kicker is the inverse of the Bullish Kicker, forming when a strong bearish candle follows a bullish one without overlap, indicating a sharp sentiment shift. This pattern often marks a sudden reversal, with sellers taking control after an initial bullish period. Psychologically, Bearish Kickers are powerful, signaling that buyers are caught off-guard and losing momentum.
Recognizing Bearish Kickers provides traders with insights into sudden shifts in market dynamics, helping them avoid buying into weakening trends.
Meaning:
Found after uptrends; indicates a sudden sentiment shift, signaling potential trend reversal and intensified selling pressure.
BEARISH ENGULFING
Bias: Bearish
What is the Bearish Engulfing pattern?
The Bearish Engulfing pattern forms when a large bearish candle engulfs the previous smaller bullish candle, suggesting a potential reversal in an uptrend. This pattern signals that sellers have regained control, often marking the start of downward momentum. The Bearish Engulfing reveals a psychological shift, as selling pressure overtakes buying interest.
This pattern is a powerful tool for traders who aim to catch trend reversals, allowing them to align with emerging downward momentum.
Meaning:
Typically found in uptrends, this pattern signals a potential bearish reversal as sellers overpower buyers, often indicating a downward momentum shift.
BEARISH HARAMI
Bias: Bearish
What is the Bearish Harami pattern?
The Bearish Harami consists of a small bearish candle contained within a larger preceding bullish one, reflecting indecision and a potential trend reversal. Found in uptrends, it hints that buyers are losing strength, while sellers are cautiously testing the market. This pattern highlights moments when buyer momentum begins to wane, suggesting caution.
Interpreting the Bearish Harami allows traders to spot potential shifts in sentiment, helping them manage risk and time their exits.
Meaning:
Seen in uptrends, it suggests indecision with a potential bearish reversal if following candles confirm, indicating a weakening bullish trend.
DARK CLOUD COVER
Bias: Bearish
What is the Dark Cloud Cover pattern?
The Dark Cloud Cover appears when a bearish candle opens above the previous bullish candle but closes over halfway into it, reflecting a shift in control from buyers to sellers. This pattern suggests that bullish momentum may be fading, hinting at a potential reversal. Dark Cloud Cover patterns reveal moments when sentiment shifts from optimism to caution.
For traders, understanding this pattern helps them anticipate reversals at the top of uptrends.
Meaning:
Found in uptrends; signals potential bearish reversal if selling continues, as buyers lose control to sellers.
TWEEZER TOP
Bias: Bearish
W hat is the Tweezer Top pattern?
The Tweezer Top is formed by two candles with matching or nearly matching highs, typically one bullish and one bearish. This pattern signals potential resistance, as sellers are consistently pushing back against the same level. The Tweezer Top reflects a moment of seller strength, often marking the end of an uptrend.
Recognizing Tweezer Tops helps traders spot resistance zones and potential reversal points, allowing them to avoid buying into weakening trends or even shorting the asset.
Meaning:
Found in uptrends, it signals potential reversal, showing strong resistance at the matching high, suggesting selling pressure.
🧭 Final Thought
Two-candle formations often appear at key turning points — right where most traders hesitate or get trapped.
Learn to read them not just as patterns, but as conversations between candles — one pushing, the other reacting.
And if this is your first time reading the series, don’t miss Part One – where we covered single-candle signals like dojis, hammers, and marubozus — the very foundations of candlestick reading.
Why Swing Trading and Scalping Are Opposite Worlds"It's not about the strategy. It's about who you are when the market puts pressure on you."
Most traders fail not because they don’t learn “strategies” — but because they pick a style that doesn't match their temperament.
And nothing creates more damage than confusing swing trading with scalping/intraday trading.
Let’s break them down. For real...
________________________________________
🔵 1. Swing Trader – Chasing Direction, Not Noise
A swing trader does not touch choppy markets.
He’s not here for the sideways grind. He wants momentum.
If there’s no clear trend, he doesn’t trade.
He shifts between assets depending on where real movement is.
• USD weakens → he buys EUR/USD and waits
• Gold breaks → he enters and lets the move develop
Swing trading means positioning with the macro flow, not chasing bottoms and tops.
✅ He trades based on H4/Daily or even Weekly charts
✅ He holds for hundreds of pips.
✅ He accepts contrarian candles in the process.
________________________________________
🔴 2. Scalper/Intraday Trader – The Asset Specialist
A true scalper doesn’t chase trends.
He hunts inefficiencies — quick spikes, fakeouts, liquidity grabs.
✅ Loves range conditions
✅ Lives inside M5–M15
✅ Often trades only one asset he knows like the back of his hand
He doesn’t care what EUR/USD will do this week.
He cares what it does in the next 30 minutes after a breakout.
Scalping is not chaos. It's cold execution with a sniper mindset.
📡 He reacts to news in real time.
He doesn’t predict — he exploits.
________________________________________
🧾 Key Differences – Swing Trader vs. Scalper
________________________________________
🎯 Primary Objective
• Swing Trader: Captures large directional moves over several days.
• Scalper/Intraday: Exploits short-term volatility, aiming for quick, small gains.
________________________________________
🧭 Market Conditions Preference
• Swing Trader: Needs clean, trending markets with clear momentum.
• Scalper/Intraday: Feels comfortable in ranging markets with liquidity spikes and noise.
________________________________________
🔍 Number of Instruments Traded
• Swing Trader: Monitors and rotates through multiple assets (e.g. XAUUSD, EURUSD, indices, BTC, he's going where the money is).
• Scalper/Intraday: Specializes in 1–2 instruments only, knows their behavior in every session.
________________________________________
⏰ Time Spent in Front of the Charts
• Swing Trader: Waits for clean setups, may hold positions for days or weeks.
• Scalper/Intraday: Constant screen time, executes and manages trades actively.
________________________________________
📰 Reaction to News
• Swing Trader: Interprets the macro/fundamental impact and positions accordingly.
• Scalper/Intraday: Reacts live to data releases, wicks, and intraday volatility.
________________________________________
📉 When They Struggle
• Swing Trader: Fails in choppy or directionless markets.
• Scalper/Intraday: Loses edge when the market trends explosively.
________________________________________
🧠 Psychological Requirements
• Swing Trader: Needs patience, confidence in the big picture, and acceptance of drawdown.
• Scalper/Intraday: Needs absolute discipline, emotional detachment, and razor-sharp focus.
________________________________________
✅ Bottom line: They are two different games.
Don’t try to play both on the same chart with the same mindset.
________________________________________
✅ Final Thoughts – Your Edge Is in Alignment, Not Imitation
You don’t pick a trading style because it “sounds cool.”
You pick it because it aligns with:
• Your schedule
• Your attention span
• Your tolerance for uncertainty
If you hate watching candles all day – go swing.
If you hate waiting for days – go intraday.
If you keep switching between both – go journal your pain and come back later.
P.S. Recent Example:
I'm a swing trader. And this week, Gold has been stuck in a range.
What do I do? I wait. No rush, no overtrading. Just patience.
Once the range breaks, I’m ready — in either direction.
But I don’t close after a quick 50–100 pip move. That’s not my game.
I aim for 700+ pips whether it breaks up or down,because on both sides we have major support and resistance levels that matter.
That’s swing trading:
📍 Enter with structure, hold with confidence, exit at significance.
Not every move is worth trading — but the big ones are worth waiting for.
Disclosure: I am part of TradeNation's Influencer program and receive a monthly fee for using their TradingView charts in my analyses and educational articles.
The Dangers of Holding Onto Losing Positions...One of the most common — and costly — mistakes in trading is holding onto a losing position for too long. Whether it's driven by hope, ego, or fear, this behavior can damage your portfolio, drain your capital, and block future opportunities. Successful trading requires discipline, objectivity, and the willingness to accept when a trade isn’t working. Understanding the risks behind this behavior is essential to protecting your capital and evolving as a trader.
-- Why Traders Hold Onto Losing Trades --
It’s not always poor strategy or lack of experience that keeps traders locked in losing positions — it’s often psychology. Several cognitive biases are at play:
1. Loss Aversion
Loss aversion refers to our instinctive desire to avoid losses, often stronger than the desire to realize gains. Traders may hold onto a losing position simply to avoid the emotional pain of admitting the loss, hoping the market will eventually turn in their favor.
2. Overconfidence
When traders are overly confident in their analysis or trading thesis, they can become blind to changing market conditions. This conviction may cause them to ignore red flags and hold on out of sheer stubbornness or pride.
3. The Sunk Cost Fallacy
This is the belief that since you’ve already invested money, time, or effort into a trade, you need to keep going to “get your investment back.” The reality? Past investments are gone — and continuing the position often compounds the loss.
These mental traps can distort decision-making and trap traders in unproductive or damaging positions. Being aware of them is the first step toward better judgment.
-- The True Cost of Holding Losing Positions --
Holding onto a bad trade costs more than just the money it loses. It impacts your entire trading strategy and limits your growth. Here’s how:
1. Opportunity Cost
Capital tied up in a losing trade is capital that can’t be used elsewhere. If you keep $8,000 in a stock that’s fallen from $10,000 — hoping it rebounds — you're missing out on placing that money in higher-performing opportunities. Inactive capital is wasted capital.
2. Deeper Compounding Losses
A 20% loss doesn’t sound catastrophic until it becomes 30%… then 40%. The deeper the loss, the harder it becomes to break even. Holding out for a recovery often makes things worse — especially in markets with high volatility or downtrends.
3. Reduced Liquidity
Successful traders rely on flexibility. When your funds are tied up in a losing position, you limit your ability to respond to new opportunities. In fast-moving markets, this can be the difference between success and stagnation.
Recognizing these costs reframes the decision from “holding on until it turns around” to “preserving capital and maximizing potential.”
Consider this simple XAUUSD (Gold) weekly chart example. If you base a trading strategy solely on the Stochastic oscillator (or any single indicator) without backtesting and ignoring the overall trend, focusing solely on overbought signals for reversals, you'll quickly see the oscillator's frequent inaccuracies. This approach will likely lead to substantial and prolonged losses while waiting for a reversal that may never occur.
-- Signs It’s Time to Exit a Losing Trade --
The hardest part of trading isn’t opening a position — it’s closing a bad one. But if you know what to look for, you’ll know when it’s time to let go:
1. Emotional Attachment
If you find yourself feeling “married” to a trade, it’s a warning sign. Traders often assign meaning or identity to a position. But trading should be based on data and strategy, not sentiment.
2. Ignoring or Adjusting Your Stop Loss
Stop Loss orders exist for a reason: to protect your capital. If you habitually move your stop further to avoid triggering it, you’re letting hope override risk management.
3. Rationalizing Losses
Statements like “It’ll bounce back” or “This company always recovers” can signal denial. Hope is not a strategy. When you catch yourself justifying a bad position without objective reasoning, it’s time to reevaluate.
Consider also reading this article:
-- How to Cut Losses and Move Forward --
Cutting a loss isn’t a failure — it’s a skill. Here are proven techniques that help you exit with discipline and confidence:
1. Use Stop Losses — and Respect Them
Set a Stop Loss at the moment you enter a trade — and stick to it. It takes the emotion out of the exit and protects your downside. Moving the stop is the fastest path to deeper losses.
2. Trade With a Plan
Every trade should be part of a bigger strategy that includes risk tolerance, entry/exit points, and profit targets. If a position hits your predetermined loss threshold, exit. Trust your system.
3. Apply Position Sizing and Diversification
Never risk more than a small percentage of your capital on a single trade. Keep your portfolio diversified across different instruments or sectors to avoid one position derailing your progress.
4. Review and Reflect
Post-trade analysis is vital. Review both wins and losses to learn what worked — and what didn’t. This practice sharpens your strategy and builds emotional resilience over time.
-- Why Cutting Losses Strengthens Your Portfolio --
There’s long-term power in letting go. Here’s what cutting losses early can do for you:
1. Preserve Capital
The faster you cut a losing trade, the more capital you retain — and the more opportunities you can pursue. Capital preservation is the foundation of longevity in trading.
2. Reduce Emotional Stress
Sitting in a losing trade weighs heavily on your mindset. The stress can cloud your judgment, increase risk-taking, or cause hesitation. Exiting early reduces this emotional drag and keeps you clear-headed.
3. Reallocate to Better Setups
Exiting losing trades frees up both capital and mental energy for higher-probability opportunities. This proactive approach builds momentum and reinforces the idea that it’s okay to be wrong — as long as you act decisively.
Consider also reading this article:
-- Final Thoughts: Discipline Over Denial --
Holding onto losing trades may feel like you're showing patience or commitment — but in reality, it's often denial wrapped in hope. Trading is about probabilities, not guarantees. The most successful traders aren’t the ones who win every trade — they’re the ones who manage losses with discipline.
Letting go of a bad trade is a show of strength, not weakness. It’s a deliberate choice to protect your capital, stay agile, and refocus on trades that serve your goals. The market doesn’t owe you a comeback — but with a clear head and disciplined approach, you can always find your next opportunity.
✅ Please share your thoughts about this article in the comments section below and HIT LIKE if you appreciate my post. Don't forget to FOLLOW ME; you will help us a lot with this small contribution.
5 Proven Tricks to Trade Without FOMO After Missing Your TriggerYo traders! In this video, I’m breaking down what to do if you miss a trading trigger , so you can stay calm , avoid FOMO , and still catch the next move. We’re diving into five solid strategies to re-enter the market without losing your cool:
Buy on the pullback zone.
Buy with an engulfing candle after a pullback.
Buy after breaking the resistance formed by the pullback.
Buy after the second wave with an indecision candle.
Buy after breaking a major resistance post-second wave, confirmed by RSI or momentum oscillators.
These tips are all about keeping your trades smart and your head in the game. For more on indecision candles, check out this lesson . Wanna master breakout trading? Here’s the breakout trading guide . Drop your thoughts in the comments, boost if you vibe with it, and let’s grow together! 😎

Trading at the market topHello,
The stock market is back at an all-time high. This often brings excitement for existing investors—and a sense of anxiety or even FOMO (fear of missing out) for those who stayed on the sidelines when prices were lower.
It’s tempting to jump in, especially with headlines filled with optimism and portfolios showing green across the board. But this is also a time for caution and patience.
After a sustained rally, price levels often outpace fundamentals like earnings growth, economic stability, or interest rate trends. In such moments, valuations can become stretched, and investor sentiment overly euphoric conditions that typically precede short-term pullbacks or corrections.
Buying at the top locks in risk, not value.
If you're feeling late to the party, remember that good investors don’t chase prices—they wait for prices to come to them.
The best opportunities often come in moments of fear, not euphoria. And while this market high may go higher still, history shows that eventually, corrections come—and those prepared for them are the ones who win in the end.
Disclosure: I am part of Trade Nation's Influencer program and receive a monthly fee for using their TradingView charts in my analysis.

Negative Risk/Reward: Hidden Edge or Hidden Danger?It’s a topic that sparks plenty of debate.
👉 Can a negative risk/reward ratio actually be part of a winning strategy?
Here’s our take, split between intraday trading and swing trading:
📉 Intraday Trading
☑️ Pros:
• Can work in high‑probability setups (mean‑reversion, range scalps)
• Quick targets often get hit before stops
• Stops can sit beyond liquidity grabs to protect the trade
⚠️ Cons:
• Needs a consistently high win rate
• Prone to slippage and fast spikes
• Can lead to over‑trading if discipline slips
If used, risk must always be pre‑defined — not adjusted mid‑trade.
⏳ Swing Trading
☑️ Pros:
• Occasionally helps avoid being stopped on deeper pullbacks
• Gives breathing room in trending markets
⚠️ Cons:
• Smaller targets vs bigger stops rarely pay off over time
• Lower win rate on higher timeframes makes it hard to sustain
• Exposed to news gaps & weekend risk
Overall, swing trading works best with positive R/R setups (e.g., 2:1 or higher).
☑️ Summary:
Negative R/R can work — but only if:
• The setup is statistically proven & high probability
• You keep risk strictly pre‑defined
• It fits the pair, timeframe & volatility
Most traders are better off sticking to positive R/R — but for experienced scalpers, negative R/R can be a tool rather than a trap.
💭 Do you use negative risk/reward in your strategy?
Only intraday, or do you apply it to swing trades too?
Drop your thoughts below —we're curious to hear how others approach it! 👇
Thanks again for the likes, boosts, and follows — really appreciate the support!
Trade safe and all the best for the week ahead!
BluetonaFX

GBPUSD – Short-Term Entry Model (Price Action Based)Education time!
This is a quick-execution on GBPUSD this London session based on a failed breakout and structure shift.
Price initially broke above the previous high but failed to sustain the breakout. The second push failed to print a higher high (HH), signaling potential exhaustion. Once the higher low (HL) that led to the failed HH was broken to the downside, a valid short setup was confirmed.
The trade targets the 161.8% Fibonacci extension of the initial move that failed to hold above the high.
📉 Result: The setup played out cleanly, hitting the target with a +17 pip gain.

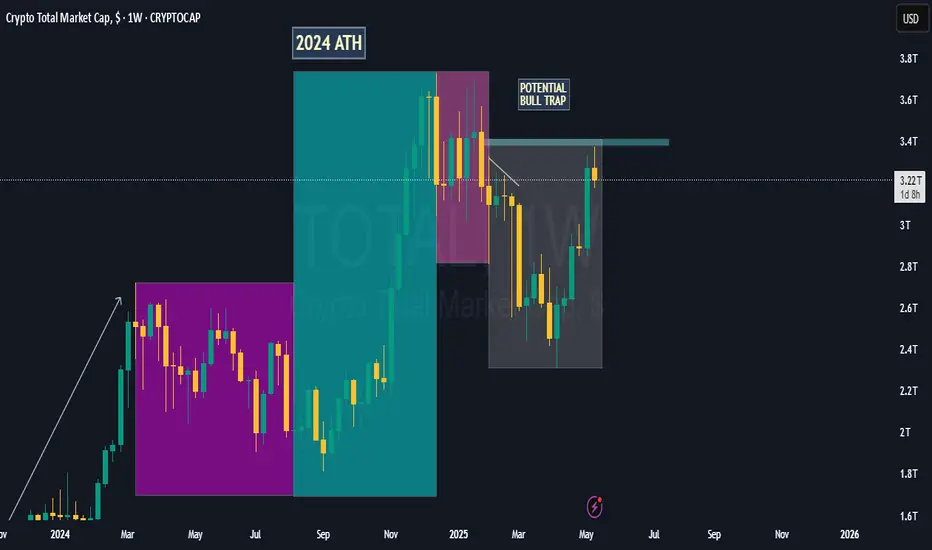
TOTAL - Marked the Top, Price Obeyedhere is the forecast
Please support this idea with a LIKE👍 if you find it useful🥳
Happy Trading💰🥳🤗

TOTAL - CLEARLY A BULL TRAPCalled this earlier but didn't get a single like
Follow for real-time analysis as this plays out

Bull Trap or Bear Bait? The Real Agenda Behind the Crypto PumpThe market just printed a powerful pump—and traders are standing at the edge of uncertainty.
What if the bears are right? What if this sudden surge was nothing more than a carefully staged bull trap, luring buyers into FOMO entries, only to dump hard and leave them holding the bag?
Or maybe…
What if this was a setup for the bears? A calculated move to bait sellers into opening shorts, before a single violent candle wipes them out, triggering mass liquidations on the way up.
It’s a psychological battleground—buyers and sellers clashing at a critical zone.
So, what’s really going on? Is this a trap to crush longs, or a setup to punish the shorts?
Let’s break it down.
What do you think? Vote below: Bull Trap / Bear Bait?
Follow for real-time analysis as this plays out

TAO MOVE IN BOXES - WHICH BOX IS NEXT? UP OR DOWN?Which box do you think is next? The one above or the one below?
TrAde with Caution!
Follow for real-time analysis as this plays out


TAO - Price Action Played out as called Called this short setup last month at $417 and it's currently at $302.47. Still doubting the setup?
Follow for real-time analysis as this plays out

TAO - Could this be the real chart setup?Do you think LSE:TAO can drop to $100 or below?
TrAde with Caution!
Follow for real-time analysis as this plays out

TURBO - Nailed the dropCalled this short setup last month we just hit target. A swing 45% drop happened!
Check it out here
Please support this idea with a LIKE👍 if you find it useful🥳
Happy Trading💰🥳🤗

BABA Stock: A Detailed Analysis using Elliott Wave Theory RulesHello Friends,
Welcome to RK_Chaarts,
Let's analyze Ali Baba Group Holdings Limited, also known as BABA, listed on the NYSE. We'll be using the Elliott Waves theory.
Friends, as we can clearly see, after hitting a low of around $95.75 on 9th April 2025, it started an impulse wave. Within this wave, we've completed intermediate degree blue bracketed (1), (2), (3), (4), (5), and primary degree ((1)) in Black. Currently, we're completing primary degree ((2)), with a low around $111.
If it breaks the level of $111, we'll assume we're still in primary degree ((2)), as marked in scenario 2 on the chart. This means wave ((2)) is unfolding, and wave ((3)) might start after wave ((2)) is complete.
If it doesn't break the $111 level, it's likely that wave ((2)) has completed, and we've started a subdivision of wave ((3)) or its further subdivisions. If it moves further up, following scenario 1 (the black line on the chart), this is a possibility.
According to Elliott Wave theory, wave ((2)) cannot retrace more than 100% of wave ((1)). So, our main invalidation level for this count is $95.75. Yes, BABA is turning up against the 95.75 low, and in the near term, we expect the stock to trade higher.
Somewhere, this stock might move towards $150 or $160 if it doesn't break down below $ 95.75.
I am not Sebi registered analyst.
My studies are for educational purpose only.
Please Consult your financial advisor before trading or investing.
I am not responsible for any kinds of your profits and your losses.
Most investors treat trading as a hobby because they have a full-time job doing something else.
However, If you treat trading like a business, it will pay you like a business.
If you treat like a hobby, hobbies don't pay, they cost you...!
Hope this post is helpful to community
Thanks
RK💕
Disclaimer and Risk Warning.
The analysis and discussion provided on in.tradingview.com is intended for educational purposes only and should not be relied upon for trading decisions. RK_Chaarts is not an investment adviser and the information provided here should not be taken as professional investment advice. Before buying or selling any investments, securities, or precious metals, it is recommended that you conduct your own due diligence. RK_Chaarts does not share in your profits and will not take responsibility for any losses you may incur. So Please Consult your financial advisor before trading or investing.

Guide: How to Read the Smart Farmer SystemDear Reader , Thank you for tuning in to my first video publication.
This video explains the 3-step signal validation process—helping you quickly and precisely anticipate market intent and liquidity dynamics before taking action.
We do not react to noise; we respond with structured execution because we understand the market’s true game.
Listen to the market— this guide is here to sharpen your journey.
Correction Notice (16:58 timestamp): A slight clarification on the statement regarding signal validation :
SELL signals: The trading price must close BELOW the Price of Control (POC) and Value Average Pricing (VAP) without invalidation occurring in both the confirmation candle and progress candle.
BUY signals: The trading price must close ABOVE the Price of Control (POC) and Value Average Pricing (VAP) without invalidation occurring in both the confirmation candle and progress candle.
Multiple signals indicate liquidity games are actively unfolding, including accumulation, control, distribution, and offloading.

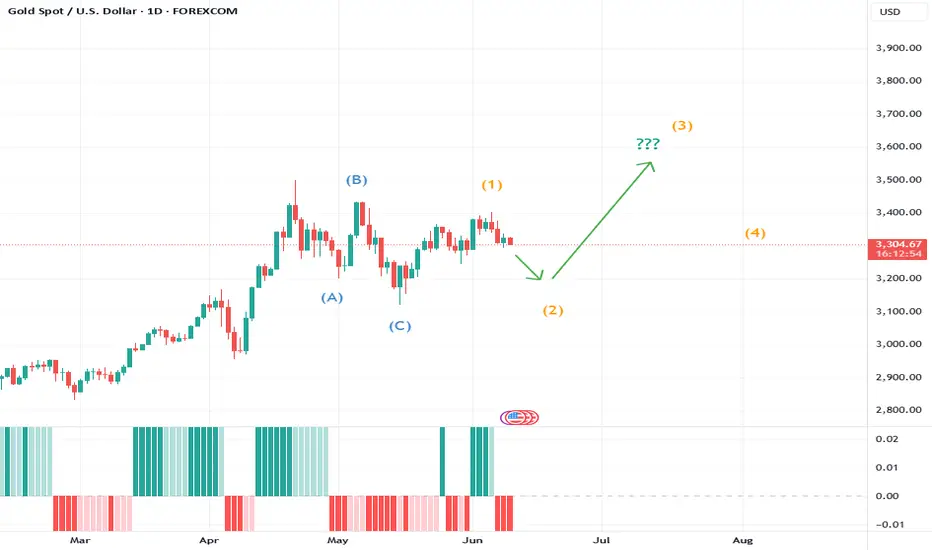
Gold’s Week Ahead: Structure, Scenarios, and What to WatchChart Overview:
Gold (XAU/USD) is at a critical juncture. The recent action shows a completed three-wave correction, and price is now setting up for what could be a powerful motive wave. My primary scenario is a bullish move once the current structure matures, but I’m also tracking alternate counts—flat, triangle, and double zigzag—all of which still point to at least one more push higher.
Why This Count?
The leading diagonal (5-3-5-3-5 or 3-3-3-3-3) for wave 1 fits the textbook, with wave 4 overlapping wave 1—a classic Elliott Wave signature.
The three-wave correction appears complete, which often signals the start of a new impulsive sequence.
I’m watching for confirmation: a completed corrective pattern and a strong move off the lows.
What’s Next?
If the correction finishes and price holds above the wave 1 low, I’ll be looking for a long setup targeting the 100% or 1.618 extension of wave 1.
Invalidation is simple: if the wave 1 low breaks, the count is off and I’ll reassess.
I’ll wait for structure to complete before entering—patience is key.
#EDU/USDT#EDU
The price is moving within a descending channel on the 1-hour frame, adhering well to it, and is heading toward a strong breakout and retest.
We are experiencing a rebound from the lower boundary of the descending channel. This support is at 0.1400.
We are experiencing a downtrend on the RSI indicator, which is about to break and retest, supporting the upward trend.
We are heading toward stability above the 100 Moving Average.
Entry price: 0.1434
First target: 0.1463
Second target: 0.1488
Third target: 0.1522

Gut Feeling Vs. Technical Analysis- How I Take TradesTrading Is Both Art and Science
Every trader, no matter how data-driven, eventually encounters moments when they just know something about the market.
That quiet internal signal:
“Don’t touch this today.”
Or: “Get ready. Something’s coming.”
That’s not random emotion. That’s your gut feeling – and in trading, it's worth paying attention to. But here's the catch:
👉 Gut feeling alone isn’t enough.
👉 Technical analysis alone isn’t either.
The real edge comes when both align.
________________________________________
What Is Gut Feeling in Trading?
“Gut feeling” is a term used to describe intuitive decisions that seem to arise without conscious reasoning. In trading, it often presents as a subtle inner nudge – a warning, a hesitation, or a surge of clarity.
Contrary to popular belief, it’s not just emotion. It’s often the result of:
• Unconscious pattern recognition from years (or decades) of chart-watching
• Internalized market behavior that doesn’t show up on an indicator
• Emotional awareness, sensing when the environment isn’t right to trade
Experienced traders know this isn’t “woo.” It’s pattern memory speaking quietly.
________________________________________
On the Other Hand: What We Call Technical Analysis?
We all know the tools: support/resistance, price action, indicators like RSI, MACD, Bollinger Bands, maybe Smart Money Concepts or just clean trendlines, etc.
Technical analysis gives us structure — measurable, repeatable setups. But let’s not pretend it captures everything:
• News can spike irrationally
• Liquidity can vanish when you least expect it
• And sometimes, the chart says 'yes' but the market mood says 'don’t trust it'
That’s where gut feeling becomes the final filter.
________________________________________
✅ Why I Wait for Alignment
Let’s be honest: most bad trades happen when you force action despite internal hesitation.
Here’s how I frame decisions:
✅ Full alignment
• Gut: Yes
• Technicals: Yes
• 👉 Take the trade
⚠️ Gut says no, but technicals agree
• Gut: No
• Technicals: Yes
• 🚫 Wait – something’s off
⚠️ Gut says yes, but technicals are unclear
• Gut: Yes
• Technicals: No
• 👁 Watch only – do not act
❌ No alignment
• Gut: No
• Technicals: No
• ✅ Stay out – smart decision
You’re not supposed to be in every trade. You’re supposed to be in the right trades.
________________________________________
🔍 Real-Life Example: Gold (XAUUSD)
Yesterday, Gold surged due to geopolitical escalation and renewed tariff tension.
Is looking bullish now: descending trendline broken, above 3350 which acts as confluence support.
📈 The chart said: “Buy.”
🧠 But my gut said: “ No. This is an emotional move. It’s not done correcting .”
So I stayed out.
Why?
Because if I trade while my gut says “no”, I second-guess every tick.
Even if the chart is right, I start hoping it fails — just to prove my feeling was right.
That’s emotional sabotage.
But when gut and chart say the same thing, I don’t hesitate.
Even if the trade loses, I’m at peace. I executed from clarity, not conflict.
That’s not just technical skill. That’s mental edge.
🧠 How to Develop Trustworthy Intuition
If you’re new or inconsistent, your “gut feeling” might just be fear, greed, or FOMO. But over time, real intuition can be trained like a muscle.
1. Screen Time
The more markets you watch, the more silent patterns your brain absorbs. Eventually, you’ll “feel” momentum shifts before indicators print them.
2. Journaling
Write down what you felt before each trade. Did it align with your plan? Over time, you’ll spot which feelings were intuition and which were impulse.
3. Meditation & Clarity
The more you control your emotional noise, the easier it becomes to hear real signals.
________________________________________
⚠️ Common Pitfalls: When Gut Feeling Betrays You
Let’s be clear – not every gut feeling is wise. Here are some red flags:
• Revenge trading disguised as confidence
• FOMO masked as intuition
• Fear of missing out during high volatility sessions
• Fatigue or stress, which distort perception
🧠 Tip: A real gut feeling comes with calm clarity, not urgency or adrenaline.
________________________________________
🎯 Final Thought
Gut Feeling + Technical Analysis = Peace of Mind
The best trades aren’t just technically correct — they’re internally clean. No doubt. No hesitation. No self-conflict.
Wait for alignment. Then execute with full presence.
Disclosure: I am part of TradeNation's Influencer program and receive a monthly fee for using their TradingView charts in my analyses and educational articles.

Tips on Counting Waves: Keep It Simple🔍 The Foundation: Motive vs. Corrective Waves
Every price move can be classified into one of two types:
Motive waves (which move in the direction of the trend)
Corrective waves (which move against it)
From there, we break it down into five core patterns:
Impulse
Ending Diagonal
Zigzag
Flat
Triangle
Each has its own rules and guidelines—but don't get overwhelmed. You don’t need to memorize everything before getting started.
🛠️ Chart Labeling Tips for Beginners
When you're looking at a new price chart (especially a forex chart), here are some practical steps to follow:
Start from an extreme — either a major high or low. That gives you the cleanest structure.
Look for clarity — big, strong moves are usually motive waves. Choppy sideways moves are usually corrections.
Use higher timeframes — if you’re planning to hold long-term, weekly or monthly charts in log scale are most helpful.
Avoid complexity at first — don’t start by labeling patterns like expanding diagonals or triple zigzags. Stick with the basics: 5’s and 3’s.
Remember wave tendencies — Wave 3 is usually the strongest and longest wave in a motive structure. In commodities, though, Wave 5 is more commonly extended.
Look for Wave 3 as a clue — One of the biggest clues when trying to figure out where you are in the Elliott Wave structure is to find Wave 3. It typically has a strong, impulsive character and stands out clearly on the chart. Once you’ve spotted Wave 3, it becomes much easier to build the rest of the count around it.
⚠️ Don’t Force the Count
If the structure isn't clear, don’t try to label it anyway just for the sake of having a count. Trading when the chart is unclear is like driving 100 km/h in heavy fog.
💡 If you can’t count it, don’t trade it.
When you do spot a clean 5-wave move, it often implies that a correction will follow—usually into the area of the previous 4th wave. That’s a high-probability area to watch for setups.
Here’s an example of a clean 5-wave move up. You can clearly see:
Wave 1: Initial surge
Wave 2: Pullback
Wave 3: Strongest move (often extended)
Wave 4: Sideways correction
Wave 5: Final push
🤯 Avoid the “Alice in Wonderland” Trap
Don’t fall down the rabbit hole of switching between timeframes endlessly:
Weekly → Daily → 1H → 15m → 5m → 1m... and still confused.
Take a step back. Zoom out. Look at the shape, the rhythm. The story becomes clearer.
🧩 Patterns Are Probabilities, Not Predictions
Just because a pattern could be something complex doesn’t mean it should be labeled that way. Always ask:
Is it probable, or just possible?
Occam’s Razor applies here: the simplest explanation is usually the best one.
🔺 Reminder About Triangles
If you see sideways, contracting price action near the end of a move, chances are it’s a triangle.
Triangles precede the final wave in a sequence.
Don’t try to get clever and label skewed or complex variations unless you have strong confirmation.
🧠 Final Takeaways
Keep it simple: start with 5s and 3s.
Focus on clear impulse and correction structures.
Don’t trade what you can’t confidently label.
Wave 3 is your guidepost—if you can spot it, the rest often falls into place.
Complexity comes with experience—but you don’t need it to trade effectively.
