EEM testing resistanceIf you're looking to get short the equities market, EEM may be a good place to start. Emerging Markets are testing the previous support trend line. This should now act as resistance. It's worth waiting to see if this hammer candle gets follow through or if it turns into a Hanging Man.
EEM


THE WEEK AHEAD: TGT EARNINGS; XLE, XOP, EEM PREMIUM SELLINGEARNINGS:
TGT (93/52) and COST (91/44) announce earnings next week, with a directionally neutral TGT short strangle shown here paying 3.87 at the mid price, delta/theta 1.01/9.64.
EXCHANGE-TRADED FUNDS ORDERED BY RANK AND SHOWING THE FIRST EXPIRY IN WHICH THE AT-THE-MONEY SHORT STRADDLE PAYS GREATER THAN 10% OF THE STOCK PRICE:
XLE (99/55), April
XOP (97/79), April
XMH (95/54), April
FXI (95/40), May
GDXJ (95/50), April
EWW (95/43), April
USO (91/48), April
EWZ (90/48), April
GDX (89/46), April
XLU (88/26), June
BROAD MARKET ORDERED BY RANK AND SHOWING THE FIRST EXPIRY IN WHICH THE AT-THE-MONEY SHORT STRADDLE PAYS GREATER THAN 10% OF THE STOCK PRICE:
EFA (100/38), June
EEM (95/44), April
IWM (88/42), April
QQQ (83/47), April
SPY (80/42), May
FUTURES ORDERED BY RANK:
/GC (100/20)
/ES (113/40)
/CL (100/51)
/ZC (68/18)
/SI (68/28)
/NG (67/49)
/ZW (11/28)
VIX/VIX DERIVATES:
VIX finished the week at a whopping 40.11 with the /VX term structure in backwardation, so it's an opportunity to add short call verticals or long put verticals in VXX and UVXY if you haven't already done so. For existing spreads (I've got a few), I'll be looking to play the elevator up/down game, rolling the long call aspect of my VXX credit spreads up to lock in profit on that side of the trade and improve my break even. In all likelihood, these will eventually require rolling out for duration come April opex due to the location of the short leg, but I'm fine with that. Pops can happen while you have these on, and you just need to be patient and make the best of them ... .
GENERAL MUSINGS:
For people who are into selling premium and who had large amounts of cash sitting on the sidelines, this is your "kid in a candy store" moment. Non-single name premium selling has finally become productive in that 45 day wheel house, even in broad market, where we were looking at going grotesquely long in duration last week to get paid. For those who had longer-dated premium selling setups on before this volatility expansion (points at self), well, I feel your pain. Be patient and mechanical, and some of that pain will inevitably give way to a volatility contraction going forward.


Global Emerging Markets - Macro Outlook & CommentaryTraders & Investors,
We anticipate emerging markets to be vulnerable to a macro slowdown following the virus outbreak in China. Emerging Markets have a high dependency on Chinese demand and consumption which often creates a very strong correlation between domestic activity/trade and the performance of these markets.
The effects of the virus are prominent with analyst expectations of substantial drops in Chinese Q1 GDP, dovish positioning of the Monetary Authority of Singapore, sell off in Crude/Brent, gaps lower in Asian Equities and flows into risk-off assets.
Following the euphoric bull run in 17'/18' and pullback into fair value, we see price correcting for a move lower into our buyside floor and macro swing targets of 34.0x.
We have added sellside exposure across both our macro and directional portfolios
-------------------------
We look forward to continuing to provide market leading analysis to traders & investors alike across the TradingView platform.
Like, subscribe and leave your comments below!
Until next time,
Portier Capital
Macro Strategy & Portfolio Management

Update on AAXJAAXJ broke the trend line. 70.11-68.83 is the next horizontal support range. Not touching this until it holds a support. Wouldn't be surprised if it drops all the way down to long term diagonal support

Update on AaxjMy price target has been met. Let’s see if it holds. If we break this resistance line the next horizontal line of resistance is around 76.88

Key decision pointThe $DXY is reaching a key decision point. It’s teetering on a very key level. Looks like it is breaking down. If it holds. Looks like a double bottom. If it fails it will be putting in lower highs and lower lows

EEM broke above range, while US dollar broke below trendlineEEM consolidated forming a range since the December 2018 low. As DXY - the US dollar index broke below the 18-month rising trendline, EEM has been trending up since the August 2019 low and broke above the range last week, reaching 45.2, an 18-month high. Momentum suggests further upside is likely. However, since the 45 area is a major resistance area over the past two years, EEM may consolidate first before breaking through the 45 areas to test the 52 peak in January 2018.
Happy Trading!

EEM - DAILY CHART Hi, today we are going to talk about iShares MSCI Emerging Markets ETF and its current landscape.
The emerging markets today can face an increase of volatility and perhaps pessimism as Trump's stated that will reinstate Steel and Aluminum tariffs for Brazil and Argentina since, in his perspective, both countries are devaluating their currencies to be "unfairly" competitive in the sale of agricultural goods, which is negative for U.S farmers. We must remember that since the beginning of the Trade War, China has stepped into the gas pedal in buying Brazilian agricultural goods, and the Brazilian currency has reached new record lows against the U.S dollar, which theoretically bases Trump's argument. This could be bad news for the market if imply a new Trade War front against these Latam countries, that doesn't have China firepower to sustain a tariff battle against the U.S.
Trump's movement could be clearly interpreted as an endeavor to take these competitors of the road, to try to suffocate China's lifeline of agricultural goods, and maybe force them to become more friendly with the idea of expanding their spending on U.S agricultural goods.
Thank you for reading and leave your comments if you like.
To have access to our exclusive contents, join the Traders Heaven today! Link Below.
Disclaimer: All content of Golden Dragon has only educational and informational purposes, and never should be used or take it as financial advice.


$USDZAR ObservationAfter Moody's decision on Friday night to downgrade South Africa's credit outlook to negative, there is a keen amount of interest in the direction of the rand and I thought it would be useful to make an observation in this regard.
Firstly, it is interesting that the rand has made 3 lower swing high's since tagging the 15.44 horizontal resistance level back in August. This does indicate some sort of strength in the price action so perhaps one shouldn't get too negative at this point in time. We likely have a bit of time to buy until the next important budget speech in February 2020.
The area between 14.50-14.60 has been an important zone of support & resistance this year and what makes this level even more important is that we currently have the 200 day moving average @ 14.476 rising by about half a cent a day. This will likely be a tough area to crack and should we trade back into that zone, then there is that possibility that a return of a risk off environment in global markets could stop the rand from making much further headwind. The market left an open gap @ 15.00 created by Moody's announcement on Friday after FX markets closed & there is no doubt that the rand bears are licking their lips in anticipation of this gap closing.
The RSI is constricting in the form of a triangle, which leads me to believe that price action will also likely stay quite tightly range bound.
In a nutshell, my view is that we could likely trade in this range between 14.50 to 15.00 until the annual budget next year in February 2020 (in the absence of any other global market developments). Watch for a reversal off the 200 day moving average @ 14.50 should we trade there in order to initiate a short position in the rand with a view that it trades higher to close the gap @ 15.00.

EW Analysis: Bullish Emerging Markets May Push EURUSD HigherHello traders!
Today we will talk about emerging markets(EEM) and EURUSD.
As you can see in the first chart, there's a positive correlation between emerging markets and EURUSD. Of course, there are no tick by tick correlations, but the current wave structure it's telling us that we may see a bigger recovery in the upcoming days/weeks.
Emerging markets can be trading in a three-wave (A)-(B)-(C) recovery up to 61,8% Fibonacci retracement and 46 area, especially after that break out of the corrective channel, so in our opinion EEM may easily stay in the bullish trend.
At the same time we can see strong and impulsive recovery on EURUSD, which is telling us that the temporary bottom can be in place and a bigger three-wave (A)-(B)-(C) correction can be underway up to 1.15 - 1.18 area, mainly because of break out of the wedge pattern (ending diagonal).
Notice that these are daily charts and they may take some time to completely unfold, so don't get confused on the smaller time frame charts. We just want to give you an idea, where the markets can be headed long/mid-term.
Be humble and trade smart!
If you like our analysis, then please give us a like and share it!
Disclosure: Please be informed that information we provide is NOT a trading recommendation or investment advice. All of our work is for educational purposes only.


THE MONTH AHEAD (IRA): EX. CANADA/U.S. ETF'S FOR DIVIDENDSIt shouldn't come as a massive shocker to anyone that the U.S. market has been and has gotten even more expensive. For an investor that is just starting out, it is enormously frustrating, since virtually everything is at the top of a very long term trajectory with the broad market yet again knocking at the door of all-time-highs.
Here are a few acquisition ideas for ex. U.S./Canada exchange-traded funds that pay in excess of SPY (1.90%), IWM (1.33%), QQQ (.84%), and DIA (2.21%) and TLT (average 20-year maturity treasuries) (2.22%). To put things in some additional context: HYG (High Yield Corporate Bonds) is paying 5.29% (paid monthly), EMB (Emerging Market Bonds) -- 5.45%, XLU (Utilities) -- 2.93% (paid quarterly), and IYR (REIT) -- 2.63%.*
EEM: Emerging Market. It gets huge volume (79 million 90-day) and is extremely liquid on the options side of things. The downside is that you get about TLT is currently paying in yield -- 2.22%, paid out quarterly, and fund managers had to muck it up by sticking a whole bunch of China in there. If I wanted to play a Chinese exchange-traded fund, I'd play one (e.g., FXI).
EFA: Behind the funky acronym (MSCI EAFE), this is basically a world excluding the U.S. and Canada exchange-traded fund. Sporting a 3.18% yield, it pays dividends every six months, trades healthy share volume (90-day average 18.3 million), and has good options expiry availability and liquidity, a must for investors looking to go short put/acquire/cover.
EWA: Australia. Granted, the share volume isn't great (1.7 million 90-day), but the yield is 5.54%. Expiry availability isn't fantastic and neither is option liquidity. Dividends pay out twice a year. 21.82/share as of Friday close.
EWG: Germany. 90-day 1.98 million shares average. 2.83% paid once a year. Decent expiry availability/liquidity. 26.44/share as of Friday close.
EWI: Italy. 90-day 1.90 million shares on average. 4.63% paid out once every six months. Expiry availability/liquidity isn't great, with the general solution being to be "fill picky." 26.95 as of Friday close.
EWW: Mexico. 90-day 3.20 million shares traded on average. 4.17% paid out twice a year. Good expiry availability and option liquidity. 43.64 as of Friday close.
EWT: Taiwan. 90-day 5.80 million shares traded. 2.74% paid out once a year. Expiry availability isn't great and neither is options liquidity. 36.71 as of Friday close.
EWZ: Brazil. 90-day 21.58 million shares traded. 2.71% paid out every six months. Excellent expiry availability/options liquidity. 42.11 as of Friday close.
RSX: Russia. 90-day 5.58 million shares traded. 4.31% yield paid out once a year. Expiry availability/options liquidity decent and decent. 22.51 as of Friday close.
The general play on these would be short put, acquire, then cover. Naturally, you'll probably want to drill into the charts on each of these to determine which ones might be trading at a discount.
* -- IYR, XLU, and EMB have ripped higher recently, so are kind of out of range of prices at which I'd like to acquire. Forever the optimist, however, I've got a couple "not a penny more" short puts hanging out there in XLU and HYG. (See Posts Below).

EM/DM stocks vs Gold price - Sep 25 Update No major change since June. Still, either EM is very cheap vs DM or Gold is very expensive. This should correct in coming weeks
OPENING: EEM MARCH 20TH 2 X 3 33/46 SHORT STRANGLE... for a 2.00 credit.
Metrics:
Max Profit: $200/$100 at 50% max
Max Loss/Buying Power Effect: Undefined/$1120
Break Evens: 31.98/46.68
Delta/Theta: 1.51/-3.36
Notes: I had to putz a bit to accommodate skew on the call side ... . Will look to take profit at 50% max, adjust on test of side break even or on side approaching worthless to avoid its going no bid.

THE WEEK AHEAD: GDX, GDXJ, XOP, EEM, VIX/VIX DERIVATIVESEARNINGS
No options highly liquid underlying earnings announcements this coming week.
EXCHANGE-TRADED FUNDS
Ordered by implied volatility rank, with GDX, GDXJ, and XOP providing the best rank/implied volatility metrics for premium selling (>50% rank/>35% implied):
SLV (96/29)
GLD (95/18)
GDX (82/35)
GDXJ (80/40)
TLT (69/16)
FXI (54/26)
XOP (52/43)
The 16 delta GDXJ Oct 18th 36/49 short strangle is paying 1.16 at the mid price (.58 at 50 max), the GDX Oct 18th 30 short straddle, 3.19 (.80 at 25 max), and the XOP Oct 18th
21 short straddle, 2.67 (.67 at 25 max).
BROAD MARKET
EEM (51/23)
IWM (48/25)
SPY (43/20)
QQQ (35/25)
EFA (22/17)
Pictured here is an EEM 1 x 2 short strangle in the January cycle with the short put camped out at the 18 delta, the doubled up short calls at the 8's to accommodate skew. Paying 1.18 at the mid price (.59 at 50% max), it has break evens of 32.82/45.59 and delta/theta metrics of .97/1.56.
Alternatively, the Jan 17th 39 short straddle is paying 4.32 (1.08 at 25 max).
If EEM doesn't suit your fancy, the IWM Jan 17th 131/156 short strangle camped out around the 16 deltas is paying 2.16 at the mid price (1.08 at 50 max); the QQQ Dec 20th 16 delta 158/202 short strangle pays 4.05 (2.02 at 50 max); and the SPY March 20th 240/315, 7.39 (3.70 at 50 max).*
VIX/VIX DERIVATIVES
Continue to look to add small, bearish assumption plays in VIX/VIX derivatives on VIX prints of >20, with higher prints naturally being better. With the derivatives in particular, look to VIX levels as the guide for entries and not to the derivative itself (e.g., UVXY, VXX), since beta slippage and contango plays into these derivatives, making it more difficult to discern levels. The general plays remain: at-the-money VIX long put verticals or short call verticals paying at least one-third the width of the spread in credit (or, in the case of the debit spread, less than two-thirds the width of the spread in debit) and with UVXY and VXX, short call verticals with similar metrics.**
* -- Why the different expiries? I've been generally running broad market plays through a gauntlet of at-the-money delta neutral short straddle pricing prior to deciding which expiry begins to be "worthwhile," looking for the short straddle to pay at least 10% of the stock price. If the ATM short straddle isn't paying that, it isn't worth putting on a short strangle in shorter duration for me. The downside is that longer-dated setups are slower to come in and therefore tie up buying power for longer. The upside: they're wider setups relative to current price, so less subject to shorter term whipsaw.
** -- As previously pointed out, there is assignment risk with UVXY and VXX, and I'd rather be short shares via assignment on a short call than long shares via assignment on a short put. VIX is cash settled with no assignment risk, so whether there is a short put aspect or short call aspect is of little import for a VIX play.

Short the $HYG Rejected Top of Previous Support Now (Resistance)Rejected past support now serving as new resistance level two days ago. See below. Do not trade based on my opinion. I am short HYG with puts.


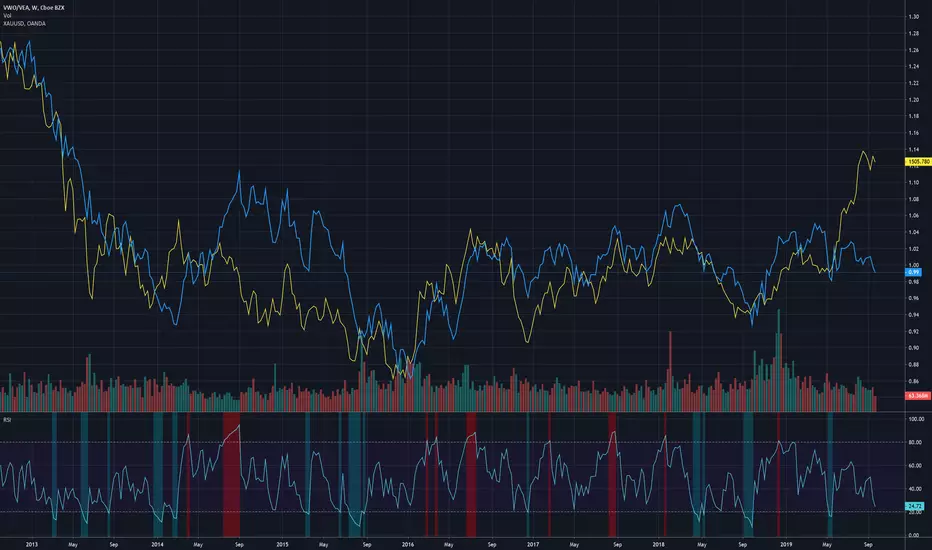
EEM & US Dollar. When with the global rotation pay off?Asia is getting very close to completing their EM development and will eventually move away from pegged regimes vs the USD as the US slowly fades in terms of GDP percentage vs the world. That is how it worked with the Euro and its only a matter of time with the Yuan. With China just starting to very slowly let their currency depreciate to boost growth and capital flows starting to move towards JPY and CHF as world markets evolve and seek safety in the transition, its unclear if the USD will be a safe haven this time around. The US market is currently the only market in the world with a higher value than previous periods. Once the world begins to recover, its hard to imagine global capital flow will remain in the US with its overvalued valuations and expected decrease in growth and productivity. Especially as all other global markets have extremely undervalued valuations and are further along in development and implementation of 21st century digital economic infrastructure. Global US denominated debt vs US monetary base may make the supply of USD thin and should hold up the value relatively well over time and should slow down its domestic inflation as the world de-dollarizes. However, its unclear if this dollar shortage is actually enough to tip the scales enough to create an extremely strong dollar that can lock up the current system. It seems obvious that market participants around the world are itching to shift their capital out of the US and EEM is a simple way to track the progress and developments with the dollar. If EEM breaks its long term structure, it will be obvious which direction the dollar appreciation/depreciation debate has gone. Hedge Funds clearly made the dollar weakness bet and rotated into EM Q1 and Q2 2019 but it did not pay off. As of 8/19/19 it is clear the global rotation is not quite ready with US long term yields collapsing to all time lows as Europeans seek safety and China not recovering as expected. Perhaps the key turn will be in Q4 2019 when China starts to show recovery and Europe handles Brexit along with its recessions. It seems evident that US markets can maintain their tall peaks regardless of domestic growth as long as capital flow does seek greener pastures.
