EGLD going to $4000?!EGLD is nicely following an upward channel that can hint us the next targets for this coin in long term up to about $4000.
Do Dollar-cost averaging and buy this coin.
Muneeb
EGLD

EGLDUSD - TriangleEGLD formed a triangle.
Support at 21-EMA-Daily.
Next support line at 220 USD.
Just an idea.

EGLD, I'm expecting a big move, 305 then 460 .. or south 201 ?Only consolidation at my previous ideea, and some more levels.
We are moving in wedges since last ALTS market wake up.
The only worrying reason for me is the EGLD vs BTC graph ( the picture on the right ) witch gives us a new sell signal on MACD on 5 days candles... Let's see...
Big fundamentals ahead and DEX coming live soon...
We could see the TOP diagonal (red line) becoming the next support and launching pad for the candles to come, I would very much like that, and it is possible to see next, or to reconfirm as the ATH top diagonal and to see a new rejection from this line.
This is my personal opinion, not a financial advise!
Take care of your hard made money guys!
CHEERS!!!

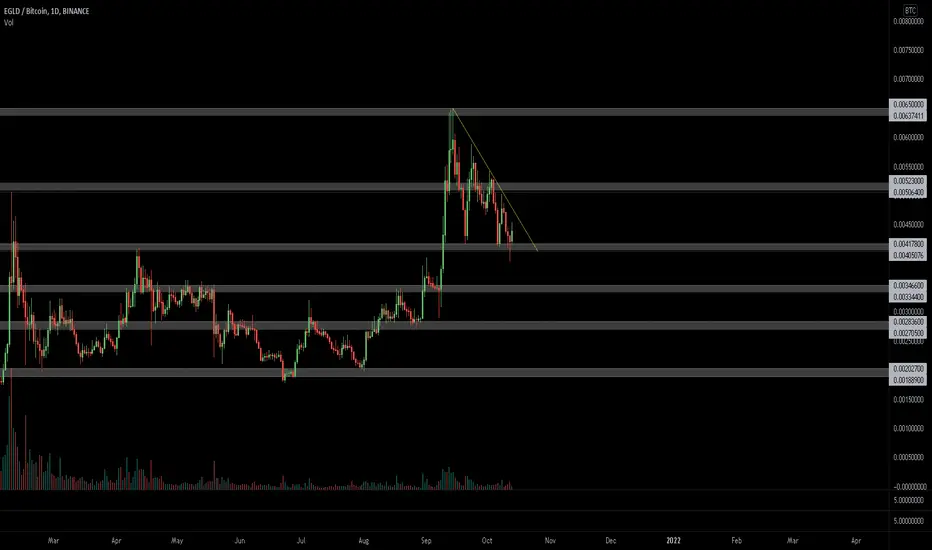
$EGLD /BTC, Trapped on a LH-LL sequence over the last month$EGLD /BTC
Trapped on a LH-LL sequence over the last month
Not very interested into taking a position till this sequence is broken(descending trendline may help)
UCTS backtest being REALLY strong on this on the daily chart so a Buy signal should be a trigger
Wait for now
#EGLD


$EGLD MISSION10 Repeat patternThere's a high chance Elrond's EGLD will repeat the same pattern as beginning of 2021. If so, then we would see an uptrend of approximately 70% towards the $423 mark in the next few weeks. With upcoming news towards their Maiar DEX launch and LaunchPad this year, chances are high Elrond is currently loading up for a big leg up.

🔥 EGLD Finally Broke Out: Bull Trend ContinuedAround a week ago I made an analysis on EGLD. Here I argued that EGLD was following a bullish channel and was most likely making a shot for a new all time highs in the near future.
As of today, EGLD has finally broken out of the $255 resistance. Currently, BTC is slightly bearish, and EGLD is testing the $255 prior resistance as support. In case the $255 support holds, I'm looking at a strong move towards $300, potentially $325.
In case the support doesn't hold, expect the channel support to offer a potential bounce.
Happy trading!


Can EGLD create a New ATH soon?Hi every one
EGLD / TETHERUS
EGLD has formed an Ascending Triangle which has not been Broken yet! the Price still has a chance to range in this Pattern. The Price can Do a break out soon and when It happens, EGLD can Increase as much as the measured Price movement.(AB=CD) if it happens, we will see EGLD at 340$ which is a new ATH for EGLD.
summery:
-EGLD is in a Bullish pattern( Ascending Triangle)
-No break out yet!
-It's Gonna Increase as much as the measured Price movement (AB=CD)
-Creating a New ATH is possible Right now!
💎Traders, if you liked this idea or have your opinion on it, write in the comments, We will be glad.
Things can change...
The markets are always changing and even with all these signals, the market changes tend to be strong and fast!!
Thank you for seeing idea .
Have a nice day and Good luck

Bullish pennant in EGLD 4h !In EGLDUSDT 4h
There is a bullish pennant .
If it breakout and goes up 1(258.85) .
Le'ts setup
SL:236.74
TP1:282.58
TP2:292.18
TP3:312.78
TP4:346.11

WHY 100% bull market? Let me show you EGLD, BTC.D & more (PT.2)In this first video, I'm going to show you why we are 100% in a bull market and why we could go for a multi-year bull market with multiple bearish months in the middle.
It's easy:
- look at the overall structure of the dollar index chart
- look at the monthly indicators
A weaker dollar = a stronger crypto right?
Well, what if...

WHY 100% bull market? Let me show you EGLD, BTC.D & more (PT.1)In this first video, I'm going to show you why we are 100% in a bull market and why altcoins are going parabolic in October and maybe early november.
It's easy:
- look at the overall structure of the charts
- look at the moving and exponential moving averages daily crossing
- look at the weekly charts
Also, I'm speaking about a new scenario when it comes to the bull market which I called "the DOLLAR scenario". It will be discussed in Pt.2

EGLD looking bullish on daily TFTrendline break +
Positive RSI +
Price above 50MA with enough space in between +
Buying volume growing +
No significant volume +
A sequence of demand zones created below price +
BTC is at a daily supply zone -

EGLD.BTC (Y21.P6.E1).Toping formationHi All,
Looking at the current climate, even though we have Alts moving today, I think EGLD against BTC is doing a ascending wedge and is likely to do something like a double top before dropping down based on the wedge formation. The only way this seems possible is that BTC in my opinion does a big bull run and the ALTs are left behind, including EGLD. Once BTC hits a major milestone, it will then give the ALTs the opportunity.
Using my method when it comes to wedges, to me its highly likely this is the case. Look at the weekly chart below where the RSI agrees as well, with Bearish Div.
I'm going to use this theory and apply it to a few alts to see if this resonates with many main Alts. and then make my conclusion. For now, its only a hypothesis.
What do you think?
BTC dominance , then a double bottom.
Cheers,
S.SAri

🔥 EGLD Bullish Channel Continued: P2Around a week ago I made an analysis on EGLD. I argued that there was a decent chance for the price to follow the bullish channel in the near future.
In the end, the price needed one more re-test of the channel's support line to confirm the trend.
As it stands now, a bullish reversal is in place, and we're looking at a decent upside move. First, the $255 resistance has to be broken, which I think won't take much longer. Main target of the current move is $300, the current ATH.
Happy trading!

eGLD on the move slightly eGLD on the move slightly and it's Friday, Hey where Smokey @?!! LMAO!!! WhenMoon?!!

SOL Hits half waySol as predicted broke out nicely with great volume as we discussed was likely, now we have hit half way of our short term swing trade 32% target profit. A nice little breather here after a huge pump and we will go on another rune towards target.

eGLD Elrond breaktout After spending month long in pattern it has broken to the upside. TP targets marked in yellow.

EGLD trade entered againAfter a huge 80%+ trade we are back in a swing in EGLD. Clear break of resistance and nice increase in volume. had a nice retracement and now ready for another big run.

🆓Elrond (EGLD) Oct-1 #EGLD $EGLDEGLD is very strong and it could approach the 260$ and 300$ zones in next days. But if it loses 220$ zone again, it will fall down to 180$ zone
📈RED PLAN
♻️Condition : If 1-Day closes ABOVE 220$ zone
🔴Buy : 220$
🔴Sell : 260$ - 300$
📉BLUE PLAN
♻️Condition : If 1-Day closes BELOW 220$ zone
🔵Sell : 220$
🔵Buy : 180$
❓Details
🚫Stoploss for Long : 10%
🚫Stoploss for Short : 5%
📈Red Arrow : Main Direction as RED PLAN
📉Blue Arrow : Back-Up Direction as BLUE PLAN
🟩Green zone : Support zone as BUY section
🟥Red zone : Resistance zone as SELL section
🅰️A : The Close price of 1-day candlestick is Above the zone
🅱️B : The Close price of 1-day candlestick is Below the zone

SOL - We were ready for thisSOL has broken out nicely as per my previous post, entered just before the BTC pump and volume pouring into SOL, sit back and enjoy the show.
