EGLD Breaks Key Downtrend – Is This the Beginning?📊 Detailed Technical Analysis (Daily Timeframe):
🔍 1. Market Structure & Chart Pattern
Major Downtrend Line Breakout – Reversal Signal:
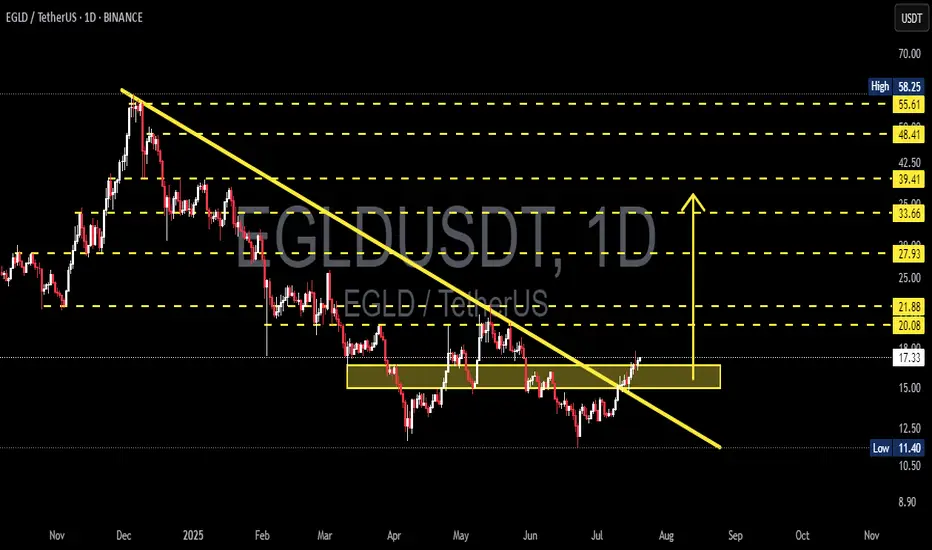
After being stuck under a persistent downtrend for nearly 9 months, EGLD has officially broken out of the descending trendline, signaling a potential shift from distribution to expansion phase. This breakout is significant and could mark the beginning of a new bullish trend.
Double Bottom + Accumulation Range:
Price action shows a clear double bottom formation within the $13.00–$16.50 range, which acted as a strong accumulation zone. This horizontal structure suggests buyers have been silently accumulating before triggering this breakout.
Resistance Turned Support (RBS):
The breakout is now being retested around the $17 level. If EGLD holds this area, it would confirm a support flip, which is a classic bullish signal. Holding above this zone would give bulls full control over the next moves.
🟢 2. Bullish Scenario (Base Case):
If the breakout sustains with increasing momentum:
✅ Short-Term Targets:
$20.08 and $21.88 – minor historical resistance levels.
✅ Mid-Term Targets:
$27.93 and $33.66 – key levels aligning with measured move targets and Fibonacci retracements.
✅ Long-Term Targets:
$39.41, $48.41, up to $55.61–$58.25 – previous key highs and psychological zones.
💡 If EGLD successfully retests and holds above $17.00, it presents a strong opportunity for trend-following entries with favorable risk-reward.
🔴 3. Bearish Scenario (Alternative Case):
If this breakout fails (false breakout scenario):
⚠️ Price could fall back into the previous accumulation range between $13.00–$15.50.
A breakdown below that range could drag EGLD further down toward $11.40, or even $10.00 – a crucial long-term support zone.
Lack of volume or weak bullish confirmation would be early signs of a failed breakout.
🧠 4. Sentiment & Broader Context:
🌐 This breakout comes at a time when altcoin capital rotation is starting to emerge as BTC dominance cools off.
🚀 EGLD, as a smart contract platform, historically performs well during altseason waves and ecosystem narratives.
✅ Final Thoughts:
> EGLD has printed a significant breakout from long-term bearish control. With accumulation completed and momentum building, this may be the beginning of a bullish cycle. However, staying above the $17 level is the key validation to confirm this trend reversal.
#EGLD #EGLDUSDT #CryptoBreakout #AltcoinSeason #TrendReversal #CryptoAnalysis #TechnicalAnalysis #BullishSetup #DoubleBottom
Egldusdtidea
EGLDUSDT 1D AnalysisEGLD ~ 1D Analysis
#EGLD Buy back gradually from here if you still have confidence in this coin with a short term target of at least 15%+ from here.

EGLDUSDT 1D AnalysisEGLD ~ 1D Analysis
#EGLD Buy after successfully penetrating this resistant line with a short -term target of at least 10%+.

EGLDUSDT 1WEGLD ~ 1W Analysis
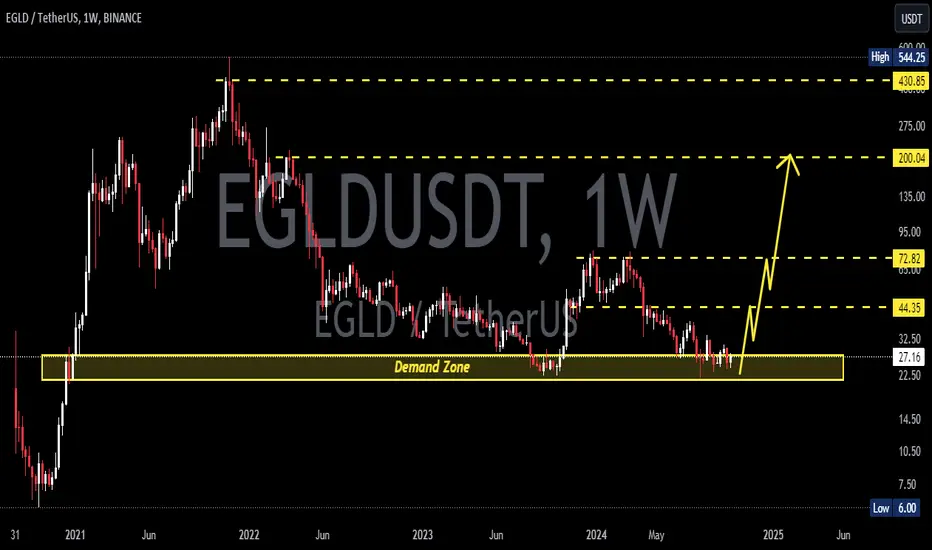
#EGLD This is the lowest support for now. Buy from here if you still have a Conviction on this coin with a minimum target of 20%+

EGLDUSDT 1WEGLD ~ 1W
#EGLD So far it still maintains this support Block. if you still have Conviction on this coin,. Buy in stages from here. minimum target 20%+

EGLDUSDTEGLD ~ 1W
#EGLD so far maintaining this demand zone.
Make purchases in stages with a short term target of at least 20%+ from here.

EGLDUSDTEGLD ~ 1W
#EGLD so far maintaining this demand zone.
Make purchases in stages with a short term target of at least 20%+ from here.

EGLDUSDTEGLD ~ 1W
#EGLD so far maintaining this demand zone.
Make purchases in stages with a short term target of at least 20%+ from here.
EGLDUSDTEGLD ~ 1W
#EGLD so far maintaining this demand zone.
Make purchases in stages with a short term target of at least 20%+ from here.

EGLDUSDTEGLD ~ 1W ✅
#EGLD Price returns to our buy zone. Make purchases in stages with a minimum target of 20%+

EGLDUSDT 1WEGLD ~ 1W
#EGLD This is important support for $EGLD. and has the potential to form a double bottom-up.
We are starting to place small buys here for at least a 20%+ upside

$EGLD BULLISH FROM HERE !#egld/usdt is breaking out of a trendline on the 8-hour time frame🧐
An upward price movement is anticipated following this breakout✈️
BINANCE:EGLDUSDT

EGLDUSD 1WEGLD ~ 1W
#EGLD this is the first support block holding the price of CRYPTOCAP:EGLD so far.
We placed our first purchase here, Target at least 15%+ from here

EGLDUSD 1WEGLD ~ 1W 📈
#EGLD Make purchases gradually starting from here, the Bulls will soon start dominating from here, Target at least 20%++ from here. 🔼

EGLD MultiversX top buying zonesHi everyone, here's a scenario for EGLD that, let's say, takes a hefty beating. Unfortunately, EGLD has opened a door to one. Sadly, this scenario could pave the way for a downward impulse in this Main Zone Z (in blue). Essentially, the Z's can do anything. The strongest structural supports are found at $24.66, $21.12, $19.70, $10.36, $9.18, and $7.33. The pole of the LARGE M Pattern formed points to $7.83.
We also have the fibs that position the Z around $20, $10.87, $7.52, or $4.03.
I really like the potential zone ranging between $10.36 and $6.30 if the 19.70$ doesn't hold.
Liquidity is currently "manageable," but stagnant. Interest rates are high, and inflation is fluctuating. This could impact risk assets in the coming months. The consumer price index continues to rise, with an increase of 22% over the last five years. The Fed's reverse repo facility is a good indicator to monitor the Fed's monetary policy. It is currently declining, affecting liquidity in the financial system.

EGLD And the Promising RewardHi Everyone;
today we have one of the best risk to reward Investment opportunity
it is more than 570 times the risk and the chart is look very promising.
I expect breaking the previous bear market key point will clear the way to the final target.

EGLDUSDT Elliott Waves Analysis (Local Setup)Hello friends.
Please support my work by clicking the LIKE button👍(If you liked). Also i will appreciate for ur activity. Thank you!
Everything on the chart.
Entry: market and lower
Targets: 52 and 60
after first target reached move ur stop to breakeven
Stop: under 40 (depending of ur risk). ALWAYS follow ur RM .
RR: 1 to 4
risk is justified
Good luck everyone!
Follow me on TRADINGView, if you don't want to miss my next analysis or signals.
It's not financial advice.
Dont Forget, always make your own research before to trade my ideas!
Open to any questions and suggestions

EGLD/USDT: Potential Breakout and Bullish Move
EGLD/USDT has been showing signs of a potential breakout on the chart. Based on technical analysis, there is a possibility of a bullish move ranging from 150-250% in the mid-term.
Investors should closely monitor the support and resistance levels for confirmation of the breakout. Additionally, it is important to pay attention to the trading volume to gauge market sentiment. To manage risk, stop-loss orders can be set below the support level.
Overall, if the breakout occurs, EGLD/USDT could provide a profitable opportunity for investors.

EGLDUSDT Analysis (Local Setup)Hello friends.
Please support my work by clicking the LIKE button👍(If you liked). Also i will appreciate for ur activity. Thank you!
Everything on the chart.
Entry: market and lower
Target zone: 70-75
after first target reached move ur stop to breakeven
Stop: ~47 (depending of ur risk). ALWAYS follow ur RM .
Risk/Reward: 1 to 3
risk is justified
Good luck everyone!
Follow me on TRADINGView, if you don't want to miss my next analysis or signals.
It's not financial advice.
Dont Forget, always make your own research before to trade my ideas!
Open to any questions and suggestions.
