BTCUSDTBTCUSD repport.
BTCUSD the downtrend continues.
As you can see buyers is weak.
I suppose that BTCUSD will continue the downtrend to 18600.
Don´t forget like and support for more ideas.
Any questions contact me.
Best regards.
Ehtereum

🎲 #ETHPERP #SHORT #SCALP 🎲🎲 #ETHPERP #SHORT #SCALP 🎲
"Roll The Dice"
Risk
- Med-High
Entry Conditions:
- Lost Multiple local supports
- Money flowing out of market heavily ahead of the Weds Inflation announcements
News Source:
- Fed Announcements on Weds will disrupt market
ENTRY: 1308
TP1: 4.7%
1248
TP2: 8.64%
1195
SL: 2.67%
1343

ETH Daily chart update.All predictions on ETH went well.this is just a possible path for ETH,too soon to tell but it's good to keep the scenario in mind.
a CLEAN breakout from 1400 zone could lead to higher prices.if this happened,wait for confirmation and enjoy!
I will update this idea later!good luck all!

ETH SHORT TERM UPDATEEthereum is in a decisive position. Above the mid-term trend line support and below the short-term resistance. But RSI shows an increase

EHT short ideaNFA, DYOR, everything I see on the chart. The previous breakout was fake, this down channel is drawn on daily TF with only candle bodies included, dotted line above represents the extreme point of it. Price can go up from here but volume is low, I think one more push to the downside is needed to meet the daily demand zone and the trendline before price rises again, probably RSI will be oversold until then. Have good luck, and enjoy the process of learning.

ETH moving Hi guys, here is yet another idea. If we hold on, on our trend line and we do not fall under, there is a big chance of jumping up to 0.786. Otherwise, we will probably fall to 1564. Eventually 1543 can get tested as well. What do you think?
If you find this helpful please hit that boost button!

ETHEREUM WEEKLY REPORT Hello fellow traders!
Yes, we have been on a bearish run for some time, but it seems like the crypto market is trying to pull back.....and its showing. As you see, ETH has been on this slow progressive positive run, riding this channel perfectly. This momentum can lead to a big positive bull run soon or the complete opposite.
ETH is looking good and steady based on the slow positive climb its attempting. The crypto market is hostile as we all know, so please do your own research and trade responsibly.

Looks bullish... 1.50 soon?Looks bullish and waiting to lift off. May be some pending news will do the magic run.

Bitcoin, big chance for break up reasons:Bitcoin, big chance for break up reasons:
- volume increased at high so much
- squeezing to a trend line
- big potential reward
Yes I know that Global trend os down and the local trend is down but we use an SL if the price goes against us

ETH Breaks Below 1k! What's Next?A few articles ago, I talked about ETH breaking the weekly trend line (teal) and the next major support being $800. Seeing as we just broke $1,000, I strongly believe that is the next target.
The macro environment has been extremely bad the past couple of months and is showing no signs of slowing down (30 year fixed rate mortgages are approaching '08, '09 levels). ETH broke below its 200 EMA two weeks ago and is now on a trajectory for my first DCA weekly support of $800. After that, I'm looking to purchase more at $530, then $308 (the next weekly support levels).
The Whales buy-sell indicator gave us a great short entry towards the end of April and hasn't flashed a buy yet. I'm still waiting for the indicator to flash a buy, as well as ETH to cross back over the 200 EMA . Until this happens, I am still only looking for leverage shorts and spot buying at my predetermined weekly support levels. If we bounce from here, the next major resistance will be near 1400-1500 which coincides with weekly resistance and the 200 EMA .

BITCOIN : THE GREEN MAGIC BINANCE:BTCUSDT
this is the analyse of bitcoin nothing to say just wait for the break out of resistance trend line and watch the green magic enter long and dont forget youre risk managment .


ETH moves sideways around $1,800, break lower incoming?Ethereum price analysis is bearish today as we have seen further consolidation and an inability to recover over the last 24 hours. Therefore, ETH/USD should follow along with the overall trend and break lower again by the end of this week.
The market has traded with mixed results over the past day. The leader, Bitcoin, lost just 0.23 percent as consolidation continued, while Ethereum saw a slight gain of 0.21 with similar price action. Meanwhile, Chainlink, Vechain, and Tezos were the top performers from the major altcoins with over 6 percent gain.
ETH/USD traded in a range of $1,777.97 to $1,827.29, indicating mild volatility over the last 24 hours. Trading volume has declined 44.08 percent, totaling $12.4 billion, while the total market cap trades around $218.47 billion, resulting in a dominance of 17.56 percent and a market rank of 2nd place.

ETH long ETH is a very important support in the daily time frame and can be considered much higher prices for ETH in the long run.
ETH 1D

ETHUSD Wave And Trend AnalysisETHUSD Wave And Trend Analysis
Be sure to stick to Stop Lost and TAkE Profit. This is an idea and not a bargain offer
This is just idea, not trading advice, use at own risk.
reasons:
It is recommended to buy in this price limit
It is mandatory to pay attention to the stop loss and the target marked on the chart
Do not be greedy and adhere to the specified principles. I hope you will be profitable
Note that there is no 100% analysis and it is possible to stop flirting
This is a personal analysis and you should not enter into a transaction without review
If you know this, make a purchase
Be sure to adhere to the principles of capital management and do not invest more than 2% of your capital in each transaction.
High-risk individuals can enter a maximum of 5% of risk capital in this transaction by accepting risk-taking.
This analysis has been analyzed with the classic Elliott topics and neo wave style. Also, the principles of price action have been used.

Ethreum - Medium Term Trading Idea - 18 May 2022KRAKEN:ETHUSD in the past week collapsed to $1'720 and finds support at mid-2021 lows. There is a big probability of over 70% to start some kind of accumulation, but big whales will try to drop it even lower over $1'600 - expecting this scenario in action at the beginning of June.
What is the supported thesis technically for the expected scenario on Ethereum?
- 9 months wedge formation will take a pressure on price action in the next 1-2 months
- The MACD indicator hits low points and soon will start forming some flat
- On Daily TF the downside impulse is still not finished
- Don't over-react the situation is still nothing so scary
If you have any questions related to this trading idea I will be happy to provide you with answers.

this is one of my favorites I always loved it. #lunaremember the previous charts about #luna I've been shared before? here's what I'm going to share the latest idea I'm thinking that would happen, but remember this is just an idea and it doesn't include any #trading #setup so if you are using it, try to use it with your strategy as I always notice.
#stay #safe

ETHEREUM LONGS ACTIVE 📉📉📉Expecting bullish price action on ETH after price takes out the sell side liquidity below the old lows, almost the same move as we seen on the BTC. We also have an rsi bullish divergence suggesting a bullish reversal, we have a lot of bearish imbalances that are opened and price should quickly rise to FILL THEM.
What do you think ? Comment below..

ETHEREUM Bearish Bias! Sell!
Hello,Traders!
ETHEREUM is going up now
But a key resistance level is ahead
And I think that we will see a bearish correction
From the level and a move down
To retest a support level below
Sell!
Like, comment and subscribe to boost your trading!
See other ideas below too!


SUSHI in the ChannelIt is in a descending channel that has reached the midline by reacting to the bottom of the channel. In this important range, with the failure of the specified resistance, we expect the possibility of climbing to the top of the channel. It is suggested by entering this range it is convenient to enter. If it reacts to this range, we have the possibility of falling to the bottom of the canal.
Its not Buy or Sell SIGNAL
DYOR
BY : Mohamad Teriz - @AtonicShark


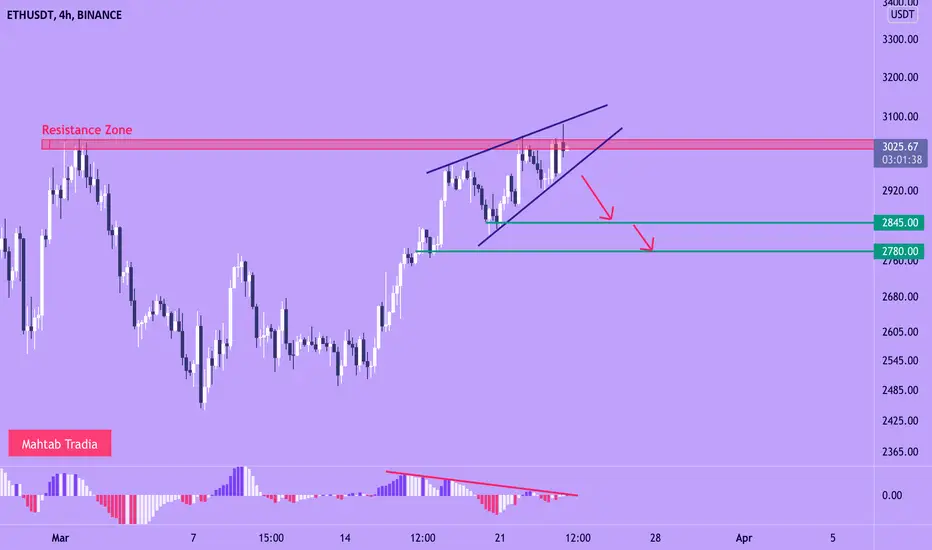
ETHUSDT: Rising WedgeAfter a growth we saw on ETHUSDT, price has reached to the resistance zone.
Currently, price is bouncing in a rising wedge pattern. As you know, rising wedges often tends to breakout to the downside.
Since price is at the resistance barrier and also has made a reversal pattern, we can expect a drop:
If the wedge pattern broken out to the downside and there was a candle closure below the pattern, I expect a drop on ETHUSDT.