US Elections - My thoughtsHi Guys - Do not take this as trading advice, Its only my thoughts on the market and what I see pre-results for the elections.
Remember to follow me if you like the content
Cheers
Election

analysis EUit form an inverted head and shoulders , now looking for retracement which is buys . not promise but could possibly go for a by during the election

FX Update: Final FX thoughts ahead of the US Election Night.Summary: The market seems to be putting on the reflationary trade today ahead of the uncertainties of the US Election as the USD and JPY wilt, while the AUD rushes higher after brushing off the well flagged easing moves from the RBA overnight. Any strong turn-out among Democrats could support an extension of this development, while a contested election scenario would very likely do the opposite.
Today’s FX Trading focus:
Market putting on reflation trade for Blue Wave scenario today
The market seems to be moving in favour of a Blue Wave scenario this morning, with the USD and JPY offered and commodity currencies generally bid, together with risk sentiment. AUD managing to rise back above 0.7100 is particularly impressive and shows how thoroughly the RBA easing overnight was fully priced in.
I generally agree with the consensus that a strong Democratic showing is a boost for the USD bears and especially commodity and EM FX on the prospects for a torrent of further stimulus next year that will not be offset with a big tax overhaul focus in the initial stages (counterproductive for the growth narrative), although the longer term risk of progressive adjustments to the US tax code loom as a spectre. Massive fiscal deficits in a reflationary economy that is hopefully mostly or fully moving beyond the Covid-19 pandemic by spring could mean heady moves in FX between now and next summer, if this view is correct. Such an outcome would favour positioning in upside optionality in AUDUSD call options for 3-6 months with additional spot trades if we see a Blue Wave outcome and the market reaction is supportive.
The wild card for me in the above that has me sitting slightly uncomfortably is the long end of the US yield curve and bets on a steepening there – the speculative market there seems long the 10 years and very short the 30-year T-bond. Is this a Fed yield-curve-control bet on the anticipation of exploding US yields on a Blue Wave outcome, or any outcome eventually? Certainly, the long-term weak US dollar argument is that US inflation will rise far faster than the Fed will make any adjustments to its policy rate under its new “flexible average inflation targeting” regime. And eventually, the Fed could super-charge USD weakness if it does decide to cap yields out to 10 years, for example if it fears that the rising yields are dampening the prospects for further improvements in the labour market. But for now, I’m curious if some kind of reversal of what seems a crowded trade is a risk and whether this has any implications for the US dollar as well.
The scenario market participants don’t want to see
As I have underlined nearly everywhere in my commentary on the US Election, the market fears most that this election will see a contested outcome in which the losing side refuses to concede and as I noted yesterday, the worst of worlds is the Murphy’s Law outcome in which the state of Pennsylvania is the deciding margin in the electoral college.
So despite a clear general lean in favour of a Democratic Blue Wave of sufficient magnitude to at least see the Democrats take marginal control of the Senate in addition to winning the presidency, there are plenty of market participants who are uncertain and who believe otherwise, so two-way risks are prominent on this election outcome. But really, few are well prepared for an ugly, contested election scenario if the vote proves close and the uncertainty drags out for days and weeks. In a contested election scenario, watch for hefty yield curve flattening in the US, a possible USD spike, but a very likely strong JPY spike and then ugly volatility in some of the currencies best positioned for the reflationary narrative, from commodity currencies to EM.
Chart: USDNOK weekly
Here is a currency pair on the major fault-line going into the Election result tonight – the US dollar versus the Norwegian krone. The US dollar outlook is heavily dependent on whether the negative US real rates (inflation running hot and far beyond the policy rate) story pans out next year and beyond in a Blue Wave election outcome (or even if Trump wins, really – but that realization would take far longer. The NOK outlook is reliant on the reflation narrative generally, on the oil market re-discovering its supply vs. demand balancing point, and linked to that on a global- and especially EU outlook improvement beyond the Covid-19 disaster. The pair has twice found resistance just above 9.50 and not far from the 200-day (40-week) moving average – and all USD/commodity currency and USD/EM pairs will be interesting to watch in the days after the election result. A weaker USD world and recovery in oil prices could have the pair trading close to 8.00 or lower by late next year.
John Hardy
Head of FX Strategy
Disclaimer
The Saxo Bank Group entities each provide execution-only service and access to Analysis permitting a person to view and/or use content available on or via the website. This content is not intended to and does not change or expand on the execution-only service. Such access and use are at all times subject to (i) The Terms of Use; (ii) Full Disclaimer; (iii) The Risk Warning; (iv) the Rules of Engagement and (v) Notices applying to Saxo News & Research and/or its content in addition (where relevant) to the terms governing the use of hyperlinks on the website of a member of the Saxo Bank Group by which access to Saxo News & Research is gained. Such content is therefore provided as no more than information. In particular no advice is intended to be provided or to be relied on as provided nor endorsed by any Saxo Bank Group entity; nor is it to be construed as solicitation or an incentive provided to subscribe for or sell or purchase any financial instrument. All trading or investments you make must be pursuant to your own unprompted and informed self-directed decision. As such no Saxo Bank Group entity will have or be liable for any losses that you may sustain as a result of any investment decision made in reliance on information which is available on Saxo News & Research or as a result of the use of the Saxo News & Research. Orders given and trades effected are deemed intended to be given or effected for the account of the customer with the Saxo Bank Group entity operating in the jurisdiction in which the customer resides and/or with whom the customer opened and maintains his/her trading account. Saxo News & Research does not contain (and should not be construed as containing) financial, investment, tax or trading advice or advice of any sort offered, recommended or endorsed by Saxo Bank Group and should not be construed as a record of our trading prices, or as an offer, incentive or solicitation for the subscription, sale or purchase in any financial instrument. To the extent that any content is construed as investment research, you must note and accept that the content was not intended to and has not been prepared in accordance with legal requirements designed to promote the independence of investment research and as such, would be considered as a marketing communication under relevant laws.

AUDUSD - Test of descending triangle resistance resistance 🔽AUDUSD is brokeout above the double bottom neckline resistance as expected from my previous analysis.
The market is testing the descending triangle trendline resistance.
Breakdown below the internal uptrend support could be a bearish signal ⬇️.

Nasdaq ScenarioNasdaq Scenario For Today Or This Week
╳—╳—╳—╳—╳—╳—╳—╳—╳—╳—╳—╳—╳—╳—╳—╳—╳—╳—╳—╳—╳—╳—╳—╳—╳—╳—╳—╳
Nasdaq has been bouncing in a downward channel, but it reached a big support zone.
Right now we see that nasdaq has created a posible double bottom which -if it does play out-
will break the channel and will go up to around ~11530.
╳—╳—╳—╳—╳—╳—╳—╳—╳—╳—╳—╳—╳—╳—╳—╳—╳—╳—╳—╳—╳—╳—╳—╳—╳—╳—╳—╳
We have to keep in mind that this week carries extra risk with the election etc. so this can go either way,
if it doesn't break the channel then just ride it down again.
╳—╳—╳—╳—╳—╳—╳—╳—╳—╳—╳—╳—╳—╳—╳—╳—╳—╳—╳—╳—╳—╳—╳—╳—╳—╳—╳—╳
It is risky to trade this week so only trade the amount you're willing to lose.
Past performance is not an indicator of future results
╳—╳—╳—╳—╳—╳—╳—╳—╳—╳—╳—╳—╳—╳—╳—╳—╳—╳—╳—╳—╳—╳—╳—╳—╳—╳—╳—╳
Let me know your thoughts and questions, give a thumbs up if you like this idea and follow for more.
╳—╳—╳—╳—╳—╳—╳—╳—╳—╳—╳—╳—╳—╳—╳—╳—╳—╳—╳—╳—╳—╳—╳—╳—╳—╳—╳—╳
ScenarioPainter

AUDUSD - Double bottom pattern 🔼AUDUSD is testing the descending triangle support.
The market is printing a double bottom reversal pattern.
RSI is printing a bullish divergence signal.
Breakout above the double bottom neckline resistance could be a bullish signal ⬆️.

XAUUSD PERFECT SHORT POSITION Hi
As you can see in the chart, we are forming a bearish flag and a rising wedge at the same time.
We are close to the election, and this is a precarious position .please consider slippage.
Zoom out and see the bigger picture.
There is also a tiny hidden bearish divergence on RSI.
This has a perfect risk to reward setup.
What am I missing?
----------------------------------------------------------------
What is your opinion? Comment it below.
If you like the idea, please hit the like button and subscribe to the profile to not miss my updates. The information given is never financial advice. Always do your research too.
Goodluck.

Long Market hereGive how everyone is selling out pre market and it's holding up. I bet you it'll rise with ease because of the fact that there's not as many long positions. AKA low risk to MM
I'm longing based on this and also the shifting indicator on 4H short to a bounce

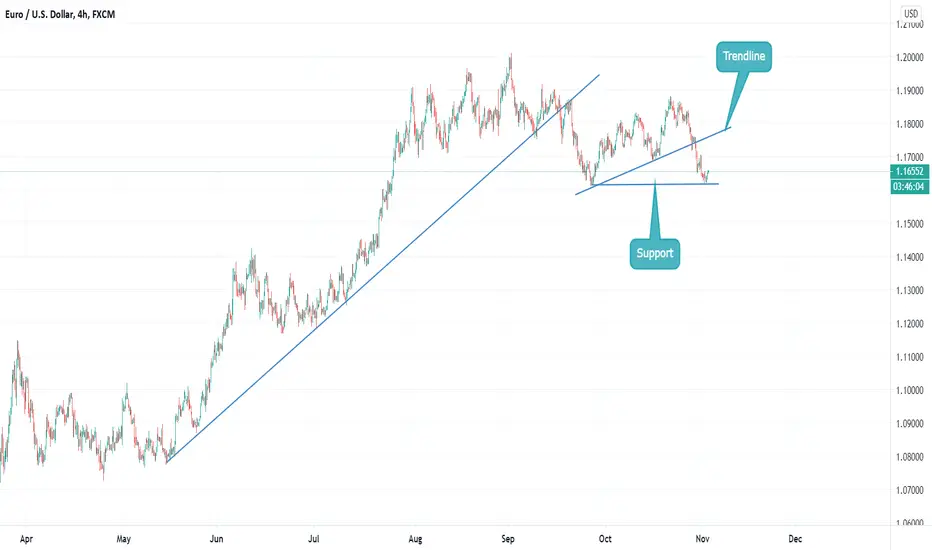
ANALYSIS ON EURUSDHello, my fellow traders hope you all are making some profits. We are here with our new analysis so that we can increase those profits for you. Let’s get into it.
As we can see, the price broke from its trendline and went down till its support. As per our analysis it will retrace.
Let us know your views on this in the comment section. Thank you all.
There is good news for our followers. We will be analyzing on-demand. So, let us know which pair you want our analysis on, and we will get it for you. Do like and follow us.
S&P500 Futures Break Down of Wedge Pattern 15m ChartFutures opened up green but have been inside of a rising wedge. Usually these breakout to the downside, which played out beautifully here.
For now it seems the bulls have lost their momentum but as I was typing these we even started breaking down further. My next target is my marked support. We could get bigger moves now.

SPX T/A for Election Day -> Entry PointsTomorrow will be extremely volatile and I will be following these regions to determine my positions. I will only be focusing on the best setups and will NOT be chasing any trades. Watch closely!

S&P500 Pre Election OutlookUS manufacturing is the highest its been in 2 years.
GDP boomed +33% Q3
Chart is self explanatory. After "covid" price rallied to a new ATH. Now were in the last phase of an ABC correction before we break upwards from the wedge

Four potential downside targetI don't think BTC holds up amidst election volatility. Coupled with its inability to break June 2019 resistance and being overbought on both slow stoch and RSI, it needs to cool off. Some targets below at the confluence of VPOC and trend line, support from October 21 and 22nd, a long term trend line, and the .5 fib retracement to ATH. Stop loss above the .5 short term fib above.

USDCAD Daily Support -- trendline retestTrendline break and re-test. Now firm supporting heading into election.
Keep wide stop loss and smaller position size for next 48 hours while election results pour in.
SL -- 1.3200
TP1 -- 1.3350
TP2 -- 1.3450

Zoom 8h Chart 11/2 Head & Shoulders May Have Bottomed@cptWORLD Gave some great insight on zoom so I went back to review and adjust accordingly at the the end of the day.
The bears failed today which I wasn't expecting until the last green trendline. This made me adjust my buy zone up slightly to 430-455. However, we need to see tomorrow and over the next few days how price reacts to this trend. Right now we are looking good for a bounce back up.
I've switched from short-term bearish to neutral. I'll be watching this closely as more lockdowns and stay-at-home orders are announced.
NASDAQ:ZM

analysis NAS100hello traders , if you have miss the retracement, here potential sell point or retest for you to enter but be mindful that election might effect the market. these are possibilities, thank you for reading !

Impact of elections on BitcoinA small idea highlighting the importance of evaluating signs and using them predictably.
In fact, the market has given good opportunities.
"Every battle is won or lost before it is ever fought."
-Sun Tzu
Note: Elections are also a kind of battle too .
Regards.

EURUSD - Short term retracement EURUSD is brokeout above the current downtrend resistance.
The market is printing the double bottom reversal pattern.
RSI is printing a bullish divergence signal.
Breakout above the double bottom neckline resistance could be a bullish signal ⬆️.

XAUUSD - Potential sell entry 🔽XAUUSD is testing the downtrend resistance + 0.618 fibonacci retracement level.
Breakdown below pullback channel support could be a bearish signal ⬇️.


SP500 DOUBLE BOTTOM: POSSIBLE SHORT TERM HIKE AHEADThe SP500 seems to have completed a classical bullish pattern, the double bottom.
We might have a few sideway days ahead with the elections coming up, but after that I expect the SP500 to rise again. A conservative approach would be to wait for an entry till next week.
After arriving at the area of resistance, consider taking some profits since the SP500 might form a triple top.
In case of new all-time-highs, consider an entry from there on. By that time we would be closer to January/February, with high chances of a COVID cure to be found around that time, giving a major boost to investors' confidence in the economy.

VIX Breakout Wedge Breakout 11/2Hello,
I've been charting the VIX as we have entered an unusual uptrend. I didn't notice this until a deep some deep analysis and found the confluent trendline that has been keeping price down on the VIX.
Well, we broke out of that pattern and are attempting to reestablish bull trendlines.
I'll update this daily until the charted trendlines are no longer in play. CBOE:VIX

Zoom 1hr Chart | Heavily Bearish, No Long Positions AvailableChart Summary:
The bulls did the best they could to hold the main bull trendline on the head of the head and shoulders. After that the bears feasted and heavily and broke through 3 trendlines with relative ease. We are now working on the 4th trendline which I do expect us to break through with similar velocity. If bearish momentum declines significantly, my buy zone could be potentially raised to the last trendline which would be around the 430-475 level, depending on when we are test it.
This was a chart requested and I am not recommending taking any position on this stock. We have a long way to go down before we really start looking at buying opportunities. We have never filled or tested the GAP up from last earnings but it's unclear to me if we will. However I think it's likely we drop down to the redzone with similar velocity we have been having. I do expect a lot of choppiness and depending on what's going on with politics and lockdowns, we could see a lot of bullish velocity from here and recapturing of some bullish trendlines
I'd love feedback on this chart from the community. I love recommendations and discussing possiblities.
