Electricvehicles

Baic Motor is completely undervalued It reached what appears to be a bottom on March 15.
It is almost 80% below its all-time high of January 2018.
The awesome oscillator is on the downside, heralding a possible reversal.
Although last year its profits fell compared to 2019, the trend is still upward, that is, it is becoming more profitable, with 2020 being an exception.
It is one of the largest car manufacturers in China, also having a presence in various parts of South America and Asia, whose models sell quite well.
It is working to develop new technology and introduce more electric vehicles to its fleet.
In general it has good fundamental and future potential, I still think that its price is unjustified.
If you want to have more details about the company, I recommend reading its 2020 annual report.
HKEX:1958
OTC:BMCLF
OTC:BCCMY

TSLA - OTHER TREND LINES - WHERE ARE WE? - OPTIONSAll,
I think worth noting TSLA does have some serious support here or 600-640s and you can see why it's bouncing hard in some spots which are confluence support areas. I am not necessarily 100% bullish on TSLA. Obviously reading articles / tweets you can get the sense TSLA is in a tough spot, but definitely should be higher on ER etc. I think you are seeing the 0.9 Put/Call ratio as a sign of indecision as well.
Currently holding (2:1 Call to Put Ratio) : I may swap out today if it drops further and stay 100% puts and buy calls later after drop finishes. I do want to see how 660s/650s play out here.
Weekly May 7th Calls (just got them super cheap at 678 yesterday still profiting even with Pre Market drop)
Weekly May 14th Put

Lets see what TSLA does at $652We are waiting for a critical juncture for TSLA at $652 on the daily chart.
This short term downtrend will be met by the massive upwards trendline. We are currently below the 50MA and could be reaching for the 200MA. We are still short on TSLA at the moment but hoping for a turnaround.

GOEV Looking like a big winnerGOEV should see positive reaction from the Presidential Summit held on Thursday 4/22. GOEV has recently hit an all time low. We have a buying indicator on RSI. Looking for a break in the downtrend to make big buys. This has potential to easily return 100%

Nio Could Be Attempting a Breakout Before EarningsNio was one of the top stocks in 2020, making even Tesla look like a savings bond. It’s pulled back hard and is now stabilizing with earnings around the corner.
The biggest pattern is the 200-day simple moving average (SMA). Interestingly, TSLA bounced at this exact same line almost exactly one year ago .
Next is the tightening triangle, with a series of lower highs and higher lows. The 21-day exponential moving average (EMA) has marked the top of that range. But NIO’s closed above it for the last two days (something that last happened on February 16).
Finally, notice MACD’s steady upward creep.
Given this company’s powerful uptrend, this setup may interest longer-term growth investors.
TradeStation is a pioneer in the trading industry, providing access to stocks, options, futures and cryptocurrencies. See our Overview for more.

Bullish on NIO for Auto Shanghai 2021NYSE:NIO CAPITALCOM:XPEV NYSE:TM descending triangle with tight bollinger band contraction, anticipating a big move. With a good outlook on Auto Shanghai 2021, currently anticipating price to move to backtested resistance ~$44 upon bullish confirmation.


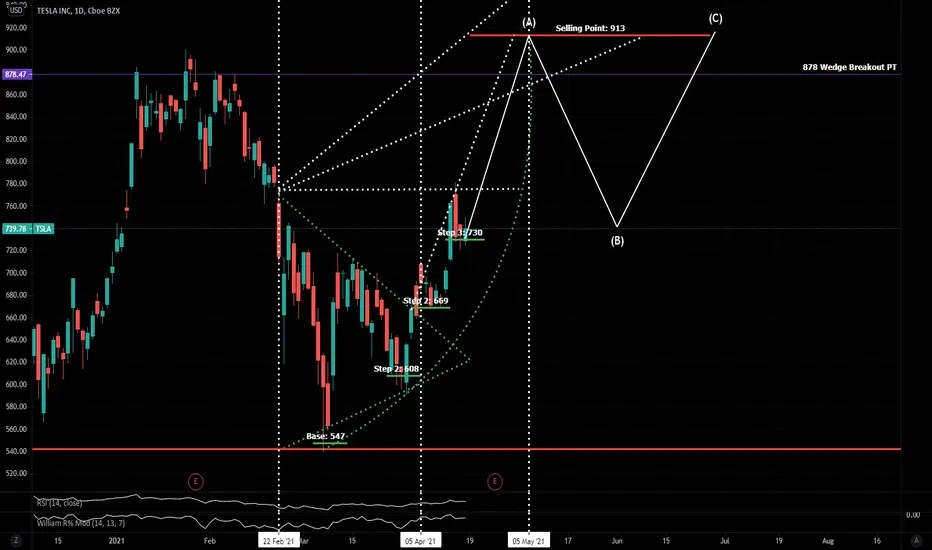
Elliott Wave Analysis: TESLA With Bearish Setup FormationHello traders and investors!
Yesterday we shared $AAPL Apple and today we want to show you another, similar wave structure on $TSLA Tesla.
As you can see, Tesla made an impulsive five-wave drop in February, which actually suggest a reversal from the top into a higher degree correction, as five-wave cycle is barely the first leg A of a three-wave A-B-C corrective movement.
Well, recent recovery looks like a complex w-x-y corrective rally in wave B, which is now trading at key resistance zone here at the channel resistance line around 61,8% - 78,6% Fibonacci retracement.
So, if we are on the right path and if Tesla starts sharply falling back below 700 region, then we should be really aware of much bigger sell-off within wave C that can push the price even down to 500-400 support zone.
Be humble and trade smart!
If you like what we do, then please like and share our idea!
Disclosure: Please be informed that information we provide is NOT a trading recommendation or investment advice. All of our work is for educational purposes only.

Is The EV Hype Dying? Descending triangle - NIO (Daily)Hi everyone,
Quick update on NIO here. After a tremendous rise throughout 2020, NIO caught the eye of many people, me especially I first bought in at $14 but when it inched closer to $50 as soon as three months later, that was a big no no for me. So ever since then it went a bit higher. Fast-forward to today, however, it's back around $35, which makes me wonder...is the EV hype dying? Are valuations going back to normal? The on-going chip set shortage is clearly having massive strains in the industry. And recently, the prospect of higher bond yields, greater interest rates and a comeback of inflation may significantly harm fast-growing companies like NIO. The same would not really apply to Tesla, since it is already a well-established, grown-up company.
Now off to the chart - as you can see on the daily chart for NIO here, you can clearly see a descening triangle with decreasing volume. This is alarming, because something that looked bullish a few weeks ago as a potential double bottom, is now looking pretty bearish. If price breaks anywhere below $35, NIO may see an even lower low later this month. The decreasing volume also confirms the pattern. However, there can also be a bullish approach to this. The price may squeeze, with the decreasing volume, and send the price back upwards towards $40. Nonetheless, there is a lot of uncertainty around this price action, so my guess would be to first assume a bearish case here, but be open to the idea of a price reversal.
Note: Not professional financial advice - please do your own DD.

Xpeng: X Bang! 💣💣💣Although the heading can be slightly misunderstood, we believe it represents the potential of this stock the best. For the Xpeng stock, we do not see a way in which this can explode in the negative sense. Rather, we expect the price to skyrocket so at least $121 – and this is only the beginning. In the first place, the price needs to clearly stabilize above $37.50. After that, there will be a massive bullish run.
It’s not too late to hop on the train!

Crucial Moment for ALYI,ALYI Current Price - $0.07 Price Target - $1 Short Term target $0.10 Long Term Target $1
Options Not available (OTC) - not on RH or Webull.
Crucial moment on the chart for ALYI I think ALYI breaks out of current resistance and sets new highs.
Alternate Systems released amazing news a couple weeks ago. They are set to deliver 2,000 EV bikes to Kenya by July of this year! This is the first order for ALYI that has been scheduled for delivery. They gave us the proof of concept which sent the stock to 10 cents I think it’s a safe assumption that since we have confirmed delivery dates ALYI should surpass that 10 cent level in the short term and run well beyond that in the future. Some more good news is on the way ALYI announced yesterday they have a new contract that will expand their EV ecosystem . This is my largest stock position, many EV stocks are able to run up to a billion dollar + market caps without a proof of concep OTC:ALYI t or scheduled orders. ALYI is sitting at a market cap of 9 million . The capital inflow required to move this stock higher is very minimal. Love this penny stock!

ACCUMULATE NIO SHARES WHILE ITS CHEAP!Possible bullish breakout next week because of the symmetrical triangle pattern which will probably finish at 100% Fibonacci extension level (45-45.5), possibly won't go to 138.2% level (48.23) because of the resistance level of March 13 at 46.28.
There are reasons why its going to have a bullish breakout next week:
1) Strong support at 61.8% Fibonacci retracement level
2) Symmetrical triangle pattern (higher lows, lower highs)
3) Highly correlated with Tesla (95% correlation) and Tesla has bullish ascending triangle pattern now
4) The secondary indicators on 4 hours timeframe are showing that NIO is oversold more than overbought.
And don't forget about Dow Jones theory, on 31 of march NIO broke the downward trend (Recession phase) and now its currently in the Accumulation phase with considerable consolidation of the price. Probably next week we will see the start of another bull rally (Public participation phase) to achieve new peak (Distribution phase), but higher than the last peak of 67 dollars per share...

Bullish level we observe on NIOToday we will continue with a series of posts we started on NIO; Our objective is to define clear filters on the stock and then trade if the price full-field our filters.
First, let's take a look at the big picture:
Here we can see 2 key structures: The ascending trendline and the support zone. Currently, those levels are converging, and the price is exactly there. From a technical perspective, we can conclude that we are in the best zone in terms of probable scenarios to find a reversal movement.
Now, let's take a look at the main image (post image)
We can see that the price made a clear formation (yellow lines) after breaking the descending trendline. The formation has been between those yellow lines for 25 days. On April's one, we saw a first breakout attempt on the structure. We are observing this small white flag pattern on the edge of the yellow one, and we think that the breakout of that pattern may be the trigger for the bullish movement we are expecting.
Final Conclusion: We have an activation level of 41.08, meaning that if the price reaches that level, we will consider that our bullish view is ACTIVE. Our invalidation level is set below the structure and below the massive support zone at 36.49 (that will work as a stop loss level or as a cancelation level for the setup). Our first target is the next resistance zone at 46.00 (there, we will move our stop loss to the entry-level "RISK-FREE"). Our final target is 53.90 (there we will close our full setup) / The risk rewards ratio that this situation offers is 2.75 (that means that if we risk 1USD on this setup, we are aiming to make 2.75USD, If you have a 50% win rate then congratulations, you are profitable)
Thanks for reading!

The second wave is over, the third wave is startingABC shark pattern
AB=0.38 5-A
BC=1.6 AB
C-3=1.6 BC

Blackberry is a shark!four targets possibility with shark harmonic pattern:
AB=0.38 XA
BC=1.6 AB
CD=0.88 XA=$52
or
CD=1.6 BC=$59
or
CD=1.13 XA=$96
or
CD=2.24 BC=$193

Is TSLA Cycling between 600 to 704? With the marketing calming down from last year, TSLA could be going into a range trade opportunity between 704 to 600. Currently I'm watching high levels of 683/695/704 to see if it will break through resistance or bounce back down towards 600.
Moving downwards, I'm watching 683/ 672/ 660.
Be sure to watch volume as you confirm entry points . I'd be also interested in how Biden's infrastructure plan effects the EV market as that news is a bullish variable.

DSGT - Will start selling Electric Vehicles- The KingThis company is starting to market and sell full EV Veh.
Buying Veh stock for 0.40 is cheap - Adventure

JPPOWER CASH CHARTCMP-3.20
TARGET-6/10/15++
STOP LOSS-0
Time Horizon-1-2 Years.
As the stock is a penny idea is only for Risky Players.

TATA CHEM CASH CHARTCMP-809
STOP LOSS- 645
TARGET- 1000/1300/1600.
Time Horizon- 8-10 Months
Add on dips is advisable.

The end of Wave 1 is near. Do not fall into the trap of Wave 2The microwave 5 is starting on wave 1 with the target of 17.5.
Catch right price and time of wave 3.

