TSLA - Technicals, Fundamentals, and Who he knowsGood Morning Traders,
🚗Tesla NASDAQ:TSLA has been on a remarkable upward trajectory, and the outlook remains bullish with continued closures over $376 look for $420 to be tested and $475 next upside.
Let's break down why Tesla can continue to be bullish for reasons outside of Price Action. 📈
Revenue Growth: Tesla continues to report impressive revenue growth 📈, driven by strong sales of electric vehicles and energy products 🚗⚡.
Profitability: The company has turned profitable 💰, with a positive net income and strong cash flow 💵.
Innovation: Tesla remains at the forefront of innovation 🔧🚀 in the EV and energy sectors, with continuous advancements in technology and production efficiency 💡.
Additionally
Carbon Credits and EV Policies
Carbon Credits: Tesla has been capitalizing on selling carbon credits to other automakers who need them to meet regulatory requirements. This has been a significant revenue stream for Tesla.
EV Credits: There are discussions about removing federal EV credits, which could impact the market. Tesla's strategic position and established market presence might make it harder for new entrants to compete without these incentives.
Political Connections
Elon's relationship with President Donald Trump has been beneficial. With Trump's support for electric vehicles and renewable energy, Tesla stands to gain from favorable policies and potential subsidies and knock on effects from yet to be known changes.
🌍Industry Trends
The electric vehicle industry is booming, with increasing demand for sustainable transportation solutions. Polestar's strategic partnerships and continuous advancements in EV technology make it an exciting stock to watch1.
Share thoughts in the comments! ❤️
Electricvehicles

LUCID MOTORS LONG Lucid is going like Tesla sience in 2026 all cars in US must be Electric there is no way that Lucid will fail !!
LUCID 10 DOLLARS BY END OF JANUARY Lucid 100 or 200 by 2026 !!
The Future is Electric !!!

TESLA Every pull-back is a buy opportunity. Is $1000 possible?It was almost 6 months ago (June 26, see chart below) when we made a seemingly unrealistic bullish call on Tesla (TSLA) for the time being, setting $400 as our first Target:
In fact, it was 8 months ago (April 15, see chart below) when we called Tesla's exact bottom, expecting its own 'Meta recovery moment' following lay offs of more than 10% of staff:
Obviously, you can say that you couldn't see that coming. Tesla not only broke above $400 but is about to hit the next psychological level of $500. In order to make better sense of this logarithmic rise and display it in a more effective way to you, we have borrowed some of our Bitcoin analysis tools: the Pi Cycle and the Mayer Multiple Bands.
What you see on this chart, are the Pi Cycle trend-lines 1 (orange) and 2 (green), which have been key Resistance and Support levels respectively during the majority of Tesla's historic run, combined with the MMB SD3 above (red trend-line) and MMB SD3 below (black trend-line), which have historically been the extreme Resistance and Support levels respectively. In the middle of all these is the 1W MA50 (blue trend-line), which during the Parabolic Rally phases (like the one we are currently on), is Tesla's major Support.
All the above are applied on Tesla's key historic pattern: a Channel Up, defined by its middle Fibonacci retracement levels (0.618, 0.5, 0.382) and its extremes, the -0.382 Fib (caught the June 2019 market bottom) and the 1.382 Fib (caught the February 2014, February 2021 and November 2021 market tops).
At the moment the price just broke above Pi Cycle trend-line 1 (orange) and hit the 0.618 Fib. While this is a strong short-term Resistance cluster and may force some investors to take profits, every such pull-back should technically be a buy opportunity from now on, as the market as already started its Parabolic Rally phase.
As you can see both previous Parabolic Rally phases hit the 1.382 Fib extension extreme, trading on the way up considerably above the 1W MA50 and with the Pi Cycle trend-line 1 (orange) as its loose Support.
Even though another test of that extreme would take the stock to incredibly high capitalization levels and cannot be justified without an applicable expansion of their product lines (from electric vehicles to A.I. and robotics), a $700 - $1000 target range by the end of 2025, doesn't seem so unrealistic if those products hit the market with real world applications.
In any case, every break above the Pi Cycle trend-line 1 (orange) has historically started Tesla's largest rallies (exception of course the March 2020 COVID flash crash, which was quickly recovered), so plan your strategy accordingly.
-------------------------------------------------------------------------------
** Please LIKE 👍, FOLLOW ✅, SHARE 🙌 and COMMENT ✍ if you enjoy this idea! Also share your ideas and charts in the comments section below! This is best way to keep it relevant, support us, keep the content here free and allow the idea to reach as many people as possible. **
-------------------------------------------------------------------------------
💸💸💸💸💸💸
👇 👇 👇 👇 👇 👇

Inverse Head and Shoulders on PSNY?Inverse Head and Shoulders on PSNY? 🚀
Is PSNY finally gearing up to move? The stock’s been like a "stablecoin" lately 😂.
Rumors suggest Polestar 3 and 4 sales are over 1,000 vehicles!?! Haha, super bullish!

BYD Co. (BYDDY) AnalysisCompany Overview: BYD Co. (Build Your Dreams), a leader in electric vehicles (EVs) and renewable energy, has firmly established itself as a global powerhouse in the EV market. Known for its vertically integrated model and diverse vehicle lineup, BYD continues to expand its dominance across key regions, solidifying its position as a top competitor in the EV and clean energy sectors.
Key Developments:
Market Leadership: OTC:BYDDY has surpassed Tesla as the world's largest EV seller, delivering 822,094 vehicles in Q3 2023 compared to Tesla's 435,059 deliveries. This achievement highlights BYD's growing global market share and its ability to meet surging demand, even in a highly competitive industry.
Diverse Product Lineup: BYD’s expansive vehicle range—from affordable compact cars to luxury models—appeals to a broad consumer base, reducing its dependence on a single market segment. This diversification strengthens its resilience and positions the company to capture additional market share across income brackets.
International Expansion: BYD is aggressively entering new markets, including Europe, Southeast Asia, and Latin America, tapping into regions with rising EV adoption rates. This international growth strategy provides BYD with new revenue streams, insulating it from potential regional economic fluctuations.
Rising EV Demand: With global EV adoption continuing to accelerate, BYD benefits from a tailwind of policy support for renewable energy and consumer demand for eco-friendly transportation options.
Investment Outlook: Bullish Outlook: We are bullish on BYDDY above the $62.00-$63.00 range, driven by its market leadership, product diversification, and robust international growth strategy.
Upside Potential: Our price target is set at $123.00-$125.00, reflecting the company’s potential to capitalize on its global expansion and strengthen its position as the top EV maker worldwide.
🚗 BYD—Driving the Future of EVs Globally! #ElectricVehicles #BYD #CleanEnergyRevolution

Tesla (TSLA) 28/10/24Everybody familiar with head. shoulders, knees and toes?
Tesla still at a discount...
My thought on Tesla is that we get 290 before we come back down to test 250-260/s...
NASDAQ:TSLA
#TSLA

tesla still has a shot at ATHthis bull market has carried tsla to prices not seen since september 2022. with the size of the bounce and the consolidation in the s&p500 volatility is expected to rise in this name. the trend continuation could happen at any of these market structure levels, an i would remain long the stock on any breakout or bounce from these levels. ive used horizonfal lines to mark out support, resistance and pivot levels that could sway price. is aim as high as ATH or as low as pwVAH.

NIO Trendline Break PossibleGood evening traders,
After NIO's rapid growth Pre-Covid, the company has failed to make a comeback. In my opinion this was due to its rapid growth and impulse move back in 2020. My rule with impulse moves is the market will tend to retrace 100% of its initial move.
Following the fall of NIO for the past several years, it has clearly been bouncing from a descending trendline and so far it has touched 4 times. I expect NIO to continue to drop, the $3.00'ish price seems to be a good price to enter with a possibility of it reach the $1.00 area. I'm expecting a breakout soon followed by a retracement back to the trendline and bounce up until is reaches the $27 dollar area. This is just the technical aspect of this analysis. Hope this helps some of you with your investments.
Don't forget to like and follow for more trading ideas & trading opportunities. Happy Trading!

TSLA: My Trade of the YearTSLA was my trade of the year… filled with frustrations, irritations, and annoyances.
We hit 260-270 three times without pushing higher, and three times I didn’t sell. There was an upward gap to be filled around 289—mission accomplished.
Then, on the 3D chart, there was this huge resistance, the red box, which was finally broken through.
I just sold the remainder of my TSLA shares, accumulated heavily since this spring. Massive accumulation.
These last shares had a PNL of +98%. Simply mind-blowing.

Believing in Polestar: Resilience and Opportunities in the USA Don't forget, Trump is unlikely to target Polestar's business as it works to establish Spaces across the USA. This expansion translates to jobs, taxes, spare parts, maintenance, and more. The South Carolina factory is also expected to reach its full production capacity sooner or later. Stay confident in this project. I understand how tough it can be, especially when you see stocks like NVDA, AMZN, or even TSLA climbing higher with each passing day.
Our hope lies in the fact that if NVDA can gain SGX:40B -$50B in market cap in a single day, or TSLA and AMZN can do the same, then a modest increase for PSNY of $500M, SEED_TVCODER77_ETHBTCDATA:1B , or SEED_TVCODER77_ETHBTCDATA:2B is just pocket change for Wall Street algorithms.
In conclusion? Stay strong PSNY fam'!

TESLA just made a crucial break-out that few are noticing.Tesla (TSLA) soared last week following the better than expected earnings, an event we covered extensively, and have practically erased all the negativity/ cautiousness that came following the Robotaxi event.
However, the closing of last week found Tesla making a crucial bullish break-out that might have gone under most people's radar. The price not only broke the Lower Highs trend-line that started all the way from the November 2021 All Time High (ATH) but almost managed to close the 1W candle above it.
Technically this is a major buy signal long-term that targets the final two Resistance Zones (1 and 2) of the Bear Cycle. With the 1W RSI effectively consolidating like February - May 2023, we believe that as last year, the price will now start the 2nd phase of the April 22 2024 Bullish Leg of a potential 2-year Channel Up.
We expect Resistance Zone 1 to break and if upon a re-test it holds, our long-term Target of $380.00 should finally be materialized.
-------------------------------------------------------------------------------
** Please LIKE 👍, FOLLOW ✅, SHARE 🙌 and COMMENT ✍ if you enjoy this idea! Also share your ideas and charts in the comments section below! This is best way to keep it relevant, support us, keep the content here free and allow the idea to reach as many people as possible. **
-------------------------------------------------------------------------------
💸💸💸💸💸💸
👇 👇 👇 👇 👇 👇

TESLA Have today's upbeat earnings erased the Robotaxi disaster?Tesla (TSLA) reported yesterday third-quarter results that beat Wall Street estimates and said it expects to achieve "slight" growth in deliveries this year. This was enough to send the price in an after-market frenzy and so far in-session rising almost by +20%.
In fact, Tesla's market cap has increased by $126B today, the largest single day jump ever! Those earnings may prove to be pivotal for the automaker as they come just a few days after the Robotaxi event, which the market considered disappointing.
So can those earnings result be enough to reverse Tesla's fortunes, which has been massively underperforming relative to (particularly) the rest of the Magnificent 7? Well this can be answered through a technical perspective, with a chart that we published more than 2 months ago (August 15, see chart below):
That was Tesla's Channel Up since the January 06 2023 market bottom on the 1W time-frame, where we caught a buy just after the August 2024 Low. We projected that to be halfway through the new long-term Bullish Leg of the Channel. The recent October correction can be viewed as the April 24 2023 2nd wave of the mid-term pull-back of the Bullish Leg.
On the current analysis we view the same pattern but on the 1D time-frame, where the 1D MACD in particular excels at illustrating the identical nature of the two Bullish Legs price actions.
Right now the MACD is forming the 2nd clean Bullish Cross under the Lower Highs belt, a formation which on May 04 2023 turned out to be the confirmation that started the 2nd phase of the Bullish Leg that completed a +195% rise from the January 2023 bottom.
As a result, not only do we expect the stock to reach Resistance 1 (299.50), which is the July 19 2023 High before the year ends but also test Resistance 2 (385.00), which is the April 05 2022 High by January 2025.
Our Target long-term remains a straight up $380.00 as we pointed out those months back.
-------------------------------------------------------------------------------
** Please LIKE 👍, FOLLOW ✅, SHARE 🙌 and COMMENT ✍ if you enjoy this idea! Also share your ideas and charts in the comments section below! This is best way to keep it relevant, support us, keep the content here free and allow the idea to reach as many people as possible. **
-------------------------------------------------------------------------------
💸💸💸💸💸💸
👇 👇 👇 👇 👇 👇

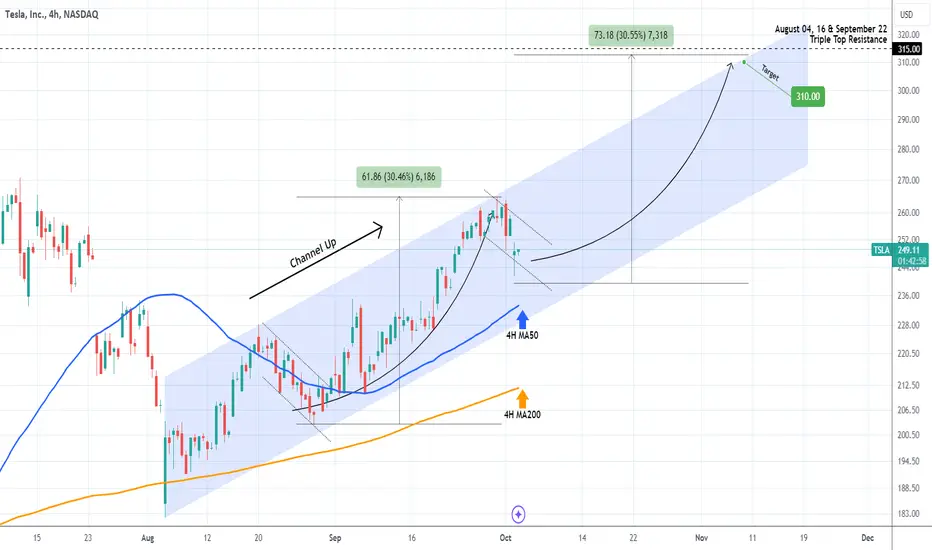
TESLA pulling back on Q3 deliveries. Is there a reason to panic?Tesla (TSLA) opened considerably lower today as they announced Q3 deliveries of 463000 units, below the heightened expectations of around 470,000 from the buy-side and just slightly above the consensus estimate of 462,000. Is this a typical market overreaction on data or the start of a stronger correction ahead of the Robotaxi event next week?
Well from a technical standpoint, our thesis on Tesla is well known and hasn't changed since the August 15 update (see chart below), where we called for a $380 target within the long-term Channel Up:
Even on the more short-term 1D time-frame, we can see that the stock is respecting a Channel Up pattern that started on the August 05 bottom and for the past 30 days has been supported by the 4H MA50 (blue trend-line).
The last correction like the one we're having this week, was from August 20 to 28, which then rallied by +30.50%. As a result, the minimum Target now for November is $310.
-------------------------------------------------------------------------------
** Please LIKE 👍, FOLLOW ✅, SHARE 🙌 and COMMENT ✍ if you enjoy this idea! Also share your ideas and charts in the comments section below! This is best way to keep it relevant, support us, keep the content here free and allow the idea to reach as many people as possible. **
-------------------------------------------------------------------------------
💸💸💸💸💸💸
👇 👇 👇 👇 👇 👇
Here’s what could happen with PSNY if we overlay the chart with Here’s what could happen with PSNY if we overlay the chart with AMD... this is just an archive over time that I’m posting here... just for science and remembrance... LOL.
I’ll post a more serious strategy later...

Tesla - Breakout After Almost 4 Years!Tesla ( NASDAQ:TSLA ) is finally breaking out of the triangle pattern:
Click chart above to see the detailed analysis👆🏻
After a 4 year consolidation, Tesla is finally attempting to break out of the long term bullish triangle pattern. The monthly candle still needs to close but everything is pointing towards a major move higher, with the first target being the previous all time high from 2022.
Levels to watch: $250, $370
Keep your long term vision,
Philip (BasicTrading)

Tesla Trades That Hit The Mark: 75% and 30% Gains Explained!
Two successful Tesla trading ideas, one from April and one from August.
April entry would now be around 75% up, and August entry around 30%.
Both ideas show how technical analysis can accurately time the market and generate returns.
Future resistance levels could indicate potential price consolidation.
This year, I shared two ideas about Tesla:
The first idea in April.
The second idea in early August.
If you bought Tesla stock in April and still hold it, you should be up about 75%. If you entered in August, your position should be up around 30%.
Both ideas played out exactly as predicted, proving once again that technical analysis helps to time the market and put your money to work as quickly as possible. While fundamental analysis tells what should happen, technical analysis shows what actually happens.
April Idea Criteria:
Strong area, confirmed by powerful candles in late 2022 and early 2023.
Mid-round number of $150.
Small liquidity zone around $150.
Smooth descending price movement into the zone I shared.
August Idea Criteria:
Break above $200 with a powerful candle.
Break above a long-term trendline, again with a strong candle.
Price pulled back to the breakout area: 3.1 Retest of $200, now acting as support. 3.2 Trendline retest. 3.3 Historically strong area around $200 – several rejections before.
What’s Next?
If you are still holding, the next target could be around $280–$300. This is the next strong resistance level. As you can see from the chart, this area has multiple rejections in the past. It might be a good idea to take some profits, as the price could get stuck here for a while, and it’s uncertain how and when it will break through.
Summary:
This is a great example of how technical analysis can guide you to better price entries, potentially leading to higher returns in the future. It does take some experience, but these criteria are not hard to spot once you know what to look for. It’s definitely not rocket science to master the basics.
All the best,
Vaido

NIO: After this huge recent pump, I decided to sell my entireAfter this huge recent pump, I decided to sell my entire position in NIO. Good luck to those still holding.
First daily resistance hit... for now...
Many other friends told me they're waiting for $10 to sell...

TESLA broke above the 2-month Resistance and is aiming for $300Last month (August 15, see chart below) we gave a pull-back buy signal on Tesla (TSLA) and the price action swiftly responded with a August 28 Low and then rebound:
The rebound was on the 1D MA200 (orange trend-line) and today we see a strong bullish break-out above the 1D MA50 (blue trend-line). This alone is enough to confirm the start of the next phase of the Bullish Leg, since the long-term pattern is a Channel Up, as closing above 228.00 will constitute a Higher High.
Technically the structure is similar to the previous mid-Bullish Leg consolidation (April 30 - June 24), even the 1D MACD sequences between the two fractals are similar. In that sense we can't rule out some more ranged trading for September but on the long-term our Target remains unchanged.
We expect the $300 level to break before November.
-------------------------------------------------------------------------------
** Please LIKE 👍, FOLLOW ✅, SHARE 🙌 and COMMENT ✍ if you enjoy this idea! Also share your ideas and charts in the comments section below! This is best way to keep it relevant, support us, keep the content here free and allow the idea to reach as many people as possible. **
-------------------------------------------------------------------------------
💸💸💸💸💸💸
👇 👇 👇 👇 👇 👇

Tesla Long - Elon for President?Hello everybody.
Storyline: Elon for President? You can bet that Tesla will pump if Trump wins the elections. Besides of that, rising china sales, unveiling the robotaxi etc. pp. There are many things imo which speaks for Tesla while the masses brag about his political views.
Market: Decreasing rates, good looking economic data for the US at least.
Chart: Keep it simple! Did we create lower low on the weekly? No? Why shouldn't we attack the top 25% of the weekly swing then to confirm that we "really" do wanna go further down. I don't know and it's not in my interest to know if Tesla might even break that prior weekly high, but I do know that we logic wise should attack the top of the swing to either confirm the bearish idea or create even a higher high. Additionally, just as an idea, think of laddering. Look at the higher timeframes how we bounced off major weekly / daily levels and slowly steady climb up.
Best of luck!

RIVIAN giving highly accurate signals within this Channel Down.Rivian Automotive (RIVN) couldn't have been giving us more accurate signals since May (see charts below), as not only did we get a timely entry at the bottom (chart 1, May 17) but also sold at the very top (June 26 chart 2) of the Channel Down:
Right now we face a technical similarity with September 2023, exactly 1 year ago, where the price failed to utilize the 1D MA50 (blue trend-line) as Support and started a new long-term Bearish sequence.
However we do realize the potential long-term trend changing effect that a potential new cycle of interest rate cuts might have in two weeks, so again our trading plan will prepare for both scenarios with clear break-out signals and levels.
Obviously as long as the price remains within the 2-year Channel Down, the trend is bearish and the action will be 'sell on every high'. The Sell Signal on the September 2023 fractal was given when the 1D RSI hit the 60.00 level (red arrow, Sep 14 2023). Naturally we will wait for another such trigger to sell and Target 10.55 on the 0.5 Fibonacci retracement level, which is where last year's sell signal bottomed (October 30 2023).
If on the other hand, the price closes a 1W candle above the 1W MA100 (yellow trend-line), we will buy that clear long-term bullish break-out signal and Target 28.00 (just below Resistance 2). This could emerge as a Channel Up pattern.
-------------------------------------------------------------------------------
** Please LIKE 👍, FOLLOW ✅, SHARE 🙌 and COMMENT ✍ if you enjoy this idea! Also share your ideas and charts in the comments section below! This is best way to keep it relevant, support us, keep the content here free and allow the idea to reach as many people as possible. **
-------------------------------------------------------------------------------
💸💸💸💸💸💸
👇 👇 👇 👇 👇 👇

TESLA starting an aggressive bullish reversal to $380.Since July and the bullish break-out above the ATH Lower Highs trend-line, Tesla (TSLA) confirmed the transition to a new long-term bullish pattern. For the time being, that is a Channel Up.
The recent pull-back is part of the wider market correction of the past 3 weeks but last week's green 1W candle, is evidence that the price has found a bottom. In fact this is a Higher Low on the new Bullish Leg similar to the previous one on the week of April 24 2023.
That was the first Bullish Leg since the 2022 Inflation Crisis bottom and the symmetry is evident even on the 1W MACD, which is showing a squeeze, similar to April - May 2023. As long as this doesn't cross, we expect the market to stabilize in August and start rallying aggressively as early as September.
An earlier break above the 1W MA200 (orange trend-line) again, would confirm that, as it is acting as a long-term Pivot. Since the previous Bullish Leg peaked at +194.87%, we see no reason to expect otherwise, thus keeping our long-term Target on Tesla at $380.00, which would not only be a +194.87% rise but also reach just below the April 05 2022 High.
-------------------------------------------------------------------------------
** Please LIKE 👍, FOLLOW ✅, SHARE 🙌 and COMMENT ✍ if you enjoy this idea! Also share your ideas and charts in the comments section below! This is best way to keep it relevant, support us, keep the content here free and allow the idea to reach as many people as possible. **
-------------------------------------------------------------------------------
💸💸💸💸💸💸
👇 👇 👇 👇 👇 👇

PSNY, it's happening again... 4h resistance... breakout or ... ?Polestar, let's go, come on, you can do it...
break through this resistance

PSNY - Polestar Automotive UK: $1.00 target!Trading at 92.9% below our estimate of its fair value
Revenue is forecast to grow 37.57% per year
Highly volatile share price over the past 3 months
Negative shareholders equity
Has less than 1 year of cash runway
Currently unprofitable and not forecast to become profitable over the next 3 years
