XME - ETF - LongThe Fund seeks to replicate the performance of an index derived from the metals and mining segment of a U.S. total market composite index.
We expect a short term correction that can take prices higher to 57.00. We believe that there is an opportunity to go long at market and add position at 45.00
Elliottwaveanalyis

MSFT: Bears Have Taken Control Over BullsMSFT has accomplished the corrective wave (b) and started falling for wave (c) of wave (4).
Traders can expect the following targets: 289 - 272 - 265 for wave (c).
Here, 273 is the Fibonacci level of 50% of the wave. This level will act as a crucial level.
An uptrend is only possible after the breakout of the parallel channel . As per the wave principle, a new trend can unfold above/below wave B of the previous correction.

$AAPL ObservationJust an observation...
This is an overlay of Apples stock price during the 1998-2000 bull run and subsequent crash resulting in a ~80% loss in value.
I find it striking how similar they are, and how the end result will adhere remarkably well to, Elliott Wave, Wyckoff and Gann theories.
Given the financial status of America, and the current lack luster of Apple's products, it wouldn't surprise me if Apple do see a significant reduction in market cap.

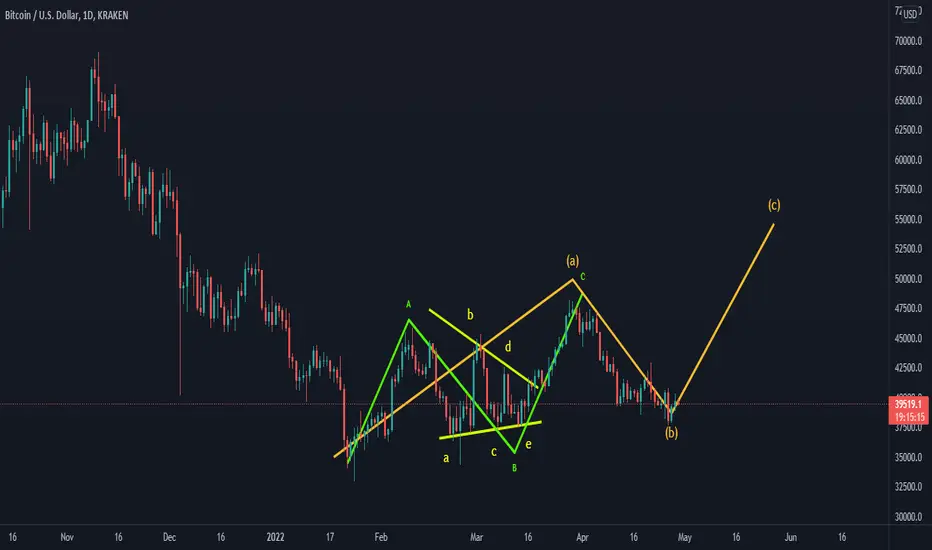
Bitcoin - What if I told you something like this is possible?There is an expanding symmetrical triangle (megaphone pattern) in Elliott Wave Theory. I'm not saying this is definitely happening, but if we see an impulsive reversal after dropping a bit lower, below wave ((a)) support, then it becomes a possibility.
This is the same fourth wave pattern we saw in the Dow where the March 2020 drop was wave E of the triangle. It's always good to know and understand the possibilities.
As I have mentioned numerous times before, it's also possible that wave 5 ended at the ATH. It's also possible that the ATH is only wave 3 and the current three wave pullback is wave 4. This is just one possible pattern that could play out. There are often multiple possibilities when price prints a range.

BTC/USD Triangle in play? variation #2As I've mentioned on my stream, a breakdown below the current wave C low at 32933.33 just invalidates that particular triangle. There is the possibility that another triangle could be printing in that scenario as shown in this chart. Wave C could still be in progress. However, it would need to reverse prior to the wave A support at 28800. Breaking down below that level will invalidate all the triangle scenarios.
This only becomes possible if price breaks down below 32933.33.

DYDXDYDX Technical Analysis basically on elliott waves Principles and Priceaction Strategy
DYDX can be 28$ again and can Grow to 1000$
Wait and watch.

POTENTIAL REVERSAL TO THE UPSIDEAs the week kicked in on Monday and Tuesday with a continuation to the downside from 93.312 to 90.435 levels of which the whole move was again corrected by the market from Wednesday to Thursday from 90.435 to 92.943 with the peak being at 3.515 before the market closed Bearish again on Friday at 91.548.
My view on the pair long-term is that we still have a large potential for the pair to continue it's move to the downside, but short-term I'll be anticipating to see a one more move to the upside finishing the sub-wave C of wave B.
It is after this that I will observe to see if the market will give any reversal signal to go/continue with shorts again.

BTC potential bottom?Is the BTC manipulating at support killing retail traders be over?
Could BTC make a upward move after the diagonal pattern spotted with RSI at oversold territory?
With a potential C wave up?
Do be aware that monthly candle seems like closing bearish.
Disclaimer - This analysis alone DOES NOT warrant a buy or sell trade immediately. Before you enter any trade in the financial market, it is very important that you have a proper trading plan and risk management approach.
Gold to see more RedOn short term basis, expect Gold to see atleast a move below 1891 level at once, with the current Elliott Wave progression being in Wave 4, either complete or continuing.

ElonDogelonmars Technical analysis basically on elliott waves Principles and Priceaction
Elon can be grow up
Wait and watch

AARTIDRUGS ON HIGH! : ELLIOT WAVE FIVE - UPTREND AARTIDRUGS, after giving a breakout from wedge, looking for a breakout for the a,b,c, correction. One may enter after breakout and retest by following strict stoploss.
-Definitely not SEBI - Registered. So, this is only for educational purpose.

GBPJPY Trade Idea - Elliott WaveLet’s discuss the price chart of the GBPJPY currency pair based on the 480 minute timeframe.
From the Elliott Wave perspective, GBPJPY has completed a 5 wave impulse up of two degrees, specifically, Minor Wave 5 and Intermediate Wave (5). The price has recently broken below the bullish channel of Minor Wave 5. Most momentum oscillators are also forming a bearish divergence pattern.
From the Hurst Cycles perspective, the composite model line which measures the combined cyclical pressure, topped on April 18 (red vertical line), and is projected to form a bottom on June 28.
Based on this, we can expect prices to head lower to at least the 38% Fibonacci retracement level of the prior impulse. This will serve as the first area of support, but price should move beyond this level at some point thereafter to test the 50% Fib retracement level.
If you find this analysis useful, make sure to press the “Like” button and Follow us.

USDJPY Trade Idea - Elliott WaveLet’s discuss the price chart of the USDJPY currency pair based on the 480 minute timeframe.
From the Elliott Wave perspective, the price action appears to have completed Wave (5). The parallel channel also confirms this analysis. Additionally, most momentum oscillators are forming a bearish divergence pattern, which is typical at the end of fifth waves. Essentially the upside momentum is waning, and a downward correction is imminent.
From the Hurst Cycles perspective, the composite model line which measures the combined cyclical pressure, topped on April 1 (1st vertical line), and is projected to form a bottom on May 6 (2nd vertical line).
Based on this, we can expect prices to move lower from here. The actual sell confirmation would occur upon the breakout and close below the lower parallel channel. A Fibonacci retracement of 50% of the entire bullish impulse would be a likely support area.
If you find this analysis useful, make sure to press the “Like” button and Follow us.

XAUUSD ABC Correction UpdatePrice is still completing wave (B) of ((ii)). Another climb for wave (C) is anticipated before further decline in wave ((iii)).

GBPAUD Trade Idea - Elliott WaveLet’s discuss the price chart of the GBPAUD currency pair based on the 480 minute timeframe.
From the Elliott Wave perspective, the price has completed the 5 wave impulse sequence down on April 5. From that point, we have been trading higher in a corrective formation which appears to be carving out a W, X, Y pattern.
From the Hurst Cycles perspective, the composite model line which measures the combined cyclical pressure, bottomed on April 3 (green vertical line), and is projected to form a top on June 17.
Based on this, we can expect prices to move higher after the minor X (circle) is complete, which should be within the next few days or so at the latest. The price should continue until it reaches a distance equivalent to that traveled in wave W (circle).
If you find this analysis useful, make sure to press the “Like” button and Follow us.

Luna outLuna or terra Technical analysis basically on elliott waves Principles and Priceaction Strategy
Luna can be down to 40$ and then 126$
Wait and watch.

Vetusdt / harmonic pattern / Elliotte 1-VETUSDT is in a long-term downtrend. We have identified the major points and it includes two downward waves and one upward correction wave, and it seems that the upward correction wave is similar to what has happened in the past. We think this wave should be ABC. To confirm this speculation, a harmonic pattern has also been identified.
2-We expect vetusdt to be able to touch the channel ceiling

Elliott Wave AnalysisAs you can see the wave 2 just got completed, what do you guys think the next move? For me it will go to the moon the market is still bullish but the price action is bearish. Lets wait for confirmation to go long. Always use risk management when trading, do not fomo, do not be greedy and happy Trading everyone

NZDJPY Trade Idea - Elliott WaveLet’s discuss the price chart of the NZDJPY currency pair based on the 480 minute timeframe.
From the Elliott Wave perspective, the price has likely completed Wave (4) with a 23% Fib retracement of the Wave (3). This is a typical retracement level when Wave (3) is extended by more than 161%, which is the case here.
From the Hurst Cycles perspective, the composite model line which measures the combined cyclical pressure, bottomed on March 11 (1st vertical line), and is projected to form a top on April 18 (2nd vertical line).
Based on this, we can expect prices to continue moving higher within the current uptrend. Price should take out the Wave (3) high before the upside momentum begins to subside and a corrective phase begins.
If you find this analysis useful, make sure to press the “Like” button and comment.

EURGBP Trade Idea - Elliott WaveLet’s discuss the price chart of the EURGBP currency pair based on the 480 minute timeframe.
From the Elliott Wave perspective, the price action has recently completed an ending diagonal triangle formation. The price is trading within Wave 3 (circle). The most recent retracement is approaching a 78% Fibonnaci level.
From the Hurst Cycles perspective, the composite model line which measures the combined cyclical pressure, bottomed on April 1 (1st vertical line), and is projected to form a top on April 29 (2nd vertical line).
Based on this, we can expect prices to find support at or near the current level and start trading higher towards the 0.8599 level which is the next major resistance area.
If you find this analysis useful, make sure to press the “Like” button and comment.

THE BIG PUMP IS COMING!As you can see we are coming to WAVE 2 at 42000 - 41000 ( 1Day Timeframe) base on my Elliott wave analysis. Once its completed dont buy long immediately, always wait for a choch "Change of Character" inside of little timeframe ( 5mins to 30mins ).
This is just my analysis, always trade at your own risk.

XRPUSD cryptocurrency this week has attempted corrective growthXRPUSD cryptocurrency this week has attempted corrective growth, Yesterday, a strong impulse could be observed at the XRP. This is due to the fact that the new Biden law put a checkmate in the case with the SEC. I'm expecting XRP to cost more to be part of the new financial system. During the first cycle, we had a strong bullish impulse which was then corrected by a complex WXY structure as indicated on the chart. Wave W was a simple ABC, wave X was also an ABC structure with wave B a triangle, and the Y was an impulse 12345. Around 20th Feb-2022 a new cycle is beginning, we have had the first wave completed and retraced at 78.6% fib level. investors can now buy XRPUSD with a protective stop at 0.600.

Crude Oil - NEoWave Analysis 01NEoWave Analysis of Crude Oil Chart within Monthly timeframe Cash Data (NEoWave Data)
First target: 150 $
Second target: 210 $ (if the price stabilizes in the range of 150 $ to 100 $)
Third target: 250 $ to 300 $ (if the pattern progresses in diametric form)
