Elliottwaveanalyis


When the Stars Are Aligned - Trade the High Probability 5th WaveOverview video on how stocks generally behave and how our Elliottwave Indicator Suite can measure that behaviour to identify high probability 5th Wave Swingtrading opportunities.
$GM General Motors is used in this great example where Paul also discusses managing this 5th wave trade.


DXY 1Day ELLIOTT WAVE PATTERNS
Extension Pattern : By definition an extension occurs in an impulsive wave, where waves 1, 3 or 5 can be
extended, being much longer than the other waves. It is quite common that one of these
waves will extend, which is normally the third wave. The two other waves then tend to
equal each other.
In our pattern definitions we call it an Extension1 if the first wave extends, an Extension3 if
the 3rd wave extends and an Extension5 if the 5th wave extends.


USDJPY the next wave 3Hello guys,
The next target is wave 3, follow me to be updated If this analysis can be useful for you.

ETH to finish correction before taking out ATHIt looking like a triangle in the B wave of this correction.
C Wave to go down to an area of high volume (maybe not the highest one but one before... to be seen).
After completing the correction, expecting a new impulsive wave to pass over the all time high.
There is a short and long opportunity in this idea. I'd go for the long (maybe not as aggressive as shown here, just an idea :) )
This is not financial advice.

Trading The Behaviour with Stocks - ETSY perfect exampleIn this quick video recap we discuss using our ElliottWave Indicator suite when trading the behaviour of stocks after profit taking pullbacks. As they say, when its trending - its trending. You just need a set of tools to measure the behaviour in a simple and consistent way. ETSY is behaving very well this last 12 months and is a great example of trading the 5th wave move of an elliottwave sequence.

UNI/USD Breaks Away To These Major Targets | Moon Inbound? Welcome everyone,
My name is Schyler with NewWave Traders. NWT is a movement in Elliott wave and trading education, a movement in creating independent and profitable traders, and a movement in lifestyle. I've been a full time trader since 2017 in the crypto markets and I help traders create a full time income for themselves without working the full time hours by mastering a proven Elliott Wave trading system that will allow you to trade on your time and live the life you deserve. Hit the follow & like button if you'd like to make it a reality. I've helped hundreds of traders just like you make it a reality for themselves. Looking forward to helping you create your success story and life.
Let's Talk UNI/USD
The group has been long on UNI since 4.06, currently up 26% and looking for overall targets of 5.50 and just shy of $6. These are conservative 1:1 targets for UNI and if its ready to take on a full impulse then this baby can start heading to the moon, with targets as little as 7.28 and $9. DOT is currently in price discovery as well that we caught prior to breakout.
When it comes to catching Runaway crypto's like this that are in price discovery its important to identify the higher time frame trend its currently working on (4hr for UNI and moving into a 1 day) and then jump down two time frames in multiples of 4 to look for buy signals based on your indicators/strategies and then using the invalidations of your higher time frame as your ideal stop loss, but if experienced enough can also keep track of that on the smaller time frame.
Just wanted to share these north targets for UNI and I'll be sharing a DOT chart next as well.
Are you currently in UNI? Leave a comment below with what your entry price was, lets see who got the best entry on this. Mine was 4.06 overall, I'm sure someone can have me beat!
Checkout the links below if you'd like to learn more about me and my team's services/products to helping you create your ideal life through trading.
To Your Success,
NewWave Traders


XLM About To Out Perform XRP!?! (Here's How)Welcome everyone,
My name is Schyler with NewWave Traders. NWT is a movement in Elliott wave and trading education, a movement in creating independent and profitable traders, and a movement in lifestyle. I've been a full time trader since 2017 in the crypto markets and I help traders create a full time income for themselves without working the full time hours by mastering a proven Elliott Wave trading system that will allow you to trade on your time and live the life you deserve. Hit the follow & like button if you'd like to make it a reality. I've helped hundreds of traders just like you make it a reality for themselves. Looking forward to helping you create your success story and life.
Let's Talk About XLM /USD...
XLM is providing a great example that many Elliott traders take a long time to understand and that is how wave structures can mold into other counts and how to be able to determine which count is most probable and how to setup a trade on it.
Notice that in the short term the size of the wave structures lead perfectly to a 1:1 extension that prints the red ABC as the most likely scenario. In the short term all 3 counts have a high probability of moving together to at least hit that target of .27 cents. We just got a perfect test of .145 at the .382 fib retracement for a 4th wave. Looking good. What happens thereafter is what I call the Y (turning point). Due to the amount of other trade styles that take part in the market we will determine at this price point whether there is more buy interest or sell interest.
This offers us the opportunity to wait for the market to tell us what it wants to do and because of the Fibonacci relationships we can relate to each wave structure we can have high probability invalidation levels that warn us of a market structure break or the likelihood of one count performing over another. For example, the blue count needs to get squeezed up with a 5th wave that is of equal length to wave 1. If price fails to do this and pulls back too deeply then we invalidate the count and look for the green count to offer the next support and opportunity for the bulls to take us higher. We only want the green count to pull back to previous wave 1 support or the .382 fib retracement, so if it goes deeper than that then we have a high probability that the red ABC was the appropriate count and we're connecting to the downside.
DOES XLM Have More Potential Than XRP?
XLM can outperform XRP if it prints a 1,2,1,2 count which would follow closer to the Green wave structure identified in this chart. So it's definitely possible, but the key thing to take away in my opinion is the crucial reaction we are soon to see at .27 cents for XLM .
I hope you enjoyed this analysis and if you'd like to stay up to date and get notifications of how this count unfolds and what we can learn from it then make sure to follow me on tradingview here and I'll keep you all posted. in the meantime check out my other assets and counts I'm following such as the ADA count below that has some upside potential as well. Want a hedge short? check out the LINK count.

Have You Seen The Potential Of OMG/USD?Welcome everyone,
My name is Schyler with NewWave Traders. NWT is a movement in Elliott wave and trading education, a movement in creating independent and profitable traders, and a movement in lifestyle. I've been a full time trader since 2017 in the crypto markets and I help traders create a full time income for themselves without working the full time hours by mastering a proven Elliott Wave trading system that will allow you to trade on your time and live the life you deserve. Hit the follow & like button if you'd like to make it a reality. I've helped hundreds of traders just like you make it a reality for themselves. Looking forward to helping you create your success story and life.
Let's Talk OMG/USD...
Both counts I'm following for OMG are corrective counts that have further downside. The difference between the 2 counts however is the short term move towards 5$ prior to dropping. So far the B wave to 5$ is shallow for a B wave and hasn't even hit the .618 so this is likely the count I'm biased towards as it is the most probable given these acknowledgements.
I'm targeting the 1:1 extension because it lines up nicely with the previous support level and is a highly probable extension to get hit, so there will def. be buy interest there, however from a Fibonacci standpoint we only need to hit the .618 ext in purple. Tagging the 2.46 low for a double bottom.
That leads me to my next point, I don't think the 1:1 will get tagged if the bulls defend the low of 2.46. If we break under the 2.46 with a 4hr close then It's highly likely we continue to the 1:1 ext.
In summary, Longs above 2.46 seem like the strongest options for trade setups, however I'd like to see the reaction at 2.46 first and then happy to step into the trade as the upside has a great R:r.
Follow, Like, Share to support the channel growth.
Comment your thoughts below. Don't be shy!

BTCUSD is unstoppableThis is my bullish EW count for BTCUSD. I tried to count carefully all subwaves and drew only the major ones on this chart. I took into acount also RSI and MACD on multiple time frames. I see it that BTCUSD could now be still in wave 3, where subwave 5 is now in the making. If BTC breaks the 20K resistance, I think it could hit somewhere around 24k and then a bigger correction will come (wave 4).

Recorded Live Showing Elliottwave Count being Re-Painted LiveQuick video to show how our Elliottwave indicator suite calculates and prints the elliottwave count, the probability pullback zones and the automated 5th wave target zone.

ADA/USD Looking Like A Nice Trade.. Check It Out!Welcome everyone,
My name is Schyler with NewWave Traders. NWT is a movement in Elliott wave and trading education, a movement in creating independent and profitable traders, and a movement in lifestyle. I've been a full time trader since 2017 in the crypto markets and I help traders create a full time income for themselves without working the full time hours by mastering a proven Elliott Wave trading system that will allow you to trade on your time and live the life you deserve. Hit the follow & like button if you'd like to make it a reality. I've helped hundreds of traders just like you make it a reality for themselves. Looking forward to helping you create your success story and life. It's 100% Possible.
Let's Talk ADA/USD
The daily RSI right now has reset extremely nice creating a hidden bullish divergence in a supposed 4th wave that offers a nice buy. If we don't see a break upward and follow through and start to see signs of failure instead then it's a key note to dip out, however this is what I like to see to place my bets. I think ADA has another leg up to do.
It's important to prepare for either scenario though, what to look for if it starts to fail and what the south targets are.
Notice the 2 white counts that basically offer pullbacks and further continuation upward. It's the purple count that will obliterate everyone if not prepared. So I want to make sure the bulls defend all previous daily lows and keep the higher lows in tact even on this pullback if it decides to retrace further.
Wave 4 can't go into wave 1 so that's our invalidation mark for the white impulse wave and I'd be looking to the purple count as a likely scenario if we break the .08 cent low. Signals printing a buy now in my opinion with a stop loss down at .113. As always, not financial advice, but this is how I'm looking at ADA/USD through an Elliott Wave lense.

Nasdaq Composite and EWT It's a daily chart of NASDAQ, and it has made an Elliott wave pattern. The 4th wave has been completed. And the fifth wave is remaining.
The fifth is in the making process. As per the rules of Elliott wave theory, the fifth wave will hit the 0.618 level, which I have found by using Fibonacci of 1+3. Hence, it will march for the following level 12700 - 12800 .
Nasdaq Composite may collapse (up to support trendline) for the following levels before turning up.
Downside levels: 11860 - 11600

Bitcoin is yet to reach a top, here’s whyHello Traders! Welcome to today’s analysis on bitcoin, I hope you’re doing good
From our last analysis on bitcoin, we tried to forecast a downtrend which didn’t quite play out because our wave c fib ratio exceeded 1.236 ideal extension for a wave c, which gave us more insight that what we called a wave c earlier is an extended wave 3, that was why I updated the idea with a note “trade closed manually” few hours later
So, where are we now?
Wave 3 gave an extension beyond 2.618 fib extension level which is the usual for btc, and that leads to a truncated 5th most times.
We saw a massive rejection very close to 20k region down to lower 18k, in wave 4, and the current structure may lead to a truncated 5th. Usually with truncated 5th, we have a long-term consolidation in wave 4 forming ABC corrective structure. Having a closer look at smaller timeframe, wave 4 seems to be forming a flat correction.
What is a flat correction?
Flat correction is one of the simplest corrective structures with 3 wave structure labelled ABC. The difference between a flat and zig zag correction is the amount of sub waves. While flat correction gives a smaller 11 sub-waves, zig zag gives 13 smaller sub-waves. The usual convention for a flat correction is 3-3-5 ABC waves
In this case, we had 3 waves complex correction in a, and waiting for the 3rd sub-waves in b to be completed before the final push downward in form of a wave c. The ending point of the last sub-wave in b will determine what kind of flat we get, if we close around the last high close to 20k, we’d call it a regular flat. If we close above 20k, then we’d call it an extended flat.
We can expect some rejection around 20k or slightly higher to complete wave c of the flat correction. If otherwise, I’ll post an update on that.
Conclusion: usually truncated 5th comes with a lot of scalping opportunities because of quick swings back and forth, just don’t get caught in the middle. We won’t be holding our positions for long we’ll be scalping the waves along.
If you’re don’t like scalping and you got an entry in mid 18k you can leave it open till we break above 20k. I’m forecasting mid 20k as the ending point for the truncated 5th, let’s see how things play out.
This is a very detailed analysis which could play out throughout the week or maybe more, I hope you get the idea.
I’ll stop here for now and update you more as the structure unfolds.
Trade setup: we entered a long trade below 18k, and we’ll exit the trade around 20k region before the next swing down.
If you enjoyed this analysis, don’t forget to hit the like button, subscribe to this channel to get latest updates and signals on bitcoin.
Don’t forget to share your charts, questions and contributions with the community in the comment section below.
Donations via Trading View coins also helps me at posting more free trading content and signals here.
Thanks for your continued support as always
Trade Responsibly.
I’ll see you all shortly
Have a great week traders!
Thank you
Nueel_classic

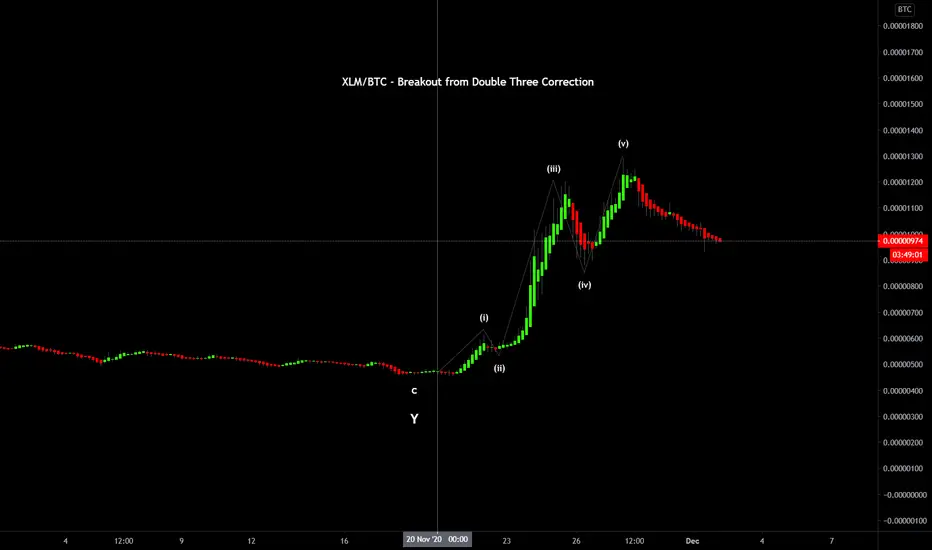
XLM/BTC - Breakout from Double Three Correction
An update on XLM/BTC. It looks like a clear breakout from the Double Three structure with price breaking out from the zigzag into an initial five wave impulse of a smaller degree. Let's see how it plays out for confirmation.
Please refer to the previous idea I have linked below and follow for further updates.
Trade safe,
Beyond Edge
Disclaimer
This is not trading advice. All content/ information shared in this idea is purely educational in nature and is expected to be used for analysis and illustration purposes only.
Do not trade or speculate based solely on the information provided. Trust your own analysis.
Beyond Edge
Bitcoin Weekly UpdateHello Traders, welcome to this week’s analysis on bitcoin. I hope you are all doing great
From our last analysis, we expected some retracements for wave W, which we got and I labelled wave X, having a closer look on the smaller timeframe, the corrective structure looks like a zig zag, with 5 waves down in W and 3 waves up in X, in theory we should label WXY as ABC, but I kept it as WXY to remove a bit of speculation in case there’s a change in trend.
Zigzag is the easiest type of correction to trade. Very similar with the motive phase with a 5,3,5 ABC structure. It’s a very common pattern to see in waves 2, 4 and B with 2 major rules:
Wave B(X in this case) must end below the starting point of wave A(which I labelled W)
Wave C(which I call Y) must break below the ending point of of wave A(which I called W).
So, what do we expect from here?
We expect btc to make a continuation to the downside to complete the corrective structure. The 16k region is a crucial point to watch. If it breaks, that will make more room for downward movement and 14k could easily come in place.
Trade setup: taking a short position from mid 18k and riding the wave down, target profit will be between 16k to 14k region. I’ll be updating the post as we move.
If you enjoyed this analysis, don’t forget to hit the like button, share, subscribe and stay tuned to this channel for more free updates.
Don’t forget to share your questions, ideas and chart with the community in the comment section below.
Donations via TradingView coins also helps me at posting more free trading content and signals here.
Thanks for your continued support as always.
Ride the wave and stay profitable
Have a wonderful week.
I’ll see you all shortly
Thank you
Namaste! Traders.
Nueel_classic.
