Gold Wave Analysis buy Set UpI am looking for a Bullish impulsive wave causing price to retest resistance around 1478
Elliottwavecorrection

S&P500: to impulse or to not impulse that is the question!Two weeks ago I shared my view on the TVC:SPX in that it was either following a standard impulse patterns higher or it was following an ending diagonal pattern. I mentioned back then " The first sees (grey) minute-iii complete soon then wave-iv (orange target zone) and then wave-v to complete (green) minor-3 ." Ideally I would have liked to see wave-iv reach TVC:SPX 3075-3040, but all we got was 3091 though this pullback materialized indeed "soon" as the low was in three days after my update was posted... So, the pullback was right on cue, but shallower then anticipated. It happens, as it's impossible to get it right all the time, and note the TVC:SPX is now already trading at the same level as two weeks ago: 3115... In addition, because the pullback was so shallow the subsequent rally fell also short as an ~100p rally would have been ideal but "all we got" was ~65p. This is common, as it means too many buyers jumped in at these higher levels, causing buyers exhaustion (i.e. when everybody has bought/is long, all that's left to do is to sell/go short).
So, although the jury is still out there on which of the two larger patterns is evolving, we now know the market did five waves (grey, minute-i,ii,iii,iv,v) up off the October 3 TVC:SPX 2855.94 low, completing (green) minor-3/c. The 3 is for the impulse, the c label is for the diagonal. So the Bulls want to see the green "alt: 4" complete at ideally TVC:SPX 3042: the 100% retrace as in a standard impulse pattern wave-3 often reaches the 161.80% Fib-extension of wave-1, measured from wave-2, and then wave-4 should drop down to the 100% Fib-extension before wave-5 does (ideally) a nice 5=1 extension to the 200% Fib-extension. The latter is in this case at TVC:SPX 3229. So, last night the Futures market reached TVC:SPX 3158, which is exactly the 1.618x extension and started today's decline. A BINGO for the standard impulse pattern so far. This patterns is exemplified by the orange arrows. Ultimately, price will need to move and close below last week's low at TVC:SPX 3091, to confirm wave-3/c has completed, but the daily charts look weak, market breadth is negative, and sentiment readings have been frothy for weeks, so all suggest this should be accomplished over the next few days.
The alternate is that we thus only saw three (green) minor waves up and that completed (red) intermediate wave-c of the diagonal, and wave-d is now underway. Note, I label the diagonal in letters to distinguish it from the impulse. Price will have to move and close below TVC:SPX 3040 and especially below 3022 to tell us the diagonal pattern is in play. Thus there's still some ways to go... If that happens, then the current decline will be labeled as red wave-d and it should drop to ideally TVC:SPX 3005+/-15. Now that still means there will be at a minimum a wave-e to complete (black) major wave-3 at around TVC:SPX 3200, followed by another wave-4 and 5 (grey arrows).
Thus, the current decline is one way or another still a great buying opportunity, and we'll just have to monitor the price action carefully to better determine when and where this musical dance of chairs ends.
Trade Safe!

lmt Cant decide what wave we r in - is it an impulsive wave 1 or still in the frame of correction with wave Y?

Gold Wave Analysis Potential Sell Set Up Wave YGold have been in a corrective structure since September of this year moving lower. I believe we are in a complex corrective structure and we are going to get another push lower in wave Y of the complex structure

USDJPY PREPARE FOR HOLD LONGBUY NOW
TARGET: 109.500
And then prepare for bearish market after break out of 109.000 zone - the ending of leading diagonal wave 1
Prepare for hold Long for 3rd wave.
This is my plan. If you have another please comment. Thank you.
I live in Saigon, Vietnam.
Contact for work:
N.Fone: +84 8888 2468 1
Email 1: leminhphucthinh@gmail.com
Email 2: louis.interbank@gmail.com

EUR/USD Wave Analysis Buy Set UpI am looking for a buy set up, I believe we are in a impulsive wave with a completed 3 wave corrective flat structure.

Oil Wave Analysis Potential Sell Set UpI believe Oil is finish a "W-X-Y" corrective structure. It appear that wave Y could be completing a ending diagonal. I am looking for a reveral in price and a swift move to the downside
Gold Wave Analysis 3 Potential Trade Set UpsGold is setting up for some really good trading set ups. Depending on what type of trader you are, Trend following or counter trend, will determine which set up is suitable for your trading plan. The arrows give somewhat of a map of the movement that I am expecting to take place.


GBP/NZDI am looking at the choppy sideways movement in GBP/NZD as a corrective Triangle structure. This week I will be looking for price to break out impulsively pushing higher

Gold Wave Analysis Potential Trade Set UpWatch as I forecast Gold and identify potential trade set ups

US Dollar Wave Analysis Potential Trade Set upsWatch as I forecast potential trade set ups on the US Dollar


3 in 1 GBP JPY AnalysisHello everybody;
I'm not going to talk much. Justa follow the arrows ;)
Just tell me if u like it, follow and dont forget to use your like buttons :)

Harmonic Elliott Wave Analysis GBPJPYLooks Like we are at the final stages of wave 5 which will be the end of a bigger uptrend wave A and we should begin the correction (wave B ) on the downside.

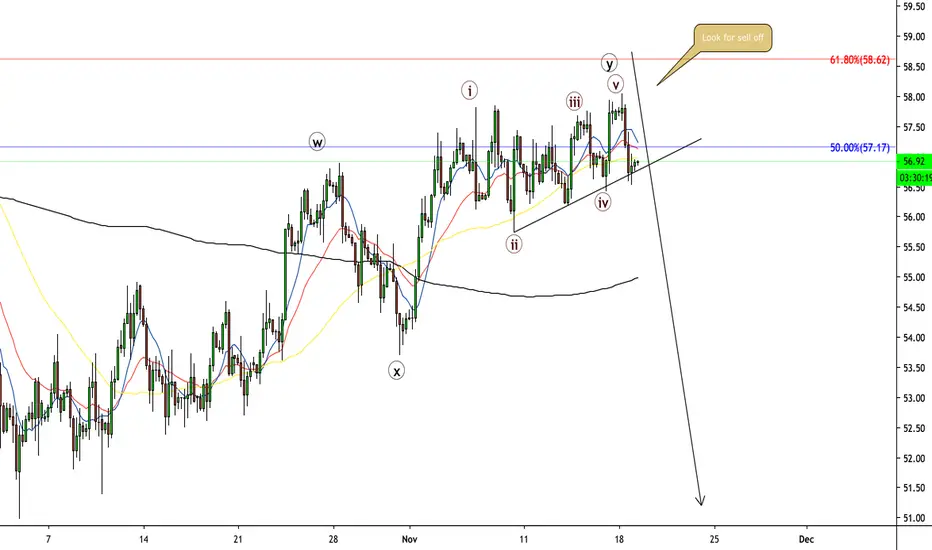
Elliott Wave View: BAC Starts the Next Leg HigherBank of America (ticker: BAC) shows an Elliott Wave bullish sequence from August 15, 2019 low, favoring further upside. The decline to 27.19 ended wave (2) and the stock has resumed higher in wave (3). The internal of wave (3) is unfolding as a 5 waves impulse Elliott Wave structure where wave 1 of (3) is expected to complete soon.
Up from 27.19 low, wave ((i)) ended at 28.62, wave ((ii)) ended at 27.46, and wave ((iii)) ended at 30.72. Expect the stock to pullback in wave ((iv)) and turns higher 1 more time in wave ((v)). The 5 waves move higher should end wave 1 of (3). The stock should then pullback in wave 2 to correct cycle from October 3 low (27.19) before the rally resumes again.
We don’t like selling the proposed pullback as it’s against the direction of right side tag. As far as pivot at 27.19 low stays intact, expect dips to find support in the sequence of 3, 7, or 11 swing for further upside. Potential target to the upside is 100% Fibonacci extension from August 15, 2019 low towards $31.2 – $32.2.

Elliott Wave View: Bullish Sequence in DAXDAX shows Elliott Wave bullish sequence from August 15, 2019 low (11266.48) favoring more upside. The rally from 11266.48 to 12497.28 ended wave (1) as a 5 waves impulse Elliott Wave structure. On the chart below, we can see wave 3 of (1) ended at 12471.83, wave 4 of (1) ended at 12141.82, and wave 5 of (1) ended at 12497.28. Index then pullback in wave (2) and ended the correction at 11877.32.
Index has resumed higher and broken above wave (1) at 12497.28, signalling the next move higher has started. Up from 11877.32, wave ((i)) ended at 12097.43 and wave ((ii)) ended at 11933.02. Expect Index to see a few more highs before ending wave 1 of (3) a 5 waves from 11877.32. Index should then pullback in wave 2 to correct cycle from October 4 low (11877.32) in 3, 7, or 11 swing before the rally resumes. We don't like selling the Index.

ORBEX: AUDJPY - End of Correction Nearing, Then Down!
It looks like the corrective intermediate wave is going to end soon. The recent attempt to push prices higher is most likely going to end with a minor C or Minor Y.
-Minor C:
a) The correction takes an A,B,C formation. That would see wave A undone as minute wave 5 is not yet completed and could take C anywhere between 75 and 78.45
b) The correction takes an A,B,C formation. That would see wave A ended at 71.80 and C at 74.50 high. This would allow the current upside wave to be a corrective one too!
-Minor Y:
a) The correction takes a W,X,Y formation. That would see wave W ended at 74.50 high and wave Y to complete anywhere between 74.88 and 78.45
b) The correction takes a W,X,Y formation. That would see Wave Wended at 74.50 high and Wave Y to form a more complex pattern (likey a flat) but still trade within the limits of a)
The current upside is part of the bearish intermediate wave, which could have prices sliding down to 61 long-term, 70 in the medium-term.
This opportunity would be invalidated above 78.50
Stavros Tousios
Head of Investment Research
Orbex
This analysis is provided as general market commentary and does not constitute investment advice

Elliott Wave View: Further Downside in NetflixShort term Elliott Wave view suggests the rally to $299.5 in Netflix ($NFLX) ended wave 2. From there, the stock resumed lower and ended wave 3 at $252.03. Internal of wave 3 unfolded as a 5 waves impulse Elliott Wave structure. Down from $299.5, wave ((i)) ended at $287.45 and wave ((ii)) bounce ended at $293.81. The stock extends lower and ended wave ((iii)) at $261.89, wave ((iv)) bounce ended at $266.60, and wave ((v)) of 3 ended at $252.03.
Wave 4 bounce i still in progress. Near term, while bounce stays below 299.54 expect Netflix to extend lower. We don’t like buying the stock.

Bitcoin Correction Ahead Before Big Bullish WaveBitcoin have formed 5 waves up which signal that we have started a new direction in trend which is a bullish one. However I do expect a big correction to the downside to form a wave 2 before the big bullish wave continue. We are approaching a very strong supply/resistance area on the chart between $11,500-$13,500. Once the bearish correction start I can see it going all the way down to $5.800-$8,500 to complete a wave 2. After the completion of wave 2 I will look for Bitcoin to head higher to create new highs above $20,000

NDX: no impulse up off August low. Expect lower pricesThe NASDAQ100 (NDX) broke below its August 22 high and therewith invalidated its potential to do five (i, ii, iii, iv, v) waves up off the August lows. Instead it became only three: corrective. Namely, when a new move starts, even if it is five waves up or down, we can never know beforehand with all certainty if that move is an impulse (wave-1 of a 1,2,3,4,5 move) or part of a larger correction (wave-A of an ABC move). See my tweet here for example. Hence, why we must label such initial advance as wave-1/a, the retrace as wave-2/b, and the subsequent advance as wave-3/c, until one (1,2,3) or the other (a,b,c) is disproved by the markets. In this case the impulse was disproved as price overlapped with wave-i/a meaning the current decline can not be a wave-iv and so there will be no wave-v and thus thus the entire rally was a wave-a,b,c UP. Simple! In addition the wave-iii/c was only seven waves up, which means it is corrective as impulses travel in 5,9,13, etc waves. Another line of evidence pointing towards the recent rally having been corrective and not impulsive.
Now that we have proper, intellectually honest Elliott wave labeling out of the way, lets look at the bigger picture options. Price can do a nice c-wave down into the orange target zone based on the standard c=a to c=1.618x a Fibonacci extensions and as long as it doesn't move below the June low it can still be a larger wave-ii of an even larger 3rd wave. IF it breaks below the June low, and especially in a five waves down move, then we have a lower low on our hands. In addition price can then not be in a (red) wave-ii anymore because 2nd waves can't go below the start of the prior same degree 1st wave, and we are then looking for a much, much larger ongoing correction, which I would label as major wave-c of Primary-IV, well into 2020.
Trade safe!

ORBEX AUDUSD: Correction to Wave (4) Could Validate Bears!I am not certain whether the current structure on the AUDUSD structure is corrective or not. Fibo levels suggest it is, but this could be easily invalidated.
It is a minor 5 down to 0.6676 and either a a) reversal, where an impulse 5-wave move is going to take place, or a b) correction that is going to complete intermediate wave 4 and head lower near 0.66 -(100% FE of intermediate wave 1, or else, duplication of intermediate wave 1).
Since we have not received an invalidation at the 0.7000, or a sign of a stronger bullish bias as of yet by breaking outside the descending channel, I analyse scenario b).
In case prices stop by the descending trendline resistance or at 70c. and reverse down, the chances of reaching 66c would increase. The validation would be supported after a successful breakout below the previous low at 0.6676.
Should bears take over once again we could head minimum down to 0.6800 nevertheless.
Stavros Tousios
Head of Investment Research
Orbex
This analysis is provided as general market commentary and does not constitute investment advice.

Elliott Wave View: Oil Outlook After Refinery AttackOil gapped up almost 20% early this week after the news that Saudi Arabia’s oil refineries got attacked by drones. It has since retraced after Saudi Arabia said they can restore most of the lost output within days. In the chart below, we label the rally to 63.39 as ending wave C of (X). It’s therefore part of an expanded Flat structure which started from June 5 low. The internal of wave C unfolded as a 5 waves impulse as an Expanded Flat is a 3-3-5 structure.
Wave ((i)) of C ended at 58.76 as a diagonal, and pullback to 54 ended wave ((ii)) of C. It then gapped up higher to 63.34 and ended wave ((iii)) of C after the news. Wave ((iv)) of C pullback ended at 58.77 and wave ((v)) of C ended at 63.38. This rally also completed wave (X) in larger degree. Oil is now currently bouncing in wave ((ii)) to correct the decline from 63.43. Afterwards, as far as pivot at 63.43 high stays intact, it should extend lower at least 1 more leg lower.
