BTCUSD - still in a corrective cycle, more downside aheadLet's now take a look at Bitcoin technical picture at the H4 time frame. The market has bounced from the level of $6,024 after two Pin Bars candles were made. The rise is corrective in nature and it does not look as the bulls have too much strength to break through the weekly pivot at the level of $6,379. The price is now in a short-term horizontal consolidation and the long-term downtrend is still present. It is worth to keep an eye on all technical support levels at $5,971 (weekly pivot support), $5,900 and the most important at $5,742. Any violation of the last support will confirm the downtrend.
Elliottwavecorrection

Shorting idea for NIFTY (NSEI.NS)NSE:NIFTY
NIFTY (NSEI.NS) NSE:NIFTY completing wave B of A-B-C flat correction started at 11171.
WaveB estimated to end arond 11045.
WaveC estimated to end around 9951.
Good short, good risk reward ratio.
Disclaimer - the above text is only for educational purpose. You indemnifty me of any consequences you face by taking actions you take based on above.

usd/cad.. bulls are back in town
Looks like the correction is over and we’re making an 12345 impulsive move up
Looking to short the 3->4 and then long 4->5

Facebook Elliott Wave Analysis: Pullback Remains In ProgressHello Traders,
In this Elliott Wave Analysis, we will have a look at Facebook in the 1-hour chart.
Short-term Elliott wave analysis suggests that the rally to $203.55 ended in black wave ((1)). Down from there, the pullback in black wave ((2)) remains in progress in 3, 7 or 11 swings to correct cycle from 3/26/2018 low. The internals of that pullback shows an overlapping structure thus suggesting that the correction takes the form of corrective structure i.e either (W),(X),(Y) or (W),(X),(Y),(X),(Z) structure.
Below from $203.55 high, the pullback is proposed to be unfolding as Elliott Wave double three structure where blue wave (W) ended at 193.11, blue wave (X) ended at 200.75, and blue wave (Y) of ((2)) remains still in progress. The internal of blue wave (W) also unfolded as a double three structure where red wave W ended in 3 swings at $199.31, red wave X ended $202.24 and red wave Y of blue (W) ended at $193.11 as a Flat. Up from there, blue wave (X) also unfolded in 3 swings as Elliott Zigzag structure with red wave A ended at $199.40, red wave B ended at $195.98 and red wave C of blue (X) ended at $200.74 high.
Down from there, blue wave (Y) of black ((2)) remains in progress as another double three structure. Internals of that decline ended red wave W in 3 swings at $192.22 and red wave X ended at $197.45. Near-term focus remains towards $188.92-$186.90, which is 100%-123.6% Fibonacci extension area of blue wave (W)-(X) to end black wave ((2)) pullback. Afterwards, the stock is expected to find buyers for black wave ((3)) higher ideally or should do a 3 waves reaction higher at least. We don’t like selling it into a proposed pullback as the right side remains to the upside in the higher timeframe.

USDX Elliott Wave Analysis: Bullish Sequence Calling HigherHello Traders,
Today we will have a look at the Dollar Index in the 1-hour chart.
The DXY has a bullish sequence in the 1-hour chart suggesting more upside.
Dollar index ended the cycle from 06/07/18 low at the peak of 06/15/18 (95.13) in the blue wave (W). From that peak it ended the correction to the cycle from 06/07/18 low at the low of 06/29/18 (94.46) in blue wave (X). The internals of blue wave (X) unfolded as a Elliott Wave Flat correction where red wave A ended at 06/22/18 low (94.43), red wave B ended at 06/28/18 peak (95.52) and red wave C of blue wave (X) ended at 94.46 low.
While current pullbacks stay above 06/29/18 low (94.46) but more importantly above 93.185 Invalidation level, we expect the Index to extend higher. We don’t like selling the Index as the right side remains to the upside.

GBPUSD Elliott Wave Analysis: Ready For Recovery? Hello Traders,
In this analysis, we will have a look at GBPUSD in the 1-hour chart.
The pair is correcting cycle from 10/7/16 low within red wave b which is expected to take the form of a zig-zag. Black wave ((A)) ended at 05/21/18 low (1.3201) and black wave ((B)) pullback is proposed to be completed at 06/07/18 peak (1.3473). Below from 06/07/18 peak, it ended blue wave (1) at the low of 06/21/18 (1.3099). Up from there, it completed the pullback in blue wave (2) at the peak of 06/22/18 (1.3316).
Below from there, GBPUSD is currently unfolding as a 5 Elliott Wave Impulse with a extend wave ((iii)). Below from 06/22/18 low, it ended black wave ((i)) at the low of 06/22/18 (1.3246) and the proposed pullback is complete in black wave ((ii)) at the peak of 06/26/18 (1.3292). Below from there, the current view is suggesting that we are still within black wave ((iii)) before a pullback in black wave ((iv)) can be seen followed by another push lower in black wave ((v)) of red wave 1.
Once red wave 1 is complete, the pair should bounce in red wave 2 in 3, 7 or 11 swings before the decline resumes, provided the pivot at 1.3316 high stays intact. We don’t like buying the pair in the proposed bounce as the right side remains to the downside.

BTCUSD Some possible movements based on fib retracements, algo trade targets, elliott waves and past correction patterns.
Chart ilustrates the long term correction.
The short term is possible if the full correction ends in wave (Y). For so, we need signs of divergence when completing the (Y) wave, with daily RSI standing above 26.98, which was the lowest value in the cycle correction till now ( 2018-02-05 and 2018-06-13 ).
The strongest RSI often lays between the range of the 3rd wave of the 3rd wave of the 3rd wave of the cycle/movement. Because we have two points with the lowest RSI, is hard to say which one is the "turning point" in momentum. However, the wave structure tends to indicate that the turning point is sitted at 2018-06-13 (btw, it is the lowest of the 3rd/3rd/3rd of wave B-C), leading us to the case of a long term correction.

Shorting idea for BANKNIFTY
BANKNIFTY NSE:BANKNIFTY completing wave B of A-B-C flat correction started at 27652.
WaveB estimated to end arond 27450-27650.
WaveC estimated to end around 23500.
Good short, good risk reward ratio.
Disclaimer - the above text is only for educational purpose. You indemnifty me of any consequences you face by taking actions you take based on above.


Mind = BlownLooking at a BTCUSD -0.58% chart and USDBTC chart to help overcome any bias seems to show that BTC -0.58% MIGHT be forming a triangle here
Looking for us to hold this zone over the next few days
- I think we might hold because this is a massive demand zone, and for the move up I see the descending trendline as where we get rejected
I COULD BE WRONG - Generally, i'm much more certain about a count before I post it but this is still only a theory, I expect to break down from where we are... BUT if BTC -0.58% Finds support in this range i will default to this chart immediately
Let me know what you all think since this is still a work in progress

$BNB USD - unstoppable or already done?Hey guys,
Thank you all for the recent comments, likes, and PMs. It really helps me out a lot as a trader on this awesome platform. BNB has been working overtime lately so let’s take a serious look at it to see if there’s still more room or if that’s it.
Since these recent waves (from Feb 6th to June 6th) are more of a side way action than actual impulse waves, I’m going to call it a smaller degree correction of a larger correction. So if the wave from Jan 12th to Feb 6th was the first of 3 waves down, and the recent sideway waves are the corrective waves, then we should expect the last and final wave to go to roughly to either $7.50 or $5.50 range.
Technically we are looking bullish. However there is a resistance by the recent higher high trend line, as well as the .618 retracement of the wave from Jan 12th to Feb 6th. These along with other indications from BTC, we can safely assume that we should start seeing BNB correct. I'll be updating this post with more details on target the closer we get to that time. Please don’t forget to like or comment as it always helps to get feedback from you. As always, good luck and stay safe!
Kinashi-San
*The ideas and comments expressed herein are my personal opinions and should not be taken as financial advice. Being a trader, at any given point in time, I may or may not be holding the asset in question. This is not a recommendation to buy, sell, or hold.*

TRON #TRXBTC - correcion time, rally still possibleThere is a distinct possibility of a Truncated Fifth wave and the termination of the impulsive cycle to the upside sooner than expected. This would mean a correction to the downside before the upward cycle will resume. The key technical lele is still 621 satoshi.

Ethereum #ETHUSD - correction completed, time for a rally?After the completion of five growth waves at the level of $ 840, the price of ETHUSD fell below 61% Fibo and set a new local minimum at $ 492. The correction is ZygZak's character and this is a typical correction for the second wave. Nevertheless, the market is still below the local downward trend line and only a break above this line and above the resistance level of $ 615 would open the way to a potential attack on the summit.

Bitcoin #BTCUSD - possible scenario to the downsideIt looks like the recent breakout above the trend line might be a fake breakout. This is the current scenario that indicates a possible drop towards the level of $7,721.

TRX ABC correctionDear friends,
I've two scenarion on the outcome of the ABC correction of trx based on fib spirals and retracements.
Kind regards,
Omar
PS: don't forget to adjust the spiral till they match with waves.

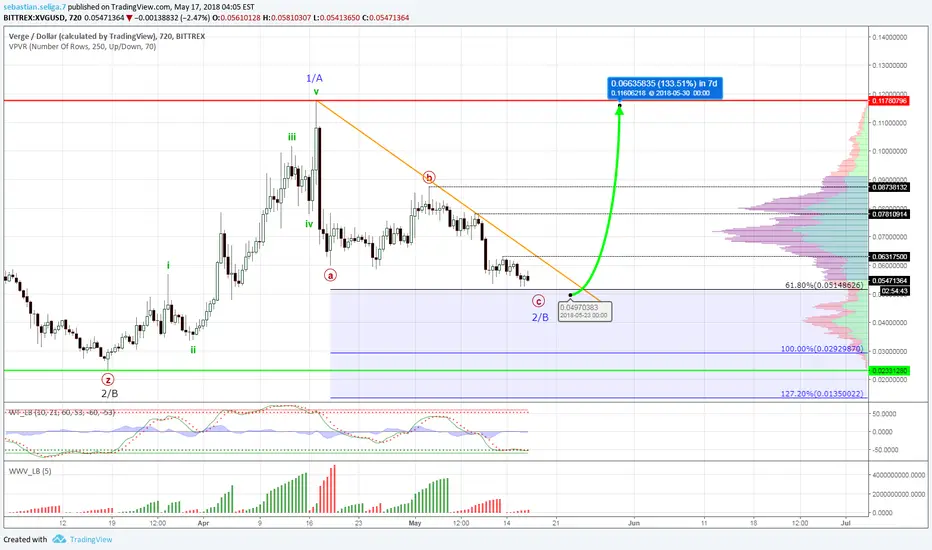
Verge #XVGUSD - about to rally again?From a technical point of view, the price of the VERGE cryptocurrency is in an interesting place on the chart: very close to the target level of 61% Fibo at 0.0514. From there, the price may turn back and, by breaking the downward trend line, return to the upward cycle. Resistance levels on the chart.
Bitcoin #BTCUSD - more downside in viewAfter the three wave advance to the upside, the marked is reversing again towards the local lows at the level of $8,200. This small wave up might be a wave x, which indicates a possible drop lower towards the level of $7,712 as the correction evolves into a complex one. Moreover, the golden trend line is still providing the dynamic resistance for the price, so as long as this line is not violated, the outlook remains bearish.

ADABTC (Cardano) BUY @ WolfeWave & Prior Wave 4 Low area.ADA/BTC (Cardano) BUY, 05/07/18, written 9:45 p.m. EST, by Michael Mansfield
Cardano's Wave 4 is likely bottoming at or near the Wolfe Wave trend-line (dashed black line). The low came a day early to what was optimal but within the 5-12 days that I expected the retracement to last, and mentioned in the prior Cardano post. Nevertheless, even if the low is in, the correction may end up more complex, which is fine.
A Wave 5 move up should unfold to the Gann Fan 3/l line (blue downward angled line labeled Elliott Wave V & 5), which is also where the 50% retracement level of the January high to March crash low is, and where an Andrews resistance line (solid black), all meet.
The price area mentioned above should provide very strong time & price resistance. However, should this expected rally have a steeper slope and more volume than April rally, this wave count might be one degree too low, thus it would more bullish than I currently show.
The low will likely be confirmed if and when Cardano breaks the down channel resistance line (black line closest to current price).
Once the forecasted Wave 5 top is in, I would then expect a larger degree ABC correction down (labled A B C in red). Then repeat 1-5 back up later in the summer.
NEGATED IF:
This outlook is negated and would then be bearish if the ADABTC fails to break the Gann Fan 2/1 line (blue downward sloping line at Elliott Wave 3 area), within 10 days and/or it breaks 0.000027 to the downside.
-----------------
BUY idea:
Buy @ 0.00003650 or better (currently @ 0.00003635, probably OK to buy up to 0.000038).
Initial Protective Stop Loss @ 0.000027
Move stop to 0.00003350 if .000040 is reached,
Consider exiting 1/3 position @ 0.000041 and move remaining
position stop to break-even.
Wave 5 target is 0.00005264 so exit another 1/3 at 0.000052 and trail stop below 2-3 day low at that point.
If the correction turns out to more complex, as mentioned above, it should be OK with the stop we suggest. (See prior Cardano post from 05/03/18, for zoomed out view).
We will try to let you know if the waves unfold as expected in order to pinpoint the high time and price, or if the outlook becomes more bullish or more bearish.
RATIONALE:
Cardano fell into the Wolfe Wave (Wave 1 - Wave 4 trend-line) target area, which also met the Elliott Wave's prior Wave 4 target area.
The current low was almost exactly at the expected price from the prior post, and 5 days from the top, if you count the top day, which was a large range outside bar reversal down.
Volume has declined since the high on 05/03/18, which is expected if this is just a correction. If it was a new bear phase, volume during the sell off should have increased, but It did not increase.
That is bullsih.
The sell off of 5 days showed very low momentum. This, plus the declining volume means that the selling was likely almost all just profit taking, with no large short positions.
This is also a bullish sign.
-------
TRADER TIP: A bullish Wolfe Wave support price target line is drawn from the Wave (i) high to the Wave (iv) low (opposite for a bearish Wolf Wave resistance price target line).
In either case, these are supposedly the average minimum price expectation for a pullback or retracement. As always, use this tool prudently along with other supporting/confirming techniques.
DISCLOSURE:
This analysis is meant for educational purposes only. You trade at your own risk!
Michael Mansfield CIO

Bitcoin #BTCUSD - attack on $10k canceled?It does not look too good for bulls, but they are still trying to push the prices higher. The important levels are : $9,538 (resistance) and $8,653 (support). The bullish impulsive count invalidation line is at the level of $8,405.

OmiseGo (OMGUSD) bears will soon crash the bulls’ partyThe 4hr tf chart of OmiseGO (OMGUSD) from ~$7.77 on April 1, 2018 till present is identified in this analysis as 3 wave move (corrective)Elliott wave structure that should end up as a zigzag once minute wave ((c)) is complete. Termination of minute wave ((c)) based on this analysis would also result in the termination of a Minor wave degree.
The implication of the above is that a sell off should follow that will either deeply retrace the uptrend from $7.77 or even close below $7.77.
The target area for the termination of minute wave ((c)) of OmiseGO (OMGUSD) is indicated by the horizontal green lines.
POI (point of invalidation) for this analysis (not shown here) is a price close above $23.57.

ETHUSD (Ethereum) Heading Lower to $565-550 ChannelETHUSD Heading Lower to $565-550 MMansfield. 9:00 p.m. EST 04/30/18
Ethereum should tag the lower channel line within 48 hours or less.
REASONING:
We saw mostly declining volume into the retracement high that failed to make a new high (labeled Wave B).
The WT Cross indicator showed divergence at the $721 high, and the MACD (3,10,9) followed with clear intra-wave divergence at the $703.99 retracement high.
Lower targets are at least $565-550, channel line that is also near the Wolf Wave Wave 2 to Wave 4 trendline for added confluence of support.
ETH may drop to $511 area, but if $495 is broken on the downside, then a further bull move could be in trouble!
DISCLOSURE:
This analysis is meant for educational purposes only. You trade at your own risk!
Michael Mansfield CIO

Elliott wave analysis of Ripple (XRPUSD): 4hr tf My previous post is referenced below in order to keep track of the progression of Ripple (XRPUSD).
Ripple's (XRPUSD) price action has remained in a sideways trend after it closed at ~$0.92 on April 20, 2018. The sideways price action is identified in this analysis to be a combination (W-X-Y) Elliott wave structure with Minute wave ((x)) currently ongoing.
The implication of the above is that a Minute wave ((y)) should finish downwards as indicated by the red arrow on the 4hr tf chart for Ripple (XRPUSD) before XRPUSD can resume a sustainable bullish move.This analysis favors Ripple (XRPUSD) targeting between 38.2% and 50% ( i.e. ~$0.74 and $0.70) as the Support area because this lies in the region of technical support for Ripple which is between ~$0.71 and ~$0.74 as indicated by the horizontal black line.
Point of invalidation (POI) is placed just above the high of ~$0.97 reached on April 24, 2018. POI in this case is a price close above $0.99

Bitcoin - close to the key level supportThe nature of downward move is corrective so the main impulsive count is still valid. The level to be observed for today: $ 8,438, i.e. the level invalidating the impulsive growth counter due to the overlap of waves 1 and 4.
