Bitcoin doesn't let us DownBitcoin moved as expected during the weekend, following our forecast to the letter.
Looking for additional upside to be confirmed before we can say we have resumed the uptrend.
Feel free to ask any questions and trade safe!
Elliottwaveforecasts

DJI looking for upside resumptionGood morning all!
I'll be breef as I the count kind of speaks for itself. It looks like we are ready to resume higher into wave 3 as we are looking at what appears to be a clear three wave move into wave 2.
It looks like TECH will be giving a break and VALUE will come back strong into sector rotation.
CHECK OUT my previous post on the NASDAQ which played out perfectly, let's see if this post will have the same faith.
Feel free to ASK me questions in the comments.
Enjoy the weekend and trade safe!

NASDAQ to infinity and beyondYou are looking at the 1h chart of the NDQ.
Based on my EWC it looks like this pullback is just another bullish retracement which could find support.
We started pulling back after reaching 1.618 (iii) vs. (i) which is the most common fibonacci target for third waves.
Questions are ALWAYS welcome, trade safe!

KDP - Dr Pepper looking promisingThe count kind of speaks for itself. It looks like we could be near the completion of a considerably large correction into wave (2).
Questions are always welcome, trade safe!

Weekly Update: The Triangle Count was Invalidated, Now What?Since the December lows of 3788 ES, I have been tracking a triangle pattern that would have reconciled higher in my target box for a larger B-wave. Readers can look at previous postings to see what I have been forecasting. Last week, SPX Futures breached the 4208.50 level. So, with that, the final micro target of an e-wave was invalidated and thus the triangle count abandoned.
With respect to a triangle pattern, two topics I continue to share with my members in our trading room is (1) Triangles are rare patterns, and (2) they typically invalidate between the D and the E wave, only to reveal a much simpler pattern. Yes, it is true price patterns can become complex when in the midst of a counter trend corrective rally or decline. However, I tend to keep my labeling simple rather than defaulting to the complex as many of these patterns tend to be viewed as simple zig zags in the rear-view mirror. That is what we have been presented with now that price has invalidated the more complex triangle pattern as featured above.
Here's where things get tricky.
For the Elliott Wave uninitiated, after an A and B waves you get…” Wait for it” …a C wave. Anyone who follows or practices Elliott Wave Analysis would agree when I say that a C-wave feels like a Crash when the reconciliation is to the downside, or a parabolic move when the trend is up. If you wish to challenge that my determination of that feel free to post your comments below.
I will admit in the short term, there appears to be some work to do to the upside for our A wave to equal our C wave higher. But here’s the most important piece of information I share with you today. With the breach of 4208.50 last week, I now have the minimum waves in place to consider this counter trend rally complete. However, as of the time of my authoring this weekly update, I have no immediate information that our upside pattern is complete. Let’s discuss what I expect now, and what clues we will see before such a “Crash Event” lower is underway.
My Expectation:
Let me start with the mathematical sweet spot for the counter trend price action to complete and reverse from. That price point is the .618% Fibonacci retracement level up at 4309.50. That would mean we have about only about 2.8% upside left to go from current levels.
However, the reasonable target area higher (above the .618% level at 4309.50) could extend at maximum to the price area of 4529. That is the .786% retracement level. In fact, prior to that level, price would have to exceed the 1.0 extension level higher at 4517. So, let’s assume that everything goes right with the Fed, Inflation, the Jobs Market, and Not to mention the debt ceiling…4529 would be the statistical anomaly for higher price action.
So, what’s my expectation higher: Provided we do not breach 4062.25 then I think it’s reasonable to expect 4309.50. Below 4062.50 and the possibility we are in our C-wave down to NEW LOWS, starts to get higher.
Disclaimer: If you have gotten this far in this post then you have read all of the above. Many of the comments I receive here on TradingView...are from people who scan my posts...but have a lot to comment on...al of which I address within the context of my posts.
Just like trading...reading is hard.
Best to all,
Chris

BTC analysis Trend, Elliot waves, Hurst Cyclemy pov: We are at the button of a longer term bullish channel starting Nov 2022, within that channel also in a smaller bearish channel starting from 14.04.2023. IF BTC manages to quit the long term channel, we might see 18-21k, or even lower. If not, we will continue the bullish channel up, which happened in March 2023. The wave 4, which we are in right now, is correctiv, has room between 25-21k down. That BTC did not buttom yet, hurst cycle is a good confirmation as we still expecting 2 low troughs in June and July 2023. Right now, bulls and bears are in balance, as we see in the trend channels. Please share your ideas on this.

Knock Knock Bitcoin, are you there?Well, what is there to say? Bitcoin has been moving very well for the last couple of months until it started to surprise me. At this point it's still moving according to the count as it reacted off of equality of wave {c} vs. {a}.
With all honesty I do not have a clear idea on whether we have finished wave 2 or not, but for the time being I do not have any reasons not to be bullish.
I'll keep it monitored, but all I can see is that there are no conditions to open any trades nor long or short, but that is obviously my own opinion based on the way I trade and my own experience.
As always, these is not financial advice, but feel free to ask questions if you have any!
Trade safe!

Nifty50 Day start analysis: 2023.05.18Nifty50 has completed Wave b and is not into beginning of Wave c.
The possibilities of end of wave c marked on the chart.
SL set shall be top of wave b.

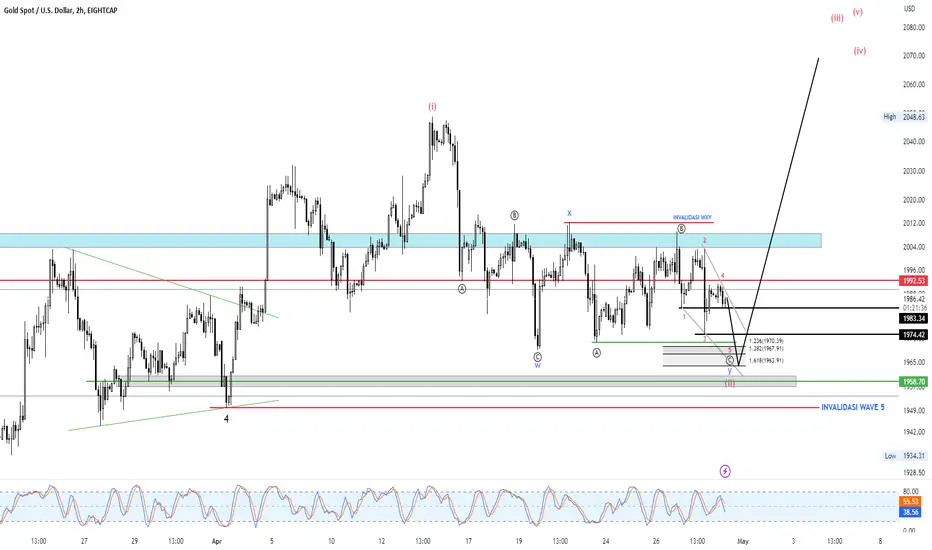
XAUUSD FORECASTI know almost all forecast on XAUUSD choose Triangle Scenario, So here's my perspective as WXY Corrective.
Elliott Wave's perspective is highly subjective, in my opinion, Invalidation Level is needed as all technical analysis is just an art of probabilities.
Safe trade, Everyone!
Cheers.
Please subscribe our Youtube Channel (Link on Profile) and follow Us for more contents.
#BITCOIN BUY SETUP 80K TP. #ELLIOTTWAVEThis count is based on my assumptions so anything can happen not a trading or financial advice just for educational purposes only kindly do your own ta thanks trade with care good luck.

XRPUSDT LongThis is Elliott Wave Analysis that shows a potential long trade opportunity.
If Bitcoin breaks down sharply, do not take this trade, as the price will likely drop much further than shown in the image.
If the parallel trend channel holds, this could be a good trade. If you do take this, be ready to cut the trade if the market drops further than expected. It is best to not enter with a limit order, but manually enter using a market order if the market seems to hold within the green triangle buy zone shown in the image.
Entry: Between 0.4073 and 0.4000
Exit: 0.4337: profit target 1, 0.4581: profit target 2
Stop loss: 0.3792
Disclaimer: Not financial advice - intended for educational purposes only

DAX scenarios in the lower timeframeTrading day preparation. Although pullback is expected in the higher timeframe, we probably still go up in the lower timeframe. We discuss several scenarios that could play out.

Whatever you need to know about BTC sycle** IT'S NOT FINANCIAL ADVICE **
** SO PAY ATTENTION IT'S JUST MY IDEA ABOUT THE NEXT MOVEMENT IN THE CRYPTOCURRENCY MARKET **
------------------------------------------------------------------------------
Hello Guys
what's up?
Hope you feel great and always be happy and successful.
Today I want to talk about the Elliot cycle of Bitcoin.
it's really interesting.
so don't waste time and see carefully this Elliot analysis.
this analysis is about BTC in the weekly timeframe.
as you see we have two different parts.
in the first part, a huge bullish trend is obvious.
I drew the five main trend (Red Line)
and show you all the details you need to know. it's about minor waves(Blue & Black lines)
so after finishing 5th wave, I expect the market to correct. this correction contains three waves. we call it A, B, C
A is a downtrend wave.
B is up trend wave.
C is a downtrend wave.
The market started to downtrend from 69k to 15k as A downtrend.
at the end of the A wave (15500) we started an uptrend that we know as B.
and finally, we have a C downtrend to the support zone.
but there is a question, How high can the B wave rise?
well, well, well ... let me tell you.
we change the timeframe from weekly to daily. so we can see 35500-36000 is a very strong zone that causes to push the price in the previous movement to 69K.
at this time we lost this support zone and unfortunately, this support zone converted to a Resistance zone.it's really bad news. I expect the price to retest 32500-33500 and then drop. it means the B wave will be finished. and a new correction wave is beginning.
as I told you in the previous analysis we have three strong zones to support the price
this first one is 9800-12500
the second one is 7500-8500 and the Third one is 3800-4300
it means the target of the C wave is one of three support zone.
and if we close two days below the first support zone with high volume, the next support zone will be active.
please pay attention to money management and put stop loss in your trade.
I EXPECT YOU TO SHARE THIS ANALYSIS WITH YOUR FRIENDS AND WRITE YOUR COMMENTS BELOW.
Thank you so much in advance.

Is #PEPE still headed for the moon or is the rally done?I don't trade this coin, but here is what I was talking about on this morning's Wolf of All Streets Podcast with a bit more information.
My count suggests that wave (iii) of ((iii)) terminated at the current swing high. Since, then wave (iv) has been printing what appears to be a flat correction. If so, then it is likely complete at the swing low. However, further decline has targets of the 38.2% and 50% retracement levels, respectively. The targets are based on the completion of wave (iv) and are denoted by the red arrows.
It's possible that a double top formed, which would give us a pattern target of the 50% retracement area at the hourly pivot. But we need to see further breakdown to confirm that likelihood. Failure to do so will invalidate the pattern.
So, if price rallies, instead, then an impulsive breakout above the descending purple resistance will signal that wave (iv) is likely complete. Further breakout above the wave b extreme will add confidence to the count. And wave (v) of ((iii)) has one of the red arrow targets depending on which of the pullback targets is hit.
Basically, I'm looking for an impulsive breakout above the purple line to signal that wave (iv) is likely complete, no matter which pullback target is hit. Further breakout above wave b will signal that wave (v) of ((iii)) is likely in progress to one of the aforementioned targets.

Tesla : Ready?In the last post about Tesla I said price was ready to move up. This was a little too early but price eventually bounced from the 100% fib extansion around 101. This ended a nice corrective pattern from the all time high. Since this low price has more than doubled from the low in what looks like an impulsive wave 1 of a much larger wave 3. The wave 2 that followed this rally looks like it is finished aswell which means price could be ready for a big move up soon. This wave 2 was a double three corrective wave (wxy) with a possible head and shoulder pattern forming at the 100% fib extansion.
Alternative in the short term is price is looking to fill the gap at 144 to finish the wave 2.
Best of luck!

BHARTI AIRTEL - POSSIBLE ELLIOT WAVE COUNTSHELLO FRIENDS,
Today I am sharing the possible ELLIOT WAVE counts of BHARTI AIRTEL on monthly, weekly and daily time frames.
Bharti Airtel is in wave (5th) of 3rd wave of bigger impulse wave 12345.
Generally as per ELLIOT WAVE guidelines, bigger wave 3 may go up-to 1.618 of fib levels which is around 1060 on spot chart and also shown in the charts given below.
WAVES and DEGREES to refer and understand the chart smoothly.
Bigger Wave - 12345
one degree lower wave - (12345)
two degree lower wave ((12345))
three degree lower wave - (((12345)))
Time frames and ELLIOT WAVE COUNTS
MONTHLY - BHARTI AIRTEL is in the 3rd Wave of bigger Wave 12345
WEEKLY- It is in the ((5th)) wave of smaller degree wave ((12345)) which will complete Wave (3rd) and then after we can see some correction in wave ABC or ABCDE to complete wave 4 and after completion of wave 4, the price will again move towards north to start wave (5th) that will complete bigger wave 3rd
DAILY- It is in the smaller degree wave (((1))) of higher degree wave ((5th)) which will complete the wave (3)
monthly time frame chart which is showing that the price is in wave 3 of bigger wave 12345.
weekly time frame chart showing that the price is in wave ((5th)) of wave (3)
daily time frame chart showing that the price is in wave (((1))) of wave ((5))
It has also give a breakout of BASE FORMATION PATTERN with intensity is volume (i.e. volume is above MA)
at the time of breakout, trend indicator such as MACD and Oscillators such as RSI also shows strength in price.
MACD in daily
MACD in weekly
RSI in daily
RSI in weekly
Price is also above 100 Exponential Moving Average in Daily Time Frame
Summary-
Price showing UPTREND as per Elliot Wave
and also Price has given Breakout with good intensity in volume which again supports our bullish view.
Price have given close above 100 EMA which also signifies the bullish view.
trend indicators and Oscillators are aligned in double time frame which boosts the importance of our view.
Thus, stock is supposed to move in north.
DISCLAIMER
I am not SEBI registered analyst.
please consult your financial advisor before investing.
My studies are for Educational purpose.
I am not responsible for any kind of your profits and losses.

BCHUSD | Wave projection | Doubled Bull Flag Move +50%Wave Analysis with price and chart pattern
> A possible ABC motive wave bullish scenario with a doubled bull flag pattern support, the price currently within the second bull flag local pattern.
> This doubled bull flag is forming a major inverted head & shoulders reversal pattern.
> Medium term target @ upper rising channel resistance for bull flag pattern + 50% upside
> Pullback Entry at the rising channel support liquidity swing zone with potential false breakdown area.
Always trade with affordable risk and respect your stoploss!
Good Luck

Three Words You Don’t Want to Hear in the Next 3-5 MonthsI spend 90% of my day analyzing the various financial assets within my coverage basket. I produce long, intermediate, short and micro price forecasts for my members each day. On occasion, I make forecasts that are clear from an analytical standpoint, but are not from a real-world standpoint. The truth is, whatever the event catalysts are they always tend to show up at the right time.
Case in point.
The beginning of February 2023 I forecasted we were topping in our ongoing corrective structure upwards when the SPX Futures were at 4208.50. However, I was convinced the ES Futures price would first strike 4242 before embarking on a retracement that would, minimum, take it to the 3950 area. In retrospect, we came up short of my 4242 target and then...
CUE THE DRAMATIC MUSIC….
Then the regional banking crisis reared its ugly head from out of nowhere. Not only did prices hit my target of the 3950 area, we declined to the 3839.25 level, before finding a short term bottom. My point is, as an analyst, I'm never going to know what the catalysts are…but they remarkably tend to show up at the right times for validation.
…and now we have a silent catalyst brewing. One that has yet to rear its ugly head, but daily threatens us, to do so.
No, I’m not referring to the HKEX:1 Trillion or more in unrealized debt losses on the books of major and regional banks that remain undisclosed (we’ll get to that shortly). Additionally, I am not referring to the pending bomb embedded in the commercial real estate market… (Work from home is here to stay…yet we have trillions of dollars in loans in empty vanity sky-scrapers). Side Note to CEOs: Good luck getting people who CAN work from home and accomplish their jobs, to back to facing a stressful commute, exposure to toxic work environments, office politics, etc….
I’m referring to the Debt Ceiling Standoff in the US.
Let’s start this discussion with the chart above. This chart should be familiar to you as I have posted it for the past several weeks.
The far right-hand side of the chart you’ll notice after potentially getting price back within maybe 10% (Red Arrows) of the SPX’s all time high…We would then lose approximately 30%-35% of GLOBAL WEALTH attached to the index. My analysis bears (no pun intended) that out…BUT WHAT WOULD BE, WHAT COULD BE …THE CATALYST TO CAUSE SUCH A SWIFT & DRAMATIC DECLINE?
Well, maybe it begins with hearing these three words…maybe reading about these three words…or listening to the TV and hearing these three words…
”MOTION TO VACATE”
What is a “Motion to Vacate”? Let me get back to that.
First, the debt ceiling, what is that? Since the US Congress rarely passes a budget anymore (last budget passed was August 1, 2019) they vote of something called a continuing resolution or (CR). This allows for the government to operate only for a specified period of time provided the debt does not grow past the statutory limit of the CR. During the timeframe of the CR, the government does things like sell US Treasury Bonds, pay Social Security, Medicare, fund the military, etc. normal course of operations stuff. When the statutory limit on what the US debt can be is reached, the debt ceiling needs to obviously be raised. Historically, this has been a perfunctory exercise. Raising the debt limit simply allows the government to continue to pay its bondholders interest, send out SS checks, Pay Medical expenses associated with Medicare, pay the paychecks of service men and women, etc. THIS IS NOT NEW SPENDING, OR FUNDS FOR PET PROJECTS. Not raising the debt ceiling would be similar to your bank freezing your checking account. You have the money, but you are prevented from to having access to it, therefore you cannot pay your bills. Your creditors will not care you have the money, they only care they don't have their payments. Hence, your credit score is negatively impacted, and your future ability to borrow becomes more and more difficult. Eventually you are deemed a credit risk.
Now imagine that, but on a far far larger scale.
Suffice to say, the implications would be dire. If the US defaults, regardless of technical or actual, the US economy would go into a recession very quickly. Just like when any of us do not pay our bills, to get a loan, we would have to pay much higher interest rates. Therefore, interest rates would go higher in the US. Why? Because why would anyone want to hold treasuries if there is no longer a guarantee to be paid on time. So US treasuries would be sold...thereby driving interest rates higher. That would cause Inflation to also go higher, and this tends to spiral. One negative after another, the economy eventually contracts and the US would enter a recession. To what magnitude? No one knows. This hypothetical scenario has never played out in real life.
Ok, now that you know this would be bad...let's get back to "Motion to Vacate".
So, what was once perfunctory, is now seen as leverage to negotiate on behalf of a minority party.
Unfortunately, this new class of representatives have heard of this tactic, but never seen it used with fruitful outcome to a minority party. The reason is NO US President wants to negotiate something, that has been historically seen as a mere technical expectation of operating the government. Therefore, ALL US presidents refuse to negotiate the Debt Ceiling and simply expect a clean (CR) to raise it and allow the government to pay its CURRENT obligations.
Enter the new Speaker of the House. Kevin McCarthy.
Kevin McCarthy was voted in as speaker of the US House after an unprecedented 11 rounds of voting in HIS CAUCUS. To achieve those votes, he assured the holdouts he would support using the Debt Ceiling to extract demands from the current President.
This new class of representatives made their point of view clear, if you cannot be successful negotiating, we will remove you as speaker and install a new speaker would could be successful negotiating with the current administration. (Like that makes a lot of sense).
The removal of the speaker would begin with only one member of the speaker’s caucus making a “Motion to Vacate” the chair, on the floor of the House of Representatives. This would automatically trigger a floor vote to remove Kevin McCarthy from his speakership. The same speakership his caucus had to vote 11 times before they could agree on him as their leader. This unproductive move, knowing the current administration wouldn’t negotiate with the last guy, digs both sides into their respective positions. There is no practical reason why a new speaker would somehow miraculously change the outcome.
Hence the probability of a technical default would escalate exponentially.
So, I’ll conclude with how I started.
In the above chart you can see clearly that if my analysis is correct, and a catalyst shows up in time for validation purposes only, we could soon be in for a decline of minimum (4350-3200) of 26% in a relatively short amount of time. I speculate something would need to change, a new shoe to drop of some magnitude, leading up to that.
Additionally, I say minimum because our 2020 Covid-low of approximately 2,200 I believe needs to be revisited to validate a super-cycle event. (See Below Chart)
Maybe that area is not visited within this near term decline I am forecasting (4350-3200) we experience by end of this year. However, I do believe we will sub-divide in such a manner that eventually, those levels become realistic to our future selves.
Lastly, I'll revisit the fact that aside from the Debt Default possibility becoming more realistic by the day...the banking crisis still looms.
This is an issue that will not go away until banks who hold long maturity dated treasuries can substantially reduce those holdings, as that area to store and earn interest on capital has a variance of 2-3% with what banks and money markets are paying their depositors to store capital with them. These unrealized losses on these long dated treasuries will have to be resolved. To sell these holdings would drive bonds prices down, and rates higher....potentially further exacerbating the problem. In addition, over HKEX:1 trillion in commercial real estate loans that need to be paid off or refinanced in the next year as those loans come due. The Banks will have to hoard capital to solve their problems, and who on Wall Street wants to refi commercial buildings with few tenants? Is HKEX:1 trillion in commercial real estate debt about to default?
In summary, this post accomplishes one thing for me. It explains to my followers in detail the problems we're currently facing and may soon face. As traders, this is an educational piece. However, in fairness, there's a lot of speculation contained in this post. I want my followers to aware of the potential hazards we face trading this market each and everyday. I'm ready, willing and able to go long this market, provided I am afforded both the analytical basis and the trading set-up. I can manage risk, and having protocols in place will protect me to a large extent in the event any bullish thesis goes bust.
Nonetheless, I struggle to find any practical basis to be anything but short this market when set-ups are clear...and choose to remain flat when price action is retracing higher. But I will say, my trading strategy for the foreseeable future becomes crystal clear if in the next three to five months I hear the words, ..."Motion to Vacate" being used in the US Congress.
Judging by my chart, whether it's the US debt ceiling, the baking crisis, commercial real estate loans, or some other unknown...A catalyst should be showing up to validate the BIG RED ARROW ON THE RIGHT OF THE CHART ABOVE.

count for CHZUSDTcurrently, CHZ is still in a prolonged correction and is still missing a wave to complete it's correction.
one more drop IMO.
overall all count is still bullish, still a strong uptrend based on HTF. wave 1,2 and 3 is already complete IMO.

BANKNIFTY - Diagonal Formation - Elliott Wave BankNifty is currently moving higher and will reach the upper trend line before starting its correction. Bullish moves can be expected for the next few months before the index finally starts correcting the larger move.

Is a new bull market on the horizon? Likely, yes, but...... it can NOT lose the support at 403.90, or count invalidates, and has to break above 419.5 for confirmation, which will likely trigger an impulse higher up.

Gold Wave (2)Gold is near ending 5th wave from the impulsive wave starting from 1617$ per ounce,
i am looking for a three wave pullback towards 1937-1840 area to enter longs again targeting new highs towards 2350/2500 $ per ounce.
we might see 2055/2060 before this correction might start.....

AVAXUSDT| ABC Wave Projection| Retesting Inv. H&S NecklineAVAX price breakout SMA50 with bullish pennant pattern, possible ABC pattern retesting mega inverted head & shoulder
TP 0.618 - 1.0 fibonacci retracement of wave B +25% upside
S1: SMA50 17.50 and S2: SMA 200 16.00
