the bottom yet to come - wyckoff accumulation phaseelliott wave analysis of bitcoin on daily timeframe
the latest move/wave does not look like an impulsive move but rather a corrective move
as a result, the idea of bear continuation and new bottom occurrence probability shall not be ignored.
If it is the case, then we may assume that the market might be in a accumulation phase for extended period of time (as displayed in the chart) mainly sideways and probable new bottom to form before the bull run resumes
details of the analysis is presented on the chart and you are kindly invited to check the links below for further details of the characteristics of the elliott waves
please note that :
- these patterns do not provide any kind of certainty about future price movement, but rather, serve in helping to order the probabilities for future market action
- trade setups must be confirmed in conjunction with other forms of technical and fundamental analysis
- and please remember that this analysis is not a financial advice and presented for educational purpose only
Elliott Wave Theory : Motive Waves and Corrective Waves
Published Indicators : Indicators page
Elliottwaveforecasts

PLANB | Elliott Wave Projection - Leading Diagonal 5-WavePrice action and chart pattern trading
> Wave projection - Leading diagonal pattern with a possible 5-wave uptrend
> Entry @ pullback and breakout downtrend line wave 2 and wave 4 near lower support of uptrend wave channel.
> Target @ previous primary wave 3 | 0.786 - 1.0 zone +30% upside
> Stoploss @ upcoming wave 3 and upcoming wave 5 zone -10% downside
> Risk reward ratio 2:1
Always trade with affordable risk and respect your stoploss

Gold set to break resistance; $4878 possible this year? Gold is currently approaching its next Fibonacci resistance level of $2096. Once this level is convincingly broken, the next resistance levels will be $2272 and $2463. According to my Elliott wave analysis, gold has started its third impulsive wave, which is part of a higher degree third impulsive wave. These impulsive waves are typically the most explosive and long-lasting. Therefore, we can expect an exciting spectacle in the coming months. I do not rule out a short-term price target of $4878 within a year, as this price target is based on the 1.618 Fibonacci extension of the impulse wave 1 (Dec '15 - Aug '20). Lastly, the monthly chart shows a MACD crossover, which supports my bullish expectations. This typically indicates that the price of gold is expected to continue its upward trend.

Silver set to explode. According to my Elliott wave analysis, Silver is in the early stages of a third impulsive wave, which is part of a larger third impulsive wave. This is the most explosive wave, with significant price gains expected. The recent breakthrough of a crucial Fibonacci resistance level at $24.66 confirms this outlook. With this level breached, silver now has a clear path to reach $45 in the coming months, with a potential fifth impulse wave pushing it to around $83.
Brace for some serious excitement in the coming months!

[XAUUSD] GOLD BULLISH CONFIRMATIONBy looking the price action, in my perspective, Gold is on New Motive (Bullish Confirmation). Invalidation level at the chart.
Trade safe, everyone!

Weekly Market Update: Triangle Pattern Conclusion UnderwayAs of right now I would say the triangle pattern certainly is the prevailing pattern thesis. A triangle pattern is one that neither gives bulls nor bears much hope or despair as it tugs at both camps because its range bound. For this trader, I would classify myself as bearish on the overall market, however that does not preclude me from getting long for profit. As of my writing, I am currently short the ES and plan on closing out those positions down in my target box.
As we begin our descent into my target box, I should have enough price action to dial in my position closing area more so. From today’s price of 4130 down into the area of approximately (The Sweet Spot) 3950, I plan to access the pattern for a potential long. If price has declined in a corrective manner (3-Wave Pattern) into my target box, then a long into the 4300-4500 makes sense.
I wanted to keep this post simple, concise and to the point.
We have enough noise to contend with between this regional banking crisis, inflation, the Fed, Jobs and the overall economy.
Based on the pattern I have as of today, the above are my expectations…and as of today, I have no additional information that would cause me to change that analysis.
Best to all,
Chris

Solar Coin ($SOLAR): Short term Bullish SetupFrom a technical point of view, this $altcoin could remain interesting in short term, that said, if we look at the daily chart, $SXP could develop a bullish impulse structure (12345). This setup is very simple, wait for pullback in support area to try to take long position with stop loss below the support (daily close).
Trade with care! 👍 ...and if you think that my analysis is useful, please..."Like, Share and Comment" ...thank you! 💖
Cheers!
N.B.: Updates will follow below

MONTHLY CHART CRUDE OIL ELLIOT WAVE ANALYSISMy take on crude oil monthly wave structure.
Working on the idea of classic motive pattern to the upside to complete wave I of (V).
What do you think?

Update: Wave 4 is not yet complete in EURUSD 4hrWave A got completed below 1.08020 and after that it formed clear wave A down and wave B up of the Wave B (ABC) three leg move.
Now it looks like its wave C down move which is expected of having 5 wave down and can come down to the Equality of wave A
EURUSD Short
Entry : 1.08921
SL : 1.093
Target : 1.07096

sell setup for goldwe have elliott wave truncation
so we expect a reversal and search for " ABC corrective waves " selling opportunities
_____________________________________________________________
don't forget your risk management
follow for more :))

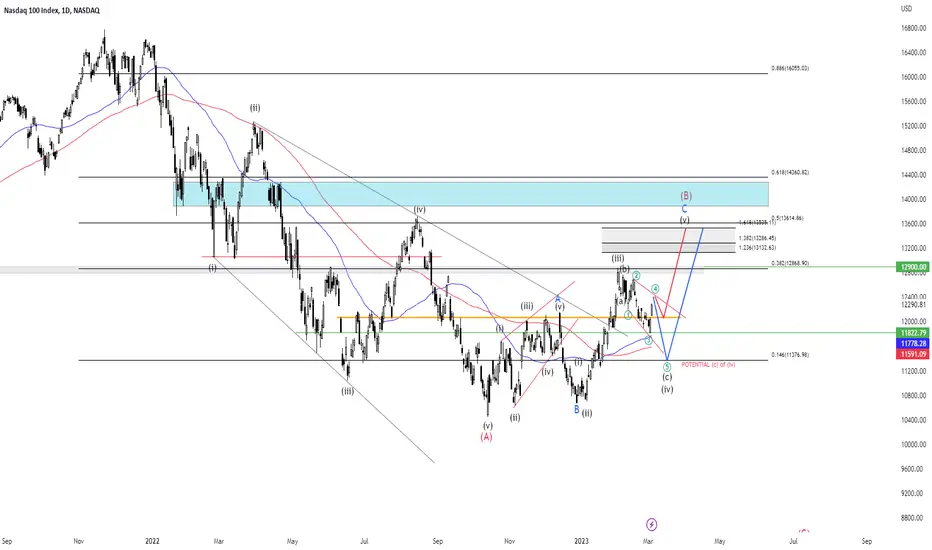
[NDX/ US100/ NAS100] NASDAQ LOOKING FOR 13500Here's an update for Nasdaq Composite Index, got 2 alternative move, how about you guys? Let me know in the comment section, Thanks.
Trade safe, everyone!
Weekly Update: Are we headed towards my Target Box Today?Today's price action will be crucial as to whether or not we head directly into my target box. My past posts have provided enough context. The sweet spot to target is 3772.

Bitcoin Reversal with Highest Volume of 2023?I Want to point out a few things about the last bitcoin's possible reversal point:
1- We had the highest volume on daily candle since 2023 with a bullish pin bar
2- The price rejection is from the previous cycle ATH around 19700$ which makes it an important level (Maybe the strongest support till 16000$) and also near the bottom of the ichimoku cloud
Now, IF we consider this as a reversal , there are a lot of things happening here:
1- A huge channel has appeared beginning from 16300$ which I draw as a Fibonacci channel
2- Trading View's Elliot Wave chart pattern shows the targets with its wave projection considering the end of wave (a).
And here are a lot of Resistances on the way (If you needed to read more about Volume Profile here is the link ):
1- Around 21500$ is both VAL of the Volume Profile and a technical resistance around the end of the wave (4) as the first target of the wave (b) projection
2- Around 23000$ is both POC of the Volume Profile and around the top of the ichimoku cloud as the last target of the wave (b) projection
3- Also we have a bearish trend line on the way
And don't forget that Today and Tomorrow we will have the least volume and price movement according to the averages (linked the script on the related ideas), so Monday will be the real deal.

Further Downside in DAX Impulsive Elliott Wave DeclineDAX ended cycle from 9.28.2022 low in wave ((1)) at 15707.61 with internal subdivision as 5 waves. Index is now correcting that cycle within wave ((2)) in larger degree 3, 7, or 11 swing. Internal subdivision of wave ((2)) is unfolding as a zigzag Elliott Wave structure. A zigzag is an (A)-(B)-(C) structure where wave (A) and (C) both subdivide in 5 waves. Wave (A) of ((2)) is now in progress as 5 waves. Down from wave ((1)), wave ((i)) ended at 15524.85 and rally in wave ((ii)) ended at 15667.21. Index resumes lower in wave ((iii)) towards 14913.98, and wave ((iv)) ended at 15128.25. Final leg lower wave ((v)) ended at 14887.44 which completed wave 1.
Corrective rally in wave 2 has ended at 15272.11 and the Index resumes lower in wave 3 towards 14702.91. Wave 4 is proposed complete at 1488.06. Expect the Index to see a few more lows before ending wave 5 and this should complete wave (A) in larger degree. Afterwards, the Index should rally in wave (B) to correct cycle from 3.7.2023 high before it resumes lower again in wave (C) of ((2)). Near term, as far as pivot at 15707.6 high stays intact, expect rally to fail in 3, 7, or 11 swing for further downside.

Weekly Update: Will Targets Get Hit?Since I started posting on TradingView.com once per week, I have been warning my readers of softness into the 3800 -3720 area target box. Today, I have no reason to believe otherwise. Really, my only question is when, and then what happens next?
I have a purple pathway down to the low 3000’s and as of now that remains an alternative. With the loss of positive divergences on the hourly I do believe eventually we get into my target box. From there I look to constructive patterns developing.
So far nothing has changed…how we get there is up for discussion.
Best to all,
Chris

GBPUSD: EW perspective (A rise, then a drop)Dear traders,
I would like to present to you my Elliott Wave (EW) perspective of the GBP/USD currency pair. Based on my analysis, I expect to see a temporary bullish correction followed by a bearish move from the broken support level, ultimately leading to a decline towards the 1.16300 region.
It is important to note that my level of invalidation for this analysis is 1.2065, which means that if the price exceeds this level, my outlook would be deemed incorrect. Therefore, I suggest closely monitoring the 1.19000 region for a potential selling opportunity.
Thank you for your attention and good luck with your trading endeavors.

Bitcoin Enters Ending Diagonal Form. A Sharp Return to $18K OTWBitcoin looks to find more upside action as the Ending Diagonal pattern begins to take form. A completon of this pattern solidifies the anticipated, sharp return towards $18K. $12K and below have been off the table for weeks now. Support near $18K would confirm this theory.

Weekly Update: ES to 3800The last several weeks I have written about the move to the 3800 level and with the smaller chance of a direct move to the low 3,000 level right now. Clearly, there are people on both sides of the bullish/bearish equation and they’re not shy to share their support or disdain for my forecasts. I’m grateful for that, because that is what makes a market.
However, the price action is voting now and, although not there as of my writing this update, it appears my targets will be hit. I will not spend an outsized amount of time regurgitating my analysis. I will point out that events that encompass a super cycle retrace of gains, is a reversion to the mean of what brought us to this event.
Yes, I’m talking about inflation and the unprecedented hikes in interest rates. This boils down to a new way of thinking. The acceptance of higher interest rates is the main one. Inflation will ebb and flow, but interest rates are going far higher over the longer term than most think…and most will accept right now.

Possible breakout This could be a decent entry for a crypto bull, I don't trade cryptos at all.
Entry only if this price breaks out.


gold Elliott wave 1959 to 1804price first dropped vertical in wave A than it made flag correction patter in wave B than it made C ending diagonal pattern after cpi and other economic indicators
while top was made after fomc meeting when fed said deflation has been started and inflation will drop very quickly
but despite those less hawkish comments gold dropped which you can say insider trading before nfp or profit taking after November bottom
but latter that week price drop accelerated after strong 517k nfp and strong ISM pmi numbers
while our wave C decline came after cpi which proved opposite of what fed said in fomc speech
from top 1959 abc waves are correction to daily time frame trend from 1614 to 1959
we can say this is correction ending with ending diagonal pattern at 1804
if today's candle stick close green again than it will confirm bottom for gold
rsi divergence since low made by wave A
since we are near 1 year of fed first rate hike last year
so lag effect of fed aggressive rate hike since volcker will create slow down in global economy
reason to buy
because of lag effect nfp come down from 517k to 200k till December 2023
fed dual mandate will shift form inflation in 2022 to employment in 2023
global rate hike will pause with march month and later fed will pause with last hike in may fomc
rate pause will start evitable rate cut so again market pricing for rate cut = gold bullish again
to get out of recession central banks will again start easy monetary policy which can send gold upto $3000 so possible bottom after nov 4 low at 1620
correction to trend from 1614 to 1959 than new higher high beyond $2100
buy at 1804 with profit target first $2000 than $2100


Weekly Update: Market Analysis for the Intermediate TermI have long opined on how I believe the SPX/ES gets to my initial downside target of 3200 to high 2800 area.
This week I will dispense with the long-term warnings, and provide some intermediate context. This market is transitioning from “Buy the Dips” which has worked as a strategy for the better part of 2 decades to “Sell the Rips” . That is not to say our “Rips” will not have meat on the bone so to speak.
Let’s start with where we are now. We are currently in the middle of carving out a complex w-x-y pattern for our b-wave low in the area of 3772-3653. A breach of 3788 is a target I have been discussing in our trading room for a while now. Upon getting into my target box, I plan on designating the summer of 2023, as "The Summer of LOVE"...lol. This is where traders LOVE the long side once again. This could constitute a RIP that has a lot of MEAT on the bone. We're talking about a potential move up of 700-900 points.
I am speculating when I say, the sentiment would be during this rally that the FED has pivoted, inflation has moderated, "maybe scientists will determine that "Dogs and cats can live together in harmony " (Joke)...but this rally will only give way to a 3rd quarter to end of 2023 being dismal.
Why, you ask?
Because this is the last hurrah for "Buy the Dips" trading mentality. This gives way to despair, as we shed 30%-35% in short order.
I mean this sincerely when I say..."Stay Safe".
Best to all,
Chris
