Morning Update: ED on Shaky GroundThis morning the ES is declining just below the ideal spot to continue to support this ED pattern. Last night I advertently type 3990 for ED invalidation. Its 3980. 3980 represents the .884% retracement area and last fib retracement and a very uncommon area used by Elliottitions . This decline should ideally hold the .618% - .786% zone. Nonetheless, if for some reason price breaches 3980 today this ED count will be invalidated. So far, I believe this move down will hold at 4008-4009 which is the 1.0 extension of this decline from Friday's peak of 4109.25.
Below is a close up of the ED.
You can see after the 1-2, each subsequent retracement should land within the ideal area of the .50% and the .786% Fib Retracement. Our b of c of 3 landed right at the .618%. We are just below the .618% retracement now for our wave 4. The .786% resides at 3994, .884% at 3980. In my opinion, below the .786% by much is a big clue this will not complete as an ED. So this ED could be on shaky ground...but let's see if today provides further clues for tomorrow.
In the 4008-4009 I may open a small long position. I’ll update if I do.
Tomorrow's morning update will be my Thought Experiment for Fed Day. Thanks to all for participating last night.
Best to all,
Chris
IMPORTANT NOTE:
SOMETIME BETWEEN MID AND END OF FEBRUARY I WILL ONLY BE POSTING ONCE PER WEEK HERE ON TRADING VIEW. I WILL ONLY BE DOING WEEKEND UPDATES. THE MORNING, EVENING AND SPECIAL UPDATES YOU HAVE RECEIVED IN THE PAST WILL NO LONGER HAPPEN. AS I GET CLOSER TO CHANGING MY POSTING SCHEDULE ON TRADINGVIEW.COM I WILL UPDATE MY FOLLOWERS HERE.
Elliottwaveforecasts

Morning Update: I'm Raising a Little CashJudging by what I see in all tier-1 crypto I have decided to trim holdings. I know this is an about-face for most who read me. However I must emphasize, this is for risk management purposes more than anything ominous.
This morning I sold 3,000 SOL and 10,000 ADA. I still hold 4,000 SOL and 10,000 ADA. My holdings have doubled so these are mostly free trades for me.
Bitcoin
Solana
Above Main Chart
ADA
ETH
I will reiterate. I'm raising cash for risk management purposes. If my counts on tier-1 crypto are correct, I hope to re-deploy this capital at better prices. Lastly, many of the charts I track are coming into or have competed short to intermediate term tops. Therefore, I wish to take a wait and see approach to many things I follow and trade.
Best to all,
Chris
IMPORTANT NOTE:
SOMETIME BETWEEN MID AND END OF FEBRUARY I WILL ONLY BE POSTING ONCE PER WEEK HERE ON TRADING VIEW. I WILL ONLY BE DOING WEEKEND UPDATES. THE MORNING, EVENING AND SPECIAL UPDATES YOU HAVE RECEIVED IN THE PAST WILL NO LONGER HAPPEN. AS I GET CLOSER TO CHANGING MY POSTING SCHEDULE ON TRADINGVIEW.COM I WILL UPDATE MY FOLLOWERS HERE.

Evening Update: ED pattern is Filling In but is that reality?Today we got a little retrace and so far our Ending Diagonal pattern is intact. This would mean we should get one more high into the 4130-4170 area but well within the confines of the trendlines. If the ED is playing out then price should come into the .618% of the previous move up which would be 4018-4021 area and bounce to approximately the 4130-4170 area. Now, I have stated this before, but to be abundantly clear...we have enough waves in place to consider this retracement a full pattern.
Therefore, if price were to decline lower than 4018...and breach 3990 the ED is invalidated. If 3990 is breached on this move down then we look to 3901.75 to hold but in truth we stand a high chance of heading to the 3850 area, but more than likely sub 3788 becomes the ultimate destination.
One of my followers @Only_Losses wants to do a thought experiment for Fed Day. You guys know the drill ...I have to do what my followers request so if 25 replies to this evening update say "Do it" I will hang my neck out to dry...expose it to ridicule for the world to see. But only if at least 25 of you want to see me experience that pain...lol.
Best to all,
Chris

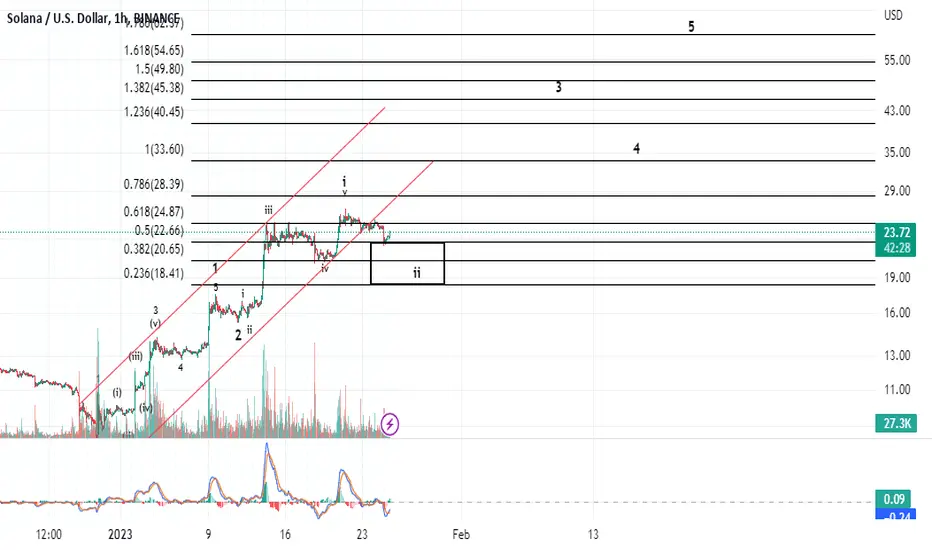
Special Update: Solana in Initial Topping ProcessI had some requests to update my Solana Count.
We have topped in our wave 1 as I now have a full pattern and retracing our c wave down in wave 2. To repeat, wave 2's can be deep or shallow so there's a large ideal wave 2 bottoming area. I do want to point out that our b of 2 did make a slightly higher high which could portend a flat for c of 2...so it is possible that wave 2 bottoms in the area of the low $22 range as a flat.
If my count is correct this retracement will present a major buying opportunity and to be frank, THE LAST. The reality is in the above count once price breaches the $27 level, we may head really fast into the $40's.
Think of this retrace as a "Sale on Solana".
Best to all,
Chris
IMPORTANT NOTE:
SOMETIME BETWEEN MID AND END OF FEBRUARY I WILL ONLY BE POSTING ONCE PER WEEK HERE ON TRADING VIEW. AFTER I WILL ONLY BE DOING WEEKEND UPDATES. THE MORNING, EVENING AND SPECIAL UPDATES YOU HAVE RECEIVED IN THE PAST WILL NO LONGER HAPPEN. AS I GET CLOSER TO CHANGING MY POSTING SCHEDULE ON TRADINGVIEW.COM I WILL UPDATE MY FOLLOWERS HERE.

Morning Update: Waking up to DownsideThis morning the ES futures are down -43.50 to 4040.75 or just over 1%. I would venture a guess this is repositioning on the heels on Fridays OPEX. This micro structure is underdetermined to be impulsive or corrective as of my morning update.
Below shows the difference.
I am still unclear as to what this larger pattern will ultimately conclude as. First thing is I am watching the micro pattern to see if we finish as an impulsive 5-wave pattern...which could still be an a-wave. As I stated over the weekend, and prior to that, this retrace will provide the answers we need. This pattern is officially busted below 3901.75. So we have a lot of room the chop around before we get answers. I would prefer price stay below 4072 (wave 1 low on micro chart) until it hits the 4007.50 level. That would provide downside overlap and continue to cloud the direction of price.
I'll update during the day if anything crazy happens which I do not anticipate.
PS: I am still short -25 4300 Feb EOM calls which are now profitable.
Best to all,
Chris


Special Weekend Update: Looking to the SPX for direction THIS IS A LONG POST SO IF YOURE NOT A BIG READER THIS IS YOUR WARNING:
Today I wanted to try something different and look at the cash market and go through all the scenarios objectively. For those traders who have ever wondered which chart is the chart to determine the direction of the SP500, the SPX cash market or the ES futures ?
It's the SPX cash market.
I have said many times previously that each chart should be considered its own story. The ES (in the above main chart) is a different instrument than the SPX.
Question: Then why even track the ES if our goal is to determine the direction of the SPX?
Answer: For me as a trader I trade ES futures, so why would I track the cash market?
It's a good question. But in truth I do not seek profits in the SPX. I primarily deal in futures options. This post is not about why I choose to do that...that's a conversation for another time. However, when I am selling a strike price and choosing what expiration cycle, the ES is going to provide me the information I need to make those decisions. However, I do think it's a relevant endeavor to check in on the cash market chart to see if it gives me clues or insight into the ES chart. The last thing on this subject I'll share is the ES chart is far more complex. I would even go as far as to say it's twice as complicated as the cash market chart. The overnights provide complex patterns in a low volume environment that as an analyst sometimes can make things very challenging to analyze. But let's dive into the cash market and see what clues, if any, we can ascertain. This post supposes NO BIASES. Bullish or Bearish...I'm looking at all the potential scenarios.
We start from the October Lows:
BLUE PATHWAY
Highlighted in Blue I can count a leading diagonal off the October lows. Now a leading diagonal is a motive wave, which means the prevailing trend is now up, and we should be able to count a 5-wave structure into its ultimate conclusion. If the blue count is correct, then this supposes the October lows could be the bottom for the bear market. Why is that? Because we look for corrective patterns to end and reverse-trend upon observing the developments of motive waves. Motive waves are confined to impulsive 5-wave patterns and diagonals. Nonetheless, I can count a leading diagonal in 5 overlapping waves, followed by corrective price action in a 3-wave structure equating to a wave 2. Currently I would state that price now appears to be in its first subdivision wave 3 (i of 3)...with one caveat, we should be targeting the .618% to .786% fib extension. The .618% extension resides at 4140.81. However, price has yet to breach the 4100 level. This level in the cash market has been rejected twice before. So, if price can get above the 4100 level and stay there...the blue pathway is intact and must not be ignored.
Blue Pathway Conclusion: I would say the next week should provide enough price action to breach the 4100 level and see some sort of reaction to the .618% area of 4140.81. If price does get as high as the 4140.81 level, I think it’s time to adopt a more bullish perspective. However, under the blue pathway if at any time price breaches 3764 then this pattern invalidated. Now 3764 is a long way away from where we are now...so you see price can decline by a lot and still not invalidate the bottom is in thesis. Therefore, the blue pathway has a lot going for it as of now. My issues with the blue pathway are this all starts with a diagonal. Diagonals are notoriously unreliable patterns because they can be interpreted as something else as I will explain next.
BLACK PATHWAY
Highlighted in Black
The black pathway, in my opinion, is a safer pathway for traders to adopt because it doesn’t suppose we are impulsive. You see under the previously explained blue pathway, and impulsive considering the leading diagonal start would point to the possibility of ending as high as minimum target of 4846 and as high as 5349.75. That’s new highs. So, to adopt that analysis and not consider the black pathway which could reach only 4220.39 to 4372.01. The risk here is waiting for price to reconcile higher (blue count), only to find price at NEW LOWS and not new highs. As a trader, price must prove its intentions to me every step throughout the structure. I have received many direct messages criticizing me about the fact that I typically will feature 2, and on occasion 3 potential outcomes on a chart. I have no idea why readers think I should tell them the future of where price will go and give them one outcome. People who read my posts, or who choose to follow me, get my personal trading strategy annotated on a chart who is seeking to profit from his analysis...not provide readers with a money back guarantee. Formulating a trading strategy around the black pathway (which could finish around 4200-4400) is infinitely less dangerous than the previous blue pathway. However, you’ll notice the two pathways follow an initial similar path.
Black Pathway Conclusion: Clearly, I favor the black over the blue pathway mainly for risk management purposes as price approaches the 4200-4400. I have no problem with the black pathway. I have only a slight concern that the “b” wave bottom struck on 12/22 was too quick to be all of the b-wave considering the length of the previous “a” wave. There is no Elliott Wave rule that substantiates my concerns with respect to duration. Let’s just say my intuition is this area will be revisited before going higher. Now my concerns will be alleviated if price breaches 4100 and stays above it. We have come into this area (the area we are now) twice before. If three times is a charm...prove it.
GREEN PATHWAY
Highlighted in GREEN ARROWS
Now, as an analyst, the green pathway solves all my concerns. It fits within the rules of EWT, and It solves not only the issue I have with duration, it solves the overlap issues I have with the leading diagonal (how we started) and the overlapping issues afterwards. It also catches most of the traders off guard as witnessed in the put/call ratio. I will acknowledge sentiment was extremely bearish in October and a retrace of some magnitude was warranted and we’re getting that now. But recently I have taken to listening to the live CNBC stream on my phone while in the office as back ground noise. I noticed the other day; I get the sense from the CNBC guests that sentiment is bullish now, or at least getting more bullish. I see that bullish (or at least constructive) view show up in the fact that traders, by and large, are not too protected from downside. The P/C ratio in the ES on Friday got down to 1.3 that means slightly more traders are buying puts than calls. The normal P/C ratio in the ES is around 1.75-2.0 during uptrends.
Green Pathway Conclusion: I favor this pathway because it solves the time duration between the a-wave and the b-wave. It also reconciles why we have so much overlap in price.
In summary, I am unsure which of the above pathways price will take. When a trader is analyzing corrective price actions there are many forces at play. These forces push, pull and tug on prices in both directions. But in all the above cases, I am expecting a retrace. Whether that retrace is small (as in Blue and Black) or deep (as in Green)...WE SHOULD BE RETRACING SOON. This retrace, and what price does afterwards will provide a huge opportunity for profits.
Let’s not get married to one pathway over another...LET’S LET PRICE PROVE Its INTENTIONS...AND THEN BE PREPARED TO PROFIT.
Best to all,
Chris

Weekend Update: Bond yields to move higherI received a request to update this chart. Thank you @Braeden2
The US30Y held it's wave 4 bottom in the .382% area of wave 3. The last time I posted this chart we had not yet embarked on our 5-wave pattern higher in what I'm counting as a wave 5. Today we see we have a wave 1 and 2 in place. Additionally, you'll notice how our recent wave 4 structure alternates with our previous wave 2 structure. We should have been expecting wave 4 to be deep and quick, were as our wave appears shallow and long. That is precisely what occurred.
From here I would expect within the next month to begin to clearly subdivide in our wave 3 of 5 and target yields in the 4.294% to 4.529%. This would be for our wave 3. Upon that happening we'll need a 4 and then the ultimate destination for this structure is in the target box for wave 5.
I've enjoyed the ongoing conversations in Trader-World about who is right?...The bond market or the Fed? I don't follow bonds closely, nor have I ever traded them, therefore I don't what constitutes victory for bonds or The Fed.
But I will pose this question to those reading this...what does 4.895% yield on the 30y mean? Who wins, Bonds, The Fed, or both?
Best to all,
Chris

Weekend Update: Price still unable to provide clear directionLet me be clear. Sometimes we feel very confident about the market pattern we're trading and on other occasions we don't. For me, this would be the latter. That's why I primarily sell OTM futures options.
Today, we didn't get any definitive clues. I'm sure this choppy action is like death by a thousand cuts for traders on either side of the market. But I have to stand pat in the notion that if this was the pattern set up where the market was going to rally to 4300-4500 area, this would be a C-wave. This would also be mature enough for us to see impulsive action higher. We do not have any impulsivity whatsoever. I believe the market is trying to tell us something. Unfortunately when in the midst of both B-waves and 4th waves, a complex pattern will not reveal what it was until it's in the rearview mirror.
I will acknowledge it's both difficult and frustrating to try to trade for profit in this environment. I am still under the impression we are in an ED for our b of B. Whether that ED is limited to the end of this pattern or the entirety of this pattern (Red Trendlines is ED at the end of this pattern, where as Black trendlines represent the entirety of the pattern) I believe where in a diagonal. Nonetheless, I have Fibonacci Confluence at the 4018 area. Also based on the various micro pattern extensions I have located a PRICE PIVOT target box. It is here where price will have to decide. Break above the black pivot to the upside and we should see 4300, come into and retrace and break below the red pivot and we should see 3875-3840.
Now some could argue this diagonal is a leading diagonal. Ok, I won't argue too much against that, but my point is whether leading or ending, a retrace of a portion, or the whole pattern, is warranted. However, the pivot areas will answer that for us.
So I'm looking for a retrace to get a sense of what we're dealing with. In the meantime I'll be patient. I will advise traders do the same. Taking outright longs or shorts in such choppy action could cause losses, so please know your stops.
Best to all,
Chris

Moring Update: Are we in an ending diagonal?Last night I had a social event to attend. A lot of market talk with different opinions...some very dire, some very rosy. I'm thinking to myself the market sure has people guessing right now. I had some DM's asking about being in other patterns that suggest we're moving higher...no doubt because they've been exposed to other analysis. Me on the other hand, I don't follow anyone. I simply looks at the charts.
This pattern looks like an ending diagonal, it fits with the rules of an ending diagonal, but as I have said 100 times prior...it's the way this pattern started that has me thinking we're something complex and it's giving many people fits.
If this is not an ending as I outline above then price should be skyrocketing higher. The market has had a could opportunities to do so and has failed to push impulsively higher. Again, I do not want to get married to analysis if price proves me wrong, and I certainly do not want to loose hard earned profits...but price has a lot to prove.
Above 4090 and I'm starting to think this is something else. But many elliottitions look at the longer duration charts. I happen to believe (as Elliott said) that each smaller time frame pattern is a fractal
of the larger pattern. They're Self-Similar.
Here's a 1 minute chart below. I don't label the smaller time fractals but the overlap makes it hard for me to think we're breaking out. This is how we've traded since December.
The overlap even shows on the smallest of timeframes. Nonetheless, let's see if price can break above 4090 today to get me off this ending diagonal and get some clues as to what we're in. In the absence of that, I'm expecting in the next several days to week, for price to be heading back down into the 3800's.
Best to all,
Chris

Morning Update: That's a Clean 5-waves up...now what?Bitcoin has rallied nicely off it's November bottom completing an impulsive 5-wave pattern. That's the good news. What's next? We should expect a retrace. If we retrace correctively in an ABC pattern into the target box, then impulsively breach the wave 1 high recently struck, Bitcoin could breach the $26,000 giving us our first clue we may have bottomed.
Once we breach the wave 1 (if wave 1 is done) breaching $26,000 should not be a problem.
Now can we extend in our wave 5 of larger wave 1...sure. What is important is we have a full pattern...so naturally we should be expecting a retrace. Again, I will repeat, we expecting a wave 2. Wave 2's can be shallow or deep. They are by nature unpredictable...hence the large target box.
Best to all,
Chris

BTCUSDT Elliott Wave - Current Corrective Wave StageCurrent in scope Elliott Wave Impulse Waves 1 to 5. Currently within the Corrective Wave.
Used Trend Based Fib Extension Tool to determine the bottom retracement levels of the Corrective Wave A, drawing from 1st High to Low to 2nd High on a 90 minute time frame.
- 1st Highs drawn from Wave 5 high.
- The low being 22,750 and yet to understand why that level at time of posting but this the magic low used (it is a daily support and a level from which the price moved to make Wave 5 high).
- The 2nd Highs drawn to the highest high within the range below Wave 5 high
Interesting, using Trend Based Fib Extension, plotting the 1st high, that if you work the way up from left to right, choosing the lower highs on a 90 minute time frame, pulling the next plot to 22,750 lows, then lastly to high within range, playing with this tool draws perfect fibs that correlate to daily Point of Control (POC) levels.
I've chosen to use the Fib at 22,750 because when drawing the retracement level for Corrective Wave B. If using 25,530, the price target is below Impulse Wave 3, which does not fit the rule for Elliott Wave Theory.
-To draw target Corrective Wave B, using the Trend Based Fib Extension, (Low to high to low), drawn from Corrective Wave A at 22,7k to the High Impulse Wave 5 back down to Wave A at 22,7k giving a possible Corrective Wave B target to the upside of 23,4k. Another important level to be aware of for Wave B target is approximately 22,600ish which is a Naked Point of Control (NPOC)
-To draw the Corrective Wave C target, a bit uncertain at time of writing. The last of which is more technical. Using the Trend Based Fib Tool, (high to low to high) from Wave 5, to Wave 4, to the Corrective Wave A, with a target to the downside of approximately 21,750 and daily support level. (at the time of publishing I've 22,129 chosen as it seems a strong daily support).
Other point of interest. I've been using Exocharts TPO 1 hourly. Which has been useful for spotting Naked Point of Controls (NPOC), and as well as using Order Flow to determine market movements. Found that although some support levels are well respected. NPOCS on hourly TPO seem to be hit when on a down trend, and can be a good level of support.
Please feel free to correct me n any mistakes you make think I have made. Always happy to have positive criticism and useful feedback. Play around with the Trend Based Fib extension tool, the levels and confluence with time frame support and POC's are amazing!

Trade Alert: Sell -25 Feb 2023 EOM 4300 calls at $7Raised $8,679 in Premium for next months P&L.
Here's what changed for me today.
Yesterday I said if price breached 4055 I need to see it take out the red trend line. I've been seeing the beginnings of an ending diagonal for a while. The overlap in the beginning when I said these patterns are not going to put us in jeopardy of price getting away from us. Nonetheless price has rallied.
I was counting this as a 1-2, i-ii this morning. Wave iii of 3 is the strongest portion of a move. THIS MARKET SHOULD BE MOVING HIGHER AGGRESSIVELY...It's not. It's now overlapping again where it should be testing 4080-4090 and maybe even tagging 4100. Another thing weighing on my mind is so many charts I track, crypto included, are coming into full patterns off their lows needing a retrace. Sorry to switch gears so fast, but this chart should be showing signs of impulsivity today...and it's not.
Therefore, I have opened up an OTM money short call position mainly to hedge what I've been waiting for and that is a couple hundred point decline to open a short put position in size. If at anytime price breaks above the ENDING DIAGONAL TRENDLINES I'LL RE-EVALUATE by taking an outright long position.
This is a risky trade. I am not advocating shorting the market unless price continues to overlap as outlined above. Ending Diagonals will retrace to their origins. Therefore if confirmed we should decline in purple to 3840-3875 area minimum...and that could just be the "a" wave (in Black).
PS: This post will serve as my evening update as I have plans this evening. I'll answer DMs and Comments to this post.
Best to all,
Chris

Morning Update: Benefit of the Doubt to BLACKI've discussed in the past about technicians and elliotitions getting married to analysis. This is easy to do even for the most experienced analysts. Just the psychology of bottoming and topping turning points Elliott mused that at turning points, traders can't let go of their attachments to the previous trend and before they realize that trend ended, the new trend is well on it's way.
Price has been stubborn to retrace any of it's hard fought gains since the October bottom. Therefore I have to give my black count the benefit of the doubt. In the black count we may move as high as 4080-4090 for i of 3. Purple & Green have little room if any to rally before we retrace hard...but what is actionable trading information is in either case we should expect a retrace of some proportion. Purple and Green counts require a C wave to complete these patterns. C wave can be swift so we look to the structure to determine what count we're in. Purple can complete anywhere in the gray target box...but below 3840 which would be a flat, I have to adopt Green as my primary. Green supposes we're headed to mid 3700 to high 3600's. Now that I have given you the parameters, and I've stated I am giving the black count the benefit of the doubt...we watch to see what unfolds over the course of the next week.
If we get up into the 4080-4090 area I will reopen a Jan EOM 4125-4150 short call position. If we immediately retrace (as in purple/green), I plan to do nothing until I can ascertain a bottoming pattern. I do not believe that will occur in the next couple days.
Best to all,
Chris

Morning Update: YOU ARE HEREAs we trade the day to day...the micro machinations of the SPX and ES Futures, I want to put into context where we are within the overall bigger picture. Having completed our Super Cycle wave (III) and begun to retrace in our SC wave (IV) ...you can barely even see the current decline from the high of January 2022.
Within this Super Cycle wave (IV), we are simply working on completing our b of larger a to come sometime latter 2023-2024. That's right, we haven't even completed a cycle A wave yet. The purple box shows our alternation with Super Cycle Wave (II) which was very deep and quick. That purple box would represent the current magnitude of the SC wave (II) juxtaposed over current prices. Our wave (IV) will alternate and be long ( 2 Decades to complete ) and shallow ( completing at the 2.382% to as low as the 2.0% Fib Support Area ).
Many of you will disagree with this chart. I understand the skepticism. However, cycles being what they are, this chart stands a high probability of becoming a reality... whether we like it or not . SO, as we carve out our profits day to day....remember in the grand scheme of things....
.... WHERE YOU ARE ON THE LONG TERM CHART!
Best to all,
Chris

Evening Update: Today I'm grateful I have Trading RulesThis morning as we were headed towards the lows I decided to close all my short call positions and go flat. Am I bullish? No Am I bearish? No. The uncertainty, with so many counts on the chart, some of which we were coming into the target box, caused me to go flat. I share this with you because as you analyze markets, I want you to trust your intuition. Most of all, when you can look as a chart and say, I'm unclear on the direction....get flat.
I'm still flat as of writing this update.
I mentioned in an update earlier that when price breaches 4055, we're going to 4300. I want to add 1 small caveat. The big red trendline. I want to see price breach 4055 and the red line.
Let me explain, when I get into the 3 min fractals this looks like an ABC a-wave off the lows of today. I know it looks impulsive but with the price action I have now it looks like a 5, 3, 5 right into the 1.0.
Therefore I'm still torn between purple and black. #PRICEPROVEIT
Best to all,
Chris

Near Protocol Bearish IdeaThere's a bearish divergence confirmation on the 4hr TF. Hopefully price hits the entry target. Short term bearish idea. Trade with caution

Trade Alert: I prefer to be flatIn an abundance of caution and since I have a bottoming count in the black wave 2, I've decided to take my profits off the table. Therefore I have closed my Jan EOM 4100 Calls in which I kept over 80% of the original premium raised and my newly opened 4180 Feb EOM calls in which I kept 35% of the original premium raise for a total amount of $15,231 in premium income for January.
I want to be clear....this is not to say I'm bullish. This is a risk management decision for me.
Best to all,
Chris

Morning Update: Solana is consolidating in wave ii of 3I have several DM's to update my followers on Solana...so here it is.
Solana is now consolidating below it's recent high of $26.55 in what I'm counting as it's wave ii of 3. The range for this wave ii can be as deep as $18.41. However price cannot breach $15.24 which is where I'm counting the start of wave i. I mention that only to provide context. I do not post every day on Solana, and other crypto currencies I track because, Unlike the SP500 futures, the patterns don't warrant daily updates. Judging by the chart above I will post again if price breaks out, or threatens my count by approaching the $15.24 area. Nonetheless, I expect the next time price breaches $26.55 it will take off as we will be in a wave 3.
Wave 3's are noticeable. They are the strongest portion of an impulsive wave. Therefore above $26.55 I do not anticipate price hanging out and just meandering. I expect the "Boom"!
Wave 3 should conclude the range of $45.38 to as high as $54.65 is extending. Funny, when I just wrote the number $54.65 I realize with 7,000 SOL down in the $12 average price area...that's a nice chunk of change. But rather than get ahead of myself...lets focus on the immediate pattern and allow price to continue to prove the count is correct as we progress through this impulsive rally.
Best to all,
Chris
Morning Update: Black wave 2 3950-3960We're retracing off of yesterday's close. Since all of my counts require a retrace it will interesting to see which ones are invalidated. I stated a couple weeks back that the bottom we strike here within the this pattern weather it's a wave 2 of c or b-wave, is a bottom to buy for a nice rally to 4300-4500. From time to time I do this so I thought it may be a time to check under the hood of the SPX.
I do not track stocks so I have no long-term EW counts in place....so the below charts are very rudimentary.
Looking at Microsoft, I could debate Microsoft the stock has a 5-wave move up off the low, and a 3-wave move down for a wave 2. This is what you want to see in a bottom. However, price last night hit the .764 retracement post earnings, and but until breach the wave 1 high of approximately $263 we simple have no conclusive clue that the bottom in November of $213 is the bottom. Additionally, breaching the 263 high is just a first clue. So, MSFT has a lot of work to do. I would say the jury is out on MSFT striking a bottom.
Looking at Amazon,
Unlike MSFT, Amazon has positive divergence into its last low, but the stock has not completed 5-up off the bottom. Unlike MSFT that has a full 1-2 in place. Maybe AMZN will pop after its earnings, but it still doesn’t explain why it’s so far behind in the pattern visive MSFT.
MSFT and AMZN are the largest components of the SPX, but these 2 stocks do not do the entirety of the SPX justice. Nonetheless, in looking at the largest 8% of the SPX components...if I was to sum up the SPX/ES charts...it’s only slightly negative. Yes, there are some constructive aspects of the above patterns...but nothing conclusive. Does it signal a constructive rally of some magnitude...You’ll get no argue from me on that conclusion.
If we retrace into the 3950-3960 area today, it's important to note that the next time price breach 4055...we're headed to 4300.
Best to all,
Chris

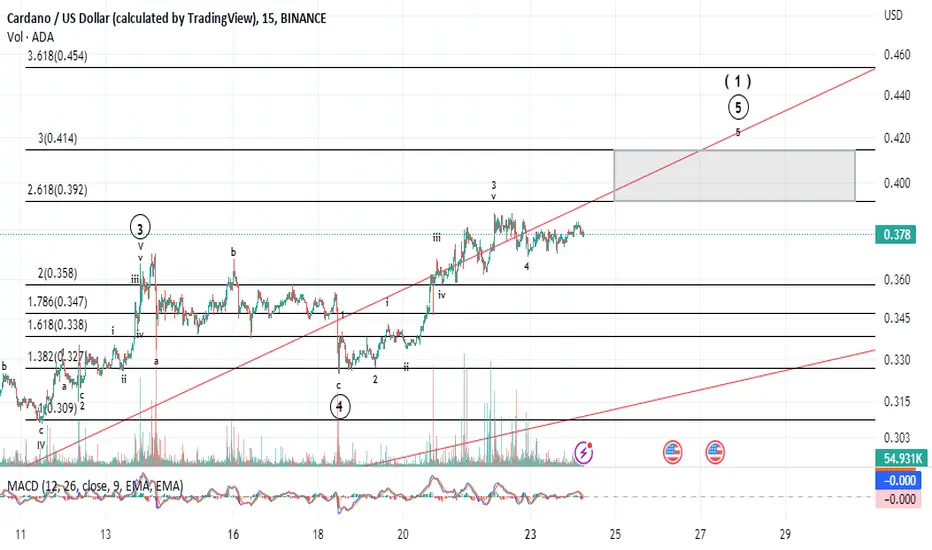
Morning Update: OMH for ADA should do itADA has extended nicely off the bottom. However we are coming into the 2.618 and 3.0 Fib Extension areas. Here I would expect a reaction that could start our retracement in wave 2. Again, I'll reiterate...wave 2's can be shallow, so to get cute and try to sell with the intention of buying back lower is risky.
I got a lot of DM's regarding ADA asking will it come back down? I don't answer them. I am not in the trader counseling business. Buying and selling is your decision. If you sell ADA in this area, and we get a long consolidation or a shallow retrace followed by a "rip your face off rally above $.60"...please spare me the DM's. I thank you in advance...lol.
Best to all,
Chris
Morning Update: You’ve Got My Attention If you’ve traded the ES and the indices as a whole for any length of time you’ve heard the phrases “ The Markets is Climbing a Wall of Worry ”, or “ The Most Hated Rally ”. This signifies traders are not positioned to take advantage of a rally. Clearly sentiment was more negative than the market had intentions. I have been on the side of expecting lower prices. I’m a huge fan of the rally but only after prices retreated into the 3800’s first . However, I do not want to be a hater of a rally that leaves me behind, or worst, catches me short.
Therefore, I wanted to provide my playbook as to not be caught off guard. All of my counts require some downside retrace of small to large magnitude. If price decides to trade above yesterday’s high...I may close all short calls. My January calls are almost worthless, but the position I opened yesterday will cause me concern because that doesn’t expire till end of February.
In the cash market, this looks much cleaner. I would expect price to get a deep retrace or reconcile as an ABC zig zag down in the 3700’s.
The ES always runs the risk of containing noise due to the lower liquidity of the overnights. Sometimes it will give you signals as to how the cash market will react, sometimes it confuses. I’m undecided as to whether it’s confusing noise, or it’s signaling to me the market intends to go higher and not retrace like my analysis shows.
If ES trades above yesterday’s high. I may close out all short call positions. We have already extended to the 3.618% Fib Area...and I’m not going to give upside price advances much room before I pull the plug on shorting. Keep in mind, these are not outright short positions in the ES. If you’re outright short the ES right now, you’re giving yourself NO ROOM FOR ERROR. Therefore, have stops in place.
I’ll be frank...if the market continues to move higher from here...I’ll hate the rally. Yes, I’ll be one of those traders. But will I allow it to cause losses....NOT ON YOUR LIFE.
Suffice to say, the bulls have my attention now.
Best to all,
Chris

Evening Update: Things got complicated todayIf I had a $100 dollars every time I mentioned here on trading view that I spend 90% of my time analyzing and 10% of my trading I'd have a nice chuck of change. But markets are NOT linear, and that's why when I trade, I try to give myself the best opportunity for a profit.
Let's discuss the (ES) chart first, then I want to juxtapose my analysis on the cash market (SPX).
See Below Micro chart of the (ES).
With price breaching the 4017 level, this rally off 3901.75 appearing impulsive in nature has surpassed the 2.618% Fib Level (Blue arrow and Circle). The 2.618% is usually good to halt most impulsive structures, even the ones that extend. However we blew right through that and even went over the previous local high of 4035. That presents us with several scenarios now. I must confess I'm split equally on each potential and therefore I do not have a primary pathway as of my writing this update.
Black Count
The black count supposes we bottomed in minor (b of larger "b") at 3901.75 last week. Under the black count we are now starting to carve out our initial subdivisions of our c-wave higher into the 4300-4530 area. To confirm black is the highest probability outcome and my primary pathway, price has to retrace in a wave 2 of c and should hold 3976-3934. Upon retracing to this area, I need to see an explosive rally that first breaches 4180 and ultimately goes to 4300-4530 area.
Purple Count
For the purple count to be a b-wave flat we need to see retrace but must hold 3841, (ideally 3912-3841) worst case scenario. Anything below 3841 and the newly added green count becomes the most viable option. Corrective Flats are not rare, but they are a pattern you don't certainly see that often. If price holds those regions, I would expect to see in the same manner as Black to the same area of the 4300-4530 region.
Green Count
The green count supposes our B wave has not concluded at all. I have stated for weeks that the overlapping manner of this pattern off the 4180 spike and reversal on December 13th was not a pattern in jeopardy of blasting off to the upside or the start of a new bullish trend. I still believe that. From a trader sentiment standpoint there's just too much indecision within that pattern to be a new bull run. Therefore Green is confirmed if price gets below 3841 (where both black and purple become invalidated or low probability). The green count reconciles low 3700 area for a standard "abc zig zag pattern".
The SPX still looks like an ABC down to much further levels. That is why I believe the market is very confused as to what it wants to do (when I compare the ES to the Cash Market). I would assume in the days to come it's intentions will be known.
Today I shorted -10 Feb EOM 4180 calls at $23 for $11,471 in Premium. Those calls went as high as $32 which gave me a 39.13% trade drawdown. This is not the area I feel like most my trades go. Short OTM calls at the 2.618% fib extension level is a "top tick" 9.9 out of 10 times. I'm still in this trade and will hold on for a retrace in either of the counts above and re-evaluate my position then. If anyone has any questions or comments please leave them below and I'll answer them all.
Best to all,
Chris
