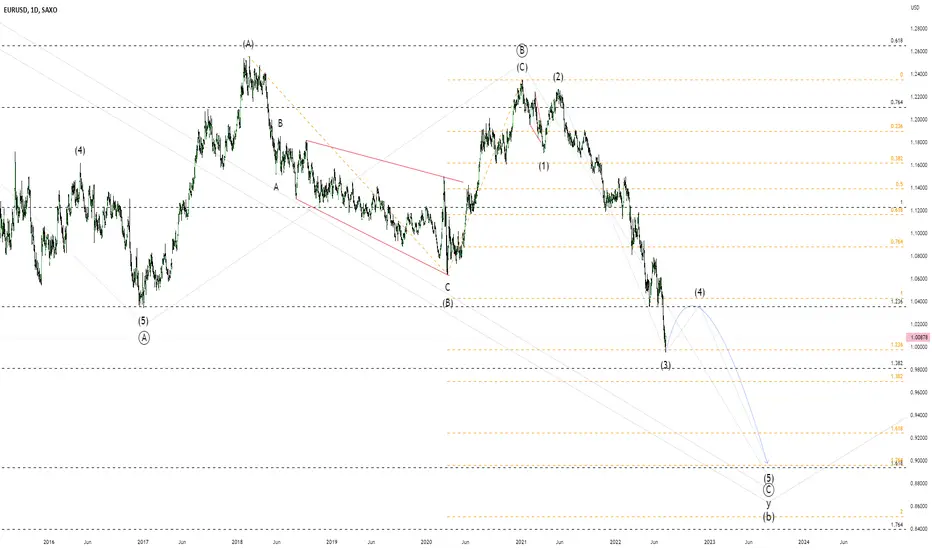
My biasThis my bias on #EURUSD... I will be monitoring the pair to see if price follows my projection for me to make an entry... I hope it helps, please drop a like, comment and follow me for more!!
Elliottwaveforecasts

ABC correction of ETHUSDHi
We had ending diagonal for 5th wave at the end of first elliot wave. Now ETH correct first wave by zigzag correction. It seems that the A wave is ended and B wave is started.
Have good trade.
Yours

Crude Oil (1D) Correction probably finished, Ready for Rally ? Hello Traders,
Seems like Crude oil formed amazing 1:1 (A:C) Corrective pattern as setup for next Bullish Rally.
So there could be several more months with prices and gains for miners. Also it could cause increase of Inflation and Electricity prices.
I´m staying out of this market, because I really lack experience how to play it (Any advice in comments is highly appreciated).
My best guess is to find some undervalued Oil Miners if its still possible. (well played with OXY Mr. Buffet)...
Enjoy the markets and stay green ;)

$OP Want to reach 5$ ? Let's GOOO ! 🔥$OP done making Waves 1, maybe this area will be a good for Waves 2 corrective. Just wait till Closing Candle and Confirmation. Hope this Analysis can be true!
Area : 1.080 - 1.111 Buying zone
SL : 0.777

Could I have cracked a code! US30, DJIA, Dow JonesIf we start at (1) Jan 5th All time high and move 51 days down to a new low to Feb. 24th 2022 that would be the 1st leg down. Then take (2) Feb. 24 2022 up 57 days to April 21st 2022 that would be a new lower high. Then April 21st 2022 58 days down to a new lower low to (3)June 17th a new lower low, and finally back up to (4) 60 days up to 8/16/2022. If this is the peak of the (4th) part of the wave, we could see a down turn from here to the 5th and final leg down to the Dow being approx. 26,811 in 60 days OCT 17th 2022.Then a possible bounce back up from this market correction.

Expecting na final C wave to complete the whole correctionUsing Elliot wave I will be uploading a multi-timeframe analysis on this pair to show why I think it's a move up coming up next.. enjoy


XAUUSD With Elliott WavePlan 1:
We are in the ABC correction.
Consider going short when wave B ends at 50-61.8 wave A.
You refer to this trading idea!
This is not investment advice.
Make your account risk management the safest!

GBPUSD Long With Elliott WaveFlat seems to have ended.
Continue the uptrend to wave C.
You may consider Buy with a reasonable Stoploss.
You refer to this idea of mine, but this is not investment advice!

ETHUSD in next month Hi
A prediction of ETHUSD is done by elliot wave analysis.
Based on this idea, we are at the end of third wave of 5th wave of first impulse wave. On this situation, This crypto can be correct to 1810-1850 and then raise to 2100-2150. Then the correction of wave will be began to1560-1640.
Have a good trade
Yours

Good Sell position in goldHi
We are in 5th wave of ending diagonal in Elliott wave analysis. A good sell position is ready to catch profit. I predict that flat or regtangular correction can be occurred.
Have a good trade
Yours

Nasdaq New Wave CountScrapped the old count and onto the next most probable count. We are still completing the A Wave of Primary degree within a Cycle wave 4. This A wave has developed into an expanding triangle and is within a 5th wave of E, hence closing up to completion. If this is an ABC correction B wave will make new all time highs. This is because the closest alternative to an ABCDE triangle formation would be a wave 1 leading diagonal and since wave 2 can't retrace more than 100% of wave 1, any correction falling short of all time highs should be considered a wave 2 of Primary degree within a Cycle degree ABC wave 4 pattern.

EURUSD. Weekly range. On a weekly interval, a major correction develops inside wave c in the form of a downward triple zigzag. By 2022 I expect completion of wave (A) of and upward correction in wave (B) of .

USDCAD bearishYou may open a position on a CMP or waiting for a little upside pullback before falling

Bitcoin Elliott Wave Intermediate WXY in Primary 4As an alternative to the ABC count bitcoin could also be in a combination wave from 69k which is evidenced by the price structure that appears as 3-3-3 in each wave. In this pattern, wave Y should not exceed the 1.618 of intermediate (W) which is around 11,000 or so.
The main difference between the WXY and ABC counts is the maximum depth of the correction. ABC allows for a lower wave 4 end point because wave C can be the 1.618 or greater of AB.

BTC Elliott Wave Long Term View As far as I know, the Brave New Coin Liquid Index (BLX) has the most complete chart of BTC. Looking at the 1M chart, we can observe that BTC halving events appear to always kick off wave 3 impulses. In the first halving, we can see a blow off top in the minor 5 of intermediate (3). The second halving, takes in minor 1 of intermediate (3) and the third halving also takes place during minor 1 of an intermediate (3). Most counts, regardless of the Elliott Wave pattern interpreted by the Elliotician puts us in a wave (4) either in an expanding flat or a WXY. Both the triangle in (4) and running flat with a leading diagonal in (1) of ((5)) ideas have been invalidated. There are arguments for cycle I being complete but looking at the duration in time of each wave it feels unlikely that this would be the case. Right now, the WXY in intermediate (4) of primary ((5)) is my main count with either the expanding flat or the cycle 1 complete counts being my alternates. As such, I think we have a strong chance of dropping down to around the $17,000-$18,000 before the bull run towards $100,000 begins (123.6-161.8 of the inverse of intermediate (3) and (4)).

EURAUD Breaking Trendline Support-Bearish Ellliott Wave count EURAUD is still bearish, it's coming down in five waves, below the support line on a daily channel which can put more weakness in play for weeks ahead. However, be aware of a rally, which can be in three waves back to 1.5-1.5100 before weakness resumes. Also, keep an eye on tocks; any further gains can be supportive for the AUD in risk-on envroment traders will get more interested in AUD rather than EUR. It has a lot to do with rates, inflation that is much lower in Australia, and then of course with the Ukraine-Russia situation.

Elliott Wave TD D-Wave Bearish Trend in EURUSDOANDA:EURUSD
Elliott Wave & TD D-Wave The perfect combination.
There was an Bull trend in wave C and a Bear trend in wave 3. as a result, wave 3 In a downtrend TDDWAVE, according to the counting order of "TDDWAVE", there can still be a downtrend as wave 3 normally moves like crazy, so it continues the downtrend. Expect it to go down to the level of 1 – 0.995 following the support tool.

Elliot Wave on Bitcoin Bitcoin entered a distribution zone(down flag formation) again. It has a higher chance of breakout down again to complete an Elliot Wave Trend.
(Not investment advice)


Resistance | Lower fifth wave | $2000On 4H TF
BINANCE:ETHUSDT is in the impulse wave and it's been the lower fifth wave with target around 2000
After complete, it might be pullback to 1430.
Let's wait and see