XLE update - 12/05/2022upside focus remains in wave (3), expecting more upside near 109.58 (wave (3) = 2.618 * wave (1)).
Elliottwaveforecasts

MSFT: Bears Have Taken Control Over BullsMSFT has accomplished the corrective wave (b) and started falling for wave (c) of wave (4).
Traders can expect the following targets: 289 - 272 - 265 for wave (c).
Here, 273 is the Fibonacci level of 50% of the wave. This level will act as a crucial level.
An uptrend is only possible after the breakout of the parallel channel . As per the wave principle, a new trend can unfold above/below wave B of the previous correction.


RUT update - 28/04/2022upside focus remains, expecting a strong move higher in wave (3), critical support at 0.776

TSLA update - 11/05/2022expecting more downside lower than 666 to complete wave 5 of (A) of ((4)), critical level at 1149.91


SILVER update - 11/05/2022the move lower than 21.433 will confirm that wave ((Y)) is in play, first support level coming at 19.00$, critical level at 26.215.

BTC/USD Triangle in play? variation #2As I've mentioned on my stream, a breakdown below the current wave C low at 32933.33 just invalidates that particular triangle. There is the possibility that another triangle could be printing in that scenario as shown in this chart. Wave C could still be in progress. However, it would need to reverse prior to the wave A support at 28800. Breaking down below that level will invalidate all the triangle scenarios.
This only becomes possible if price breaks down below 32933.33.

Bitcoin 💵💵💵😊💵💵💵Bitcoin just moved exactly as we predicted based on our previous post 👇
So far we are in a correction of wave (1) and we're expecting bears to be in control all the way down to 19156 zone. Then bulls will definitely get on board to ride the all the way up 121652..
Please, don't miss the next coming bulls move, as this will the longest bulls move after wave 2 correction is completed.
Remember this , Bulls need more gas to take control of wave 3.
Wishing you all the best...💵💵💵😊💵💵💵

Predicting the stock market crash.In 2019, I predicted the stock market crash with the link here:
Then, in Jan 2022, I predicted the drop on the top of SPX500 ,
Now, I am updating on it that it will continue to drop and sticking to the bias as monthly closing bearish .
I would be waiting to buy stocks when it bottom !

ETH/USD Triangle in play?Wyckoff and Elliott Wave analysis signals we may be seeing a triangle completing. This is the chart I've been discussing for quite a while in various public live streams on YouTube and Twitter.

Another sell opportunity on btcHi
We are In ending diagonal, yet.
Modification of previous idea, is here.
Have good trade

Great buy opportunity for nikkeiHi
In my elliott analysis, we are in second wave and the third (and very profitable wave) will be started soon.
Two target is shown in chart by fibo and resistance line.
Please like my idea if you agree with it.
Have good trade
Yours

Dax's buy opportunityHi
According my Elliot analysis, we are in starting of third wave for Dax index. This impulse wave can increase to 14730-14950 at the first state.
Have good trade
Yours

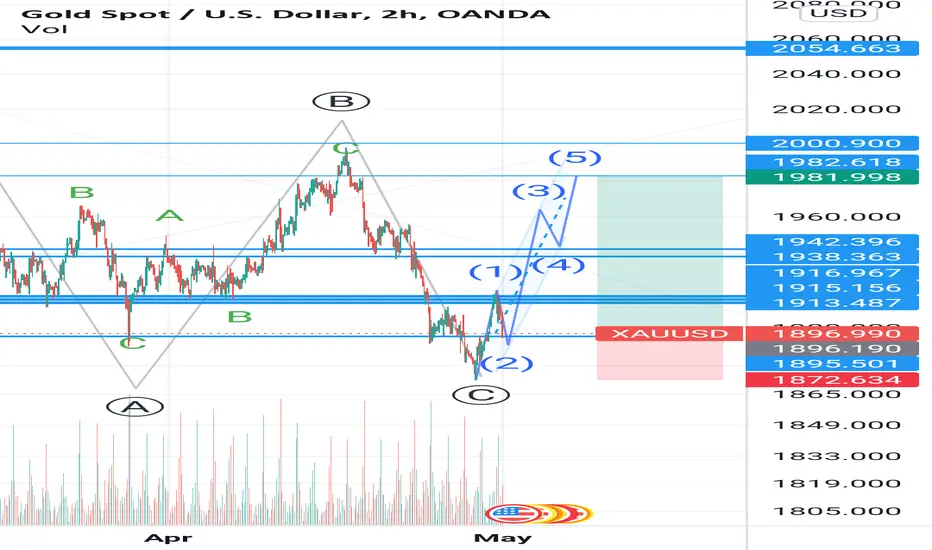
Gold's buy opportunityHi
The correction of third wave wss done and forth wave was finished.
We are in impulse increasing wave and a best opportunity to buy.
Have good trade.
Bye
AUDJPY update - 28/04/2022Upside focus remains, expecting more upside to complete wave 3 of (3), the reasonable target for wave 3 of (3) is at 102 (wave 3 = wave 1 * 1.618).

ADAUSDT update - 28/04/2022upside focus remains, expecting a strong move higher in wave (3), critical support at 0.776

SUGAR update - 28/04/2022expecting a strong move higher in wave 3, on the other side and as alternate count the move lower than 18.945 will let us expect a big flat pattern in wave 2.

Nasdaq update - 27/04/2022expecting the larger correction in wave (4) to be started, looking for wave ((iii)) in the downside to target 10140 ( wave ((iii)) = 1.618 * wave ((i))).


Soy Bean update - 27/04/2022upside focus remains, expecting a strong move higher near 1880 to complete wave 5, critical support at 1560.4

EURGBP update -26/04/2022the push higher than 0.867 will give us a clue that the bottom is placed and wave ((C)) in it's early stage, Critical support at 0.82025
