Silver go to below 24.2Hi
Silver in ABC pattern in Elliot analysis
The goal of silver can be 24.2.
Have good trade
Elliottwaveforecasts

Platinum update - 19/04/2022expecting a strong move higher in wave ((iii)), critical support at 941.50


EURJPY update - 19/04/2022Upside focus remains, looking for more upside to complete wave ((iii)) of 3, the reasonable target for wave ((iii)) of 3 is 145.738 (wave ((iii)) = wave ((i)) * 1.618).


DJI update - 19/04/2022
upside focus remains in DJI, looking for the corrective price channel to retest then continue the uptrend in wave ((v)).

BTC in accumulation from 4/2021. Long-term bullish triangle!Today I want to present my main scenario. As long as 37400 holds I give this scenario the highest probabillity. I have identified an expanded triangle in the WB of the triagnle. Foundation for this scenario is WB which made HH and WC which has corrective nature and was unable to make LL thus it made HL. Now we are moving up in WD which is a complex correction with heavily overlapping structure. It is however still making HHs and HLs. As long this is the case we should be bullish. We have already seen some bullish indications such as D engulfing and swept liquidity below 39k. The probabillity of this scenario increases if we manage to get the confirmations labelled on the chart. If this scenario is correct we should finished the triagnle by summer and ultimately move to ATHs towards the end of the year (and perhaps reached the mythic 100k).
We are forming our gameplan based on the indentified patterns which give us higher probabillity (they have been proven statistically significant) which in the long run should give us an edge (alfa = overperformance) in the markets. However, we should also be prepared for the alternative scenarios with lower probabillity so that we dont suffer large losses or get wiped out, even if it means limiting our profits and cutting losses when we are proven wrong. As TWC says, the only thing you can control in the markets is how much are you going to lose.

Unconfirmed bearish scenario for BTC. Watch out!Today I present to you inverted W chart of BTCUSD. We can see clear impulse down. Because we can count five waves we should form a scenario where PA will correct the impulse. So far we have gotten a reaction from lows and a HL which is the first indications of reversal. To confirm this idea we should see break of wave B of the recent correction in the channel and break of W4 of the large impulse. Moreover, this break would also confirm a Head and shoulders formation. When this happens, we should adopt this idea as a main scenario. Until then we should prefer bullish scenarios which will result in trend continuation. The move from the lows also doenst look that much impulsive and I tend to indentify it as a corrective move which supports the bullish scenarios.
We are forming our gameplan based on the indentified patterns which give us higher probabillity (they have been proven statistically significant) which in the long run should give us an edge (alfa = overperformance) in the markets.

LTC - simmilar path as BTCLTC is looking pretty simmilar to BTC. Support comes in at about 102 - 98$, so I will attempt a long from there. The support is not as well - defined as it is on BTC, so will have to be more careful with this one.

XLE update -18/04/2022looking for more upside near 89.5 to complete wave (3), wave (3) = 1.618*wave (1) @ 89.45.

SPX update -18/04/2022upside focus remains in SPX, looking for the corrective price channel to retest then continue the uptrend in wave ((v)).

SILVER update - 18/04/2022looking for more upside to complete wave (v) of ((iii)), critical support at 23.95


USDCAD update - 18/04/2022Upside focus remains, expecting a strong move higher in wave 3 of (A) of ((Y)), Critical Support at 1.20068

usdchf update - 18/04/2022the little bounce let us back to the previous scenario, expecting usdchf to higher in wave 3 of (c), critical support at 0.91947

ZW2! update -18/04/2022expecting a strong move near 1400 to complete wave (5), next key level to note at 1139.6, critical support at 967.2


Dax in 3-4 monthsHi
Dax in ending diagonal wave that can be predicted by Elliot wave. The 3 target calculated carefully.
Have good trade
Bye

sell USDCHF sl 0.94904 tp 0.91987now in correction wave b of 2--> leading digonal
After the end of the wave pattern b
Wait for the C-wave to continue to the deep Fibonacci levels

Dax elliott analysisHi
We are in ending diagonal in wave 5. Dax could be reach 17000.
Have good trade
Bye

I think I have itThis is my favorite BTC count as of right now. If this play out, we have quite a few months of pain ahead of us.
Very painful, very long and decieving.
Expect it if it comes.

Gold in time frame 1hrHi
This is a elliott analysis for gold in timeframe 1 hr. Gold could be increase to 2100 in 40-60 days.
Now, 2000 resistance can be stop the large increase for one week and then.... .
Have a good trade

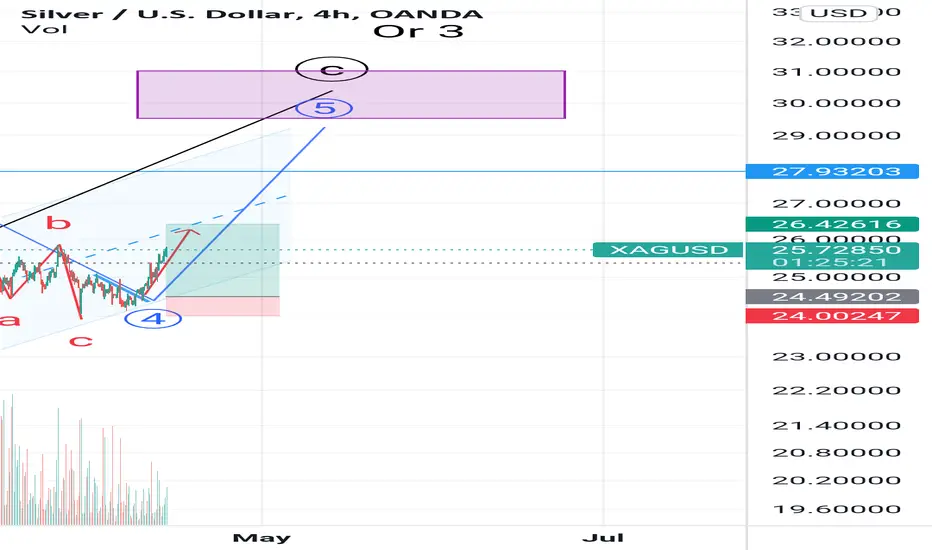
Silver go to 28-30 Hi
In previous analysis, l predict that wave 4 in c (or 3) wave is completed ans told the wave 5 must be started.
Have good trade