AUDUSD WAVE AND PATTERN ANALYSIS TRENDThis post is just a personal idea and analysis should not be the criterion for buying or selling
It seems to be in the g-wave and based on confirmation from other currency pairs such as eurusd, which has a negative correlation with this currency pair and the euro is bullish, this currency pair will probably fall to the specified range in the long run.
It may form in the same diametric microwave
The range I consider for the target is 0.47780
In the rectangles on the chart, the patterns formed in the past in microwaves are labeled in different time cycles and can be used for teaching and learning.
On the chart, I tried to segment as much as possible the educational tips related to the classic Elliott and Elliott in neowave style in the rectangles I drew and the formation patterns in different time cycles. I hope my efforts will be useful for educational materials.
My prediction is that the price will reach this level in the next 4 to 5 years
Elliottwaveforecasts

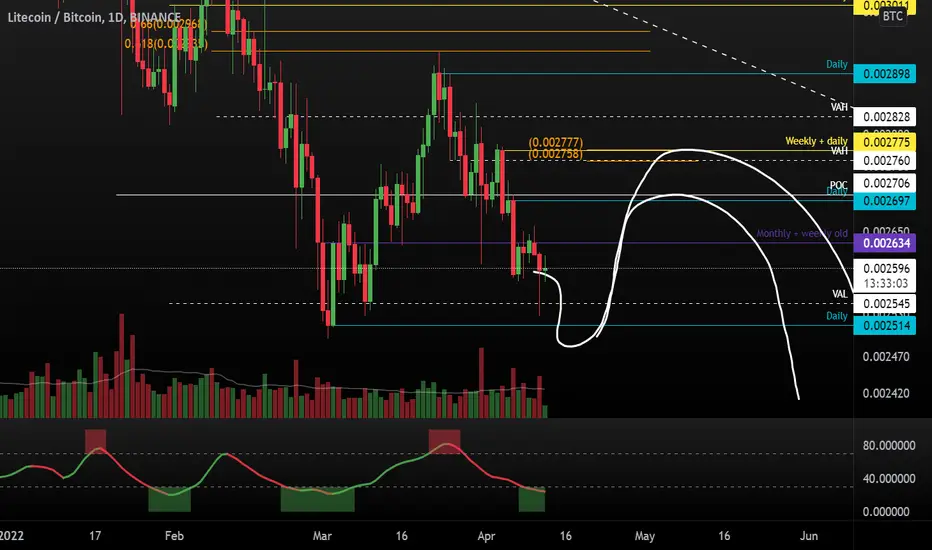
LTC/BTC showing the path for Litecion?After further analysing the BTC pair of this altcoin, I found out that it loves to tag the golden pocket before turning lower.
Putting this knowledge to practice - we can trade LTC while looking at the LTC/BTC pair, as well as BTC, to time our entries perfectly.

I don't usually trade forex, but...This setup looks pretty good. There is a ton of confluence in the 162,4 - 163,8 area and I do think we will bounce from some of the levels there.

GBPUSD Trade Idea - Elliott WaveLet’s discuss the price chart of the GBPUSD currency pair based on the 480 minute timeframe.
From the Elliott Wave perspective, Wave (2) has completed and Wave (3) is in progress. The price has just breached the low of Wave (1) and pulled back for a re-test.
From the Hurst Cycles perspective, the composite model line which measures the combined cyclical pressure, topped on April 5 (red vertical line), and is projected to form a bottom on May 16th.
Based on this, we can expect prices to begin to accelerate lower. The typical target for Wave (3) is a 161% Fib projection of Wave (1), which should push price down near the 1.2775 level.
If you find this analysis useful, make sure to press the “Like” button and Follow us.

GBPUSD GBPUSD TEchnical analysis basically on elliott waves Principles and Price action Strategy
Very Good Sell opp
Wait and watch.

Gold t0 2150 targetHi
Gold is in ending diagonal with ABC construction. Macd also confirm this pattern.
We are in fifth wave and raise in his channel to 2150 on the end of August.
Have good trend.

VALE: Uber Bullish setup for 2022, 40+Vale has a very bullish 1-2, 1-2 set up right now. This stock should reach at least the $40 level by Q4 2022 or Q1 2023 because that is where the 1.382 - 1.618 fibonacci extensions project to, which are the standard targets for a W-3. This count matches up well with the broader economic themes for 2022 of inflation, a weakening dollar, and increased investment in emerging markets. I have a large position in Vale.

MSFT: Sell Zone is 325-330MSFT is finishing up its 4th wave pullback. Mega caps don't typically experience deep retracements, so the .382 retracement is the perfect buying zone. In the next day or two MSFT will resume its uptrend to complete its 5th wave up to the $325-$330 region. After that, MSFT will experience a 2nd wave pullback to approximately today's levels.

GBPJPY GBPJPY will continue to go down to complete the wxy structure. We can wait for the correcting trend breaking signal to get an entry.

BTCUSD COINBASE POSSIBLE ABC 12345 CORRECTION WAVECOINBASE:BTCUSD
Here we have a possible Elliot Wave correction pattern,
ABC correction pattern, coupled with a 12345.
this is just my analysis. its not trading advise.

BTCAround the 50000 price zone, BTC could reverse due to the completed wave structure wxy. Please pay attention.

BTC update - 01/04/2022expecting more upside to complete wave D, looking for wave D to top at 55-57k (cluster zone), critical support at 37592.35

XRPUSD cryptocurrency this week has attempted corrective growthXRPUSD cryptocurrency this week has attempted corrective growth, Yesterday, a strong impulse could be observed at the XRP. This is due to the fact that the new Biden law put a checkmate in the case with the SEC. I'm expecting XRP to cost more to be part of the new financial system. During the first cycle, we had a strong bullish impulse which was then corrected by a complex WXY structure as indicated on the chart. Wave W was a simple ABC, wave X was also an ABC structure with wave B a triangle, and the Y was an impulse 12345. Around 20th Feb-2022 a new cycle is beginning, we have had the first wave completed and retraced at 78.6% fib level. investors can now buy XRPUSD with a protective stop at 0.600.

AUDUSD has started a near term bearish move falling from 0.74405AUDUSD has started a near-term bearish move falling from 0.74405 since 2022-03-07. This pair will continue to move down due to many fundamentals surrounding it. From a technical analysis perspective, it has completed the first down move (impulse 12345). among the corrective phase, wave C is also having some impulse characteristics. it is so straightforward. Short positions may be at CMP with the target at 0.7066 and stop loss around 0.7372. Implementation period: 7–10 days.

ETH/USD Macro Elliott Wave CountsIn the ETH/USD 1W timeframe, 1750 becomes the key level to watch.
Bullish case (purple count): If we see a strong bounce from the 1750 level (23.6% of wave (iii)) to confirm wave (iv), we may be welcoming a wave (v) that takes ETH to $8000-12000 as well as a nice alt season soon.
Bearish case (red count): If ETH fails to hold the 1750 level, things may get very ugly in the next few years.

Elliott Wave ClassicAsana demonstrates a classic Elliott wave analysis model.
There is a classic upward impulse and a correction in the form of an ABC zigzag, where B is triangle.
Now we have 5 wave upward impulse after the zigzag, which after ATH fell from the price of 145.3 to the level of 43.77, almost touching the strong support level of the top of wave .
I assume that ASAN can go to the 3rd wave with extension, but it's possible also get situation with more complicated correction in the form of WXY as double zigzag.
So, for a short-term trading there is a good opportunity to trade at least wave b of the zigzag as alt. scenario.

USDCHFThank you for your attention, ladies and gentlemen! No other method will give you an understanding of the market like this. USDCHF on the weekly on it way to complete wave 5.

TEXTBOOK Ending Expanding DiagonalDino juice looking like a page out of an Elliot Wave Theory textbook. All rules have been illustrated to be present and not broken.
This is probably the most extensive analysis I've done so I would love to hear any feedback. Always do your own due diligence.
Supposedly these patterns are "extremely rare"..
Ending expanding diagonal
Rules (these are “hard” rules; they cannot be broken)
A diagonal triangle always subdivides into five waves.
An ending diagonal always appears as wave 5 of an impulse or wave C of a zigzag or flat.
Waves 1, 2,3, 4 and 5 of an ending diagonal always subdivide into zigzags.
In the expanding variety, wave 3 is always longer than wave 1, wave 4 is always longer than wave 2, and wave 5 is always longer than wave 3.
In the expanding variety, wave 5 always ends beyond the end of wave 3.
Guidelines (guidelines can be broken but it’s rare that they are)
Within an impulse, wave 5 is unlikely to be a diagonal triangle if wave 3 is not extended.
In the expanding variety, wave 5 usually ends slightly before reaching a line that connects the ends of waves 1 and 3.
source: worldcyclesinstitute.com

AMKR - RETRACEMENTWave 5 is over.
AMKR needs rest . We would wait for Wave A completion to Bull.
Good luck

NZDCHF : bullish outlookHello everyone
Before we start a discussion, it is my pleasure to read your opinion on this post's comment section and support this idea with your likes if you enjoyed it!
NZDCHF :
Possible Elliot counts are shown on the chart.
we can see two patterns:
1: the bigger ABC pattern.
2: the C arm of the ABC pattern includes 5 waves and the price reached the end of wave 5.
price:
the price reached a PRZ zone for the wave 5 and the end of ABC pattern.

Bitcoin - A third wave rally is underway.Bottom Line: A third wave rally is underway.
The rise from 41141.39 isn't yet in five waves, which we want to see form to reduce the risk of yet another fake low. The surge through the end of wave ((1)) favors that wave 3 is underway. It will travel 1.618x wave ((1)) at 48851.27.
(( )) denotes a circled number or letter
Disclaimer : Prices can vary between BITCOIN exchanges. Consequently, there may be differences in our chart prices due to different data sets. The analysis information is for reference only and does not constitute an investment recommendation. We recommend that people avoid trading on unproven exchanges vulnerable to hacking and theft.

DJI Update.This count is based on my assumptions so anything can happen not a trading or financial advice just for educational purposes only kindly do your own ta thanks trade with care good luck.
