XAUUSD GOLD UPDATE #XAUUSD GOLD
We are in the b wave , if this count works then we will see some drops in gold , still b wave didn't completed , will let you know when completes .
Elliottwaveforecasts

EURUSD : expecting bullish waveHello everyone
Before we start discussion, it is my pleasure to read your opinion on this post's comment section and support this idea with your likes if you enjoyed it !
EURUSD :
the price is printing the correction model as the wave B or 2.
we can expect a bullish wave as the wave C or 3.
I determine the Fibonacci expansion wave 1 from end of wave 2.
100% Fibonacci expansion in near a strong resistant line and they form a strong zone for our target.

AAPL Looking at a dip before the last leg upAAPL looking to retest demand zone in a wave 4 drop before heading upward to complete the 5th wave. This is just for education purposes only, you are responsible for whatever action you take based on this information.

AMZN Paths to 4K. The Three What IfsAMZN has been stuck in this choppy price action for quite sometime now, and I know we are all looking forward to that pop to $4000. Let me guide your eyes as I show you my perspective in three different scenarios which are color-coded in green, white, and red. Anything is possible with the market, so keep an open mind. This is just for education purpose only. You are responsible for whatever action you take based on this.

FTSE Another Leg Lower is Expected To Take PlaceShort-term Elliott wave view in FTSE suggests that the rally to 7404.31 high ended wave ((1)). Down from there, the index is doing a pullback in wave ((2)) to correct the cycle from the 10/28/2020 low before the upside resume. The internals of that pullback is unfolding as Elliott wave zigzag structure where initial decline to 7198.76 low ended wave 1. Then wave 2 ended at 7311.94 high, wave 3 ended at 7044.3 low. Wave 4 bounce ended at 7161.91 high and wave 5 ended at 6989.66 low thus ended the first leg in wave (A).
Up from there, the index made a short-term bounce in wave (B). The internals of that bounce also unfolded as a lesser degree zigzag structure where wave A ended at 7182.01 high. Wave B ended at 7083.21 low and wave C ended at 7378.92 high. Near-term, as far as bounces fail below 7378.92 high and more importantly below 7404.31 high the index is now expected to start the (C) leg lower. And expected to see more downside towards 6966.22- 6710.86 100%-161.8% Fibonacci extension area of (A)-(B). From there, the next leg higher is expected to take place or should produce a 3 wave bounce at least. Alternatively, if it breaks higher then the index might have done a running flat correction from the August peak.

VISA SHORTIt appears VISA has one more drop left for 5th wave to complete an expanding ending diagonal, after which It will be setting up f or a bull run. This is just for education purpose only, not an investment advise.

VISA SHORT It appears VISA has one more drop left for 5th wave to complete an expanding ending diagonal, after which It will be setting up f or a bull run. This is just for education purpose only, not an investment advise.

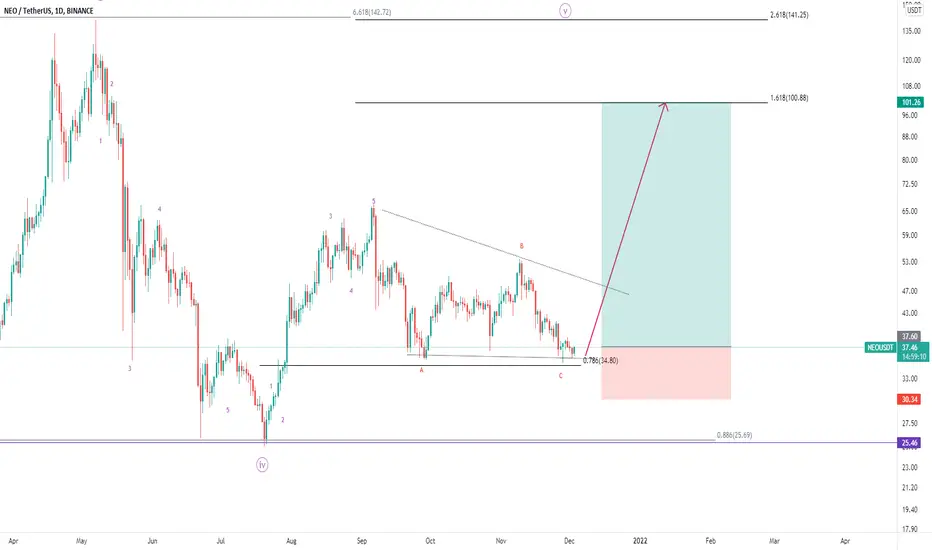
NEO / USDTLooks like we have completed the wave 2 and the next wave is the impluse wave , we will see some good moves in neo in upcoming days , stay tuned
XAG/ USD XAG / USD , Silver looks like we have a pending for the third wave and If we break this red line which is knows as psychological support then price will be crashing like a hell towards 18$ levels !!

NZD/ CAD NZD /CAD , Looks like we have completed the 4th wave and wait for the rejection and sell in this pair , 5th wave pending and it will ride harder towards the downside !

GBP / USD Looks like we bave completed the 4 th wave ! , stilll looks like we will have some deeper correction towards the downside ! last analysis still going good , let's see what happens !!

XAU / USD Well let's see, not able to understand the market for this week , will update you the potencial move soon !! may be final leg towards the downside then pump to the moon , let's see

ETH/USDTLooks like we are in ending diagonal , soon we might see some final correction in the bitcoin and in other crypto curriencies , let's see !

Gold elliott wave analysis today, idea for gold tradingDo you find for a Gold elliott wave analysis today ?
This is an unique idea for gold trading on TradingView blog.
I just use Elliott Wave as analysis reference. Keep in mind, here's an elliott wave gold forecast.
The above chart shows only one case with 5 Elliott Waves of gold on the 4h time frame.
Z Concepts is a free blog sharing how to use Wyckoff theory, supply and demand , Price Action and some other modern technical analysis methods.
Follow to update more effective gold trading cases!
------------------------------------------
Attention:
React to price action based on specific trading plans, rather than predictions.
This is my personal idea and analysis, please just see it as an example for reference.
You also need your own judgment, analysis as well as a trading plan to manage risks when trading Forex.
What method are you trading gold & forex?
Please comment below

XAU / USD Let's take low lots here , and risk of 100 pips ! , buy mode on in gold , holding the fib levels 0.618 perfectly soon we might see a bounce back in gold , let's see

GBP/NZD ShortWe expect this to be the trade of the week as well as NZD/CAD. Our fundamental bias on this pair is tilted to the upside. we expect NZD strength due to the interest rate hike circle they are on. Market is expecting the RBNZ to raise rates tomorrow and our bias is negative for GBP since we expect the BOE to disappoint the market and leave rates unchanged.

AUD/CHFLooks like we have completed the b wave and it's getting ready for the c wave , we can short the market here !

XAU / USD My old analysis , worked well and market dropped to my respective level , now time to enter buy in gold at 0.5 and 0.618 fib levels !! so let's accumlate and take a buy to make some dollars

EUR / USD Looks like 5th wave is pending for eur / usd , we might see some another final drop in eur pair , let's see

NZD/CHF long positionThe RBNZ on their last meeting started the tapering program so that a bullish move for the NZD hence after tapering its rates hike. on the bigger structure the market is completing a WXY patterns that's in the same direction as the fundamental outlook. Note any correction will offer short term buys and any positive developments in the economic data should fuel the support for the NZD and put pressure on CHF

AUD / JPY AUD/ JPY looks like we have completed the 4 th wave , and it should jump from now here towards 50% upside , let's ses

BTC / USD We can see a final drop in bitcoin , c wave with impluse correction and then we continue a new rally in the market !!!

SPY Elliott Wave View: Should Extend Into New HighsShort-term Elliott wave view in SPY suggests that the cycle from October 01, 2021 low is showing a higher high sequence favoring new highs to follow. The internals of that rally is unfolding as an Elliott wave impulse sequence where wave 1 ended at $436.03 high & wave 2 ended at $426.36 low. Up from there, wave 3 unfolded with extension where lesser degree wave ((i)) ended at $441.68 high. Afterwards, wave ((ii)) ended at $431.54 low, wave ((iii)) ended at $458.49 high. Then wave ((iv)) ended at $453.83 low and wave ((v)) ended at $470.65 high.
Down from there, SPY made a pullback in wave 4 to correct the cycle from October 04, 2021 low. The internals of that pullback unfolded as a zigzag structure where wave ((a)) ended at $465.26 low. Then wave ((b)) ended at $467.38 high and wave ((c)) ended at $462.05 low. Up from there, wave 5 remains in progress where wave ((i)) ended at $470.49 high and wave ((ii)) ended at $466.34 low. Near-term, while dips remain above $466.34 low and more importantly above $462.05 low expect SPY to extend higher towards $474.82- $480.04 area higher in wave ((iii)) before a pullback in wave ((iv)) develops.
