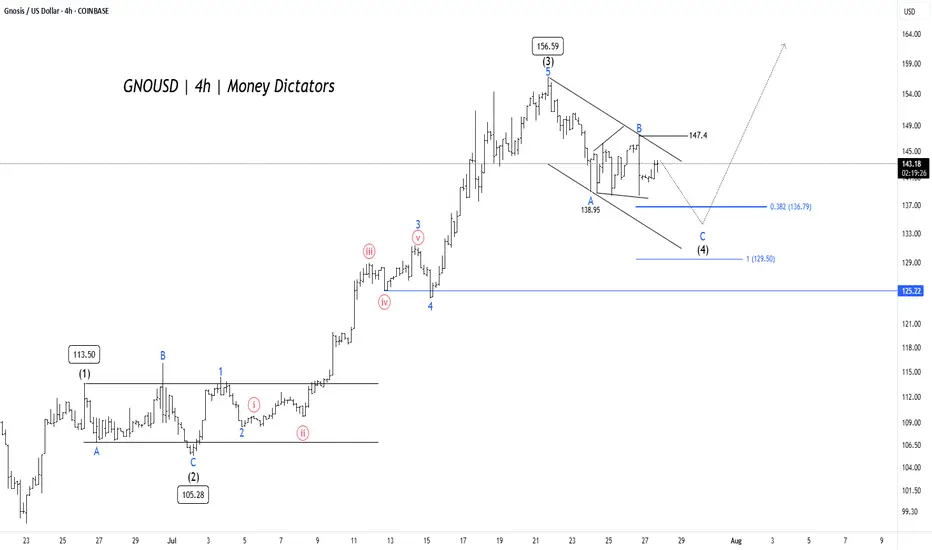
GNO/USD Price Action Aligns for Final Wave 5 PushGNO/USD pair is unfolding a clean Elliott Wave impulse pattern on the 4-hour chart. The rally began with Wave (1) reaching 113.50, followed by a corrective Wave (2) that bottomed near 105.28. This set the stage for a powerful Wave (3) that surged to 156.59, aligning well with Elliott Wave theory where Wave 3 is typically the strongest and steepest leg in the sequence.
Wave (4) is now in progress, taking the form of an A-B-C correction inside a descending channel. Interim support was found at 138.95 during Wave A, and Wave C could extend toward the 0.382 Fibonacci retracement level at 136.79 or the deeper support zone near 129.5. These levels are crucial, as they often mark the end of a corrective phase and the beginning of the next impulse. A confirmed breakout above 147.4 would signal the start of Wave (5) and the return of bullish momentum.
Short-term targets have the potential to reach 135 – 128 , while 125.22 remains the invalidation level for this bullish setup. After the completion of Wave (4), traders can look for long opportunities targeting 147 – 154 – 172 . As long as the structure holds and price respects key supports, the outlook remains favorable for a fresh push higher in Wave (5).
Elliottwaveideas
Dollar Major BottomDollar has just finished a major zigzag correction. I was correct, in my last idea, of calling one more leg lower before this major low. Watch for the dollar to PUMP in 5 waves!

Are we on Super Bullish Express Highway ? Elliott Waves RoadmapHello friends,
Welcome to RK_Chaarts
Today we're attempting to analyze Bitcoin's chart, specifically the BTCUSD chart, from an Elliott Wave perspective. Looking at the monthly timeframe chart, which spans the entire lifetime of Bitcoin's data since 2011, we can see the overall structure. According to Elliott Wave theory, it appears that a large Super Cycle degree Wave (I) has completed, followed by a correction in the form of Super Cycle degree Wave (II), marked in blue.
Now, friends, it's possible that we're unfolding Super Cycle degree Wave (III), which should have five sub-divisions - in red I, II, III, IV, & V. We can see that we've completed red I & II, and red III has just started. If the low we marked in red II doesn't get breached on the lower side, it can be considered our invalidation level.
Next, within red III, we should see five primary degree sub-divisions in black - ((1)), ((2)), ((3)), ((4)) & ((5)). We can see that we've completed black ((1)) & ((2)) and black ((3)) has just started. Within black ((3)), we should see five intermediate degree sub-divisions in blue - (1) to (5). Blue (1) has just started, and within blue one, we've already seen red 1 & 2 completed, and red 3 is in progress.
So, we're currently in a super bullish scenario, a third of a third of a third. Yes, the chart looks extremely bullish. We won't commit to any targets here as this is for educational purposes only. The analysis suggests potential targets could be very high, above $150,000 or $200,000, if the invalidation level of $98,240 isn't breached. But again, friends, this video is shared for educational purposes only.
Many people think that the market doesn't move according to Elliott Waves. But friends, here we've tried to analyze from the monthly time frame to the overly time frame. We've definitely aligned the multi-time frame and also aligned it with the principal rules of Elliott Waves, without violating any of its rules.
I agree that the Elliott Wave theory can be a bit difficult, and for those who don't practice it deeply, it can be challenging. But yes, the market moves according to this methodology, following this pattern. This is a significant achievement.
I am not Sebi registered analyst.
My studies are for educational purpose only.
Please Consult your financial advisor before trading or investing.
I am not responsible for any kinds of your profits and your losses.
Most investors treat trading as a hobby because they have a full-time job doing something else.
However, If you treat trading like a business, it will pay you like a business.
If you treat like a hobby, hobbies don't pay, they cost you...!
Hope this post is helpful to community
Thanks
RK💕
Disclaimer and Risk Warning.
The analysis and discussion provided on in.tradingview.com is intended for educational purposes only and should not be relied upon for trading decisions. RK_Chaarts is not an investment adviser and the information provided here should not be taken as professional investment advice. Before buying or selling any investments, securities, or precious metals, it is recommended that you conduct your own due diligence. RK_Chaarts does not share in your profits and will not take responsibility for any losses you may incur. So Please Consult your financial advisor before trading or investing.

Potential Reversal Ahead: Elliott Wave AnalysisHello friends,
Welcome to RK_Chaarts,
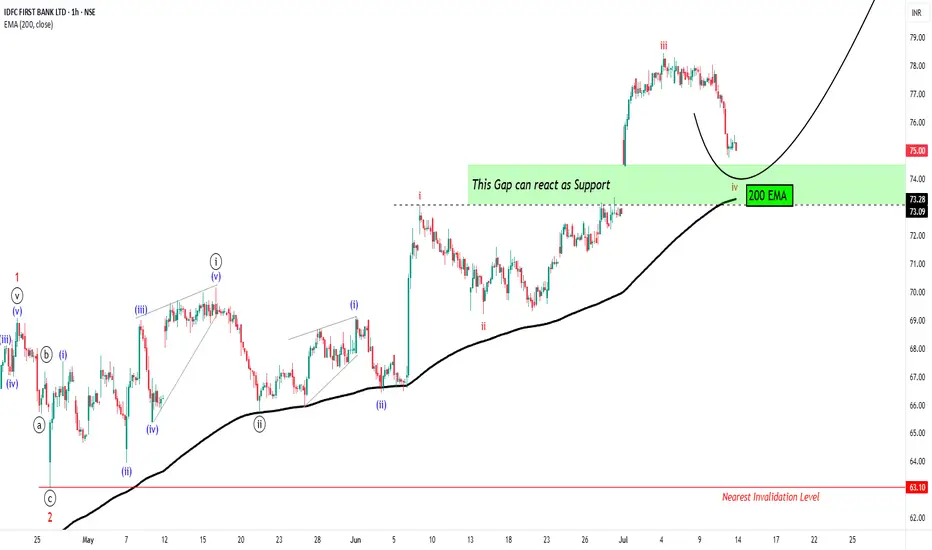
Today we're going to analyze chart of stock named IDFC First Bank, based on Elliott wave theory.
Today, we're analyzing the chart of IDFC First Bank using Elliott Wave theory. On the chart, we've marked the Elliott Waves, indicating that:
- Red wave 1 and 2 (Minor degree) have ended
- Price is unfolding into red wave 3 (Minor degree)
- Black wave ((i)) and ((ii)) (Minute degree) have completed
- Black wave ((iii)) (Minute degree) is ongoing
- Blue wave (i) and (ii) (Minuette degree) have finished
- Blue wave (iii) (Minuette degree) is in progress
- Red wave i, ii, and iii (Subminuette degree) have completed
- Possibly in the correction phase of red wave iv (Subminuette degree)
We observe that the price gapped up, retraced to correct wave iv, and is now supported by the gap zone. Along with 200Exponential Moving Average is also at Gap level which can also provide a good Support to same view.
Our estimate suggests a high probability of a price reversal. However, market uncertainties exist.
Potential price targets: 81, 93, and 100+
Nearest invalidation level: 73.09 (wave iv should not overlap wave i)
Please note that this analysis is for educational purposes only. I'm not a SEBI-registered analyst, and you should consult your financial advisor before trading or investing.
Let's see how the market unfolds. This entire study is shared solely for educational purposes. Thank you so much.
I am not Sebi registered analyst.
My studies are for educational purpose only.
Please Consult your financial advisor before trading or investing.
I am not responsible for any kinds of your profits and your losses.
Most investors treat trading as a hobby because they have a full-time job doing something else.
However, If you treat trading like a business, it will pay you like a business.
If you treat like a hobby, hobbies don't pay, they cost you...!
Hope this post is helpful to community
Thanks
RK💕
Disclaimer and Risk Warning.
The analysis and discussion provided on in.tradingview.com is intended for educational purposes only and should not be relied upon for trading decisions. RK_Chaarts is not an investment adviser and the information provided here should not be taken as professional investment advice. Before buying or selling any investments, securities, or precious metals, it is recommended that you conduct your own due diligence. RK_Chaarts does not share in your profits and will not take responsibility for any losses you may incur. So Please Consult your financial advisor before trading or investing.
Technical Analysis: Price Breakout and BeyondHello Friends,
Welcome to RK_Chaarts,
Let's try to analyze a stock from the FMCG sector, "Dabur India Limited".
Elliott Wave perspective.
We can see that the correction is completed, which is the IVth wave of the monthly time frame of cycle degree in Red. Now, possibly the impulse wave Vth had start unfolding. If we go inside that, we'll see its five sub-divisions in black, labeled ((1))-((2))-((3))-((4))-((5)) of primary degree.
Possibly, wave ((1)) has started unfolding, and within wave ((1)), we'll see five sub-divisions in blue, which is the intermediate degree. Within this, waves (1) and (2) looks complete, and wave (3) has started, which has also broken out of the curve line.
Invalidation level
If our wave counts are correct, the bottom level of wave IV, which is 433, will be our main invalidation level. If the price goes below this level, it will trigger the invalidation level. If that happens, we'll need to re-analyze the chart from a wave count perspective.
But if the price stays above this invalidation level, then our view, which is based on the analysis, will remain bullish, and the chart will remain bullish.
Projected Target
As per Elliott wave theory, it can show new ATH in Long Term, only if Invalidation level is not breached.
Breakout with good Intensity of Volumes
The breakout has a good intensity of volume. The volume in the breakout candle is looking very good, which is 3-4 times higher than the average. This means that market participation is very good during this breakout. So, Conviction is high on this breakout.
We can clearly see that the price has closed above the 50 Exponential Moving Average (EMA), 100 EMA, and 200 EMA, which is a very good sign that the price has overcome all these hurdles along with Breakout.
Now, if there are any hurdles above, they could be the 200 EMA on the weekly time frame, which is coming near the level of 529, and the 50 EMA on the monthly time frame, which is coming near the price of 527. Currently, the price is trading around 513.
Once it crosses 529 or 530, it may show even more strength after that.
Dow Theory Trend confirmation
Based on Dow Theory, if we observe, the price which was falling and making lower highs and lower lows, has now started forming a Higher High and Higher Low pattern on the daily time frame, which is again a sign of bullishness.
Standard Deviation crossed
Price is trading above the mid-Bollinger Band on the weekly time frame, i.e., in the bullish territory. On the daily time frame, Prince has also crossed the upper Bollinger Band, meaning it has broken out and is expanding above the upper Bollinger Band, which is a bullish sign
Supporting Indicators
On the daily time frame, a very good breakout is visible inside RSI, and is also moving above 72. Additionally, on both the daily and weekly time frames, the MACD has given a positive crossover.
Before making any trading decisions, please conduct your own analysis or consult with a technical expert or financial consultant.
I am not Sebi registered analyst.
My studies are for educational purpose only.
Please Consult your financial advisor before trading or investing.
I am not responsible for any kinds of your profits and your losses.
Most investors treat trading as a hobby because they have a full-time job doing something else.
However, If you treat trading like a business, it will pay you like a business.
If you treat like a hobby, hobbies don't pay, they cost you...!
Hope this post is helpful to community
Thanks
RK💕
Disclaimer and Risk Warning.
The analysis and discussion provided on in.tradingview.com/u/RK_Chaarts/ is intended for educational purposes only and should not be relied upon for trading decisions. RK_Chaarts is not an investment adviser and the information provided here should not be taken as professional investment advice. Before buying or selling any investments, securities, or precious metals, it is recommended that you conduct your own due diligence. RK_Chaarts does not share in your profits and will not take responsibility for any losses you may incur. So Please Consult your financial advisor before trading or investing.

BABA Stock: A Detailed Analysis using Elliott Wave Theory RulesHello Friends,
Welcome to RK_Chaarts,
Let's analyze Ali Baba Group Holdings Limited, also known as BABA, listed on the NYSE. We'll be using the Elliott Waves theory.
Friends, as we can clearly see, after hitting a low of around $95.75 on 9th April 2025, it started an impulse wave. Within this wave, we've completed intermediate degree blue bracketed (1), (2), (3), (4), (5), and primary degree ((1)) in Black. Currently, we're completing primary degree ((2)), with a low around $111.
If it breaks the level of $111, we'll assume we're still in primary degree ((2)), as marked in scenario 2 on the chart. This means wave ((2)) is unfolding, and wave ((3)) might start after wave ((2)) is complete.
If it doesn't break the $111 level, it's likely that wave ((2)) has completed, and we've started a subdivision of wave ((3)) or its further subdivisions. If it moves further up, following scenario 1 (the black line on the chart), this is a possibility.
According to Elliott Wave theory, wave ((2)) cannot retrace more than 100% of wave ((1)). So, our main invalidation level for this count is $95.75. Yes, BABA is turning up against the 95.75 low, and in the near term, we expect the stock to trade higher.
Somewhere, this stock might move towards $150 or $160 if it doesn't break down below $ 95.75.
I am not Sebi registered analyst.
My studies are for educational purpose only.
Please Consult your financial advisor before trading or investing.
I am not responsible for any kinds of your profits and your losses.
Most investors treat trading as a hobby because they have a full-time job doing something else.
However, If you treat trading like a business, it will pay you like a business.
If you treat like a hobby, hobbies don't pay, they cost you...!
Hope this post is helpful to community
Thanks
RK💕
Disclaimer and Risk Warning.
The analysis and discussion provided on in.tradingview.com is intended for educational purposes only and should not be relied upon for trading decisions. RK_Chaarts is not an investment adviser and the information provided here should not be taken as professional investment advice. Before buying or selling any investments, securities, or precious metals, it is recommended that you conduct your own due diligence. RK_Chaarts does not share in your profits and will not take responsibility for any losses you may incur. So Please Consult your financial advisor before trading or investing.

BTCUSD Wave Count: Bitcoin Unfolding Wave ((5)) ?Hello Friends,
Welcome to RK_Chaarts,
Let's analyze the Bitcoin chart today using Elliott Wave theory. As we can see, Bitcoin recently made a high around $112,000 on 23rd May 2025. We've marked this as the completion of Primary Degree Black Wave ((3)). After that, it dropped to complete Wave ((4)) on 31st May 2025. Now, it's moving up, possibly unfolding Wave ((5)). According to Elliott Wave principles, Wave 2 cannot retrace more than 100% of Wave 1. So, our nearest invalidation level is the 31st May's low at $103000. If the price sustains above this level, we can expect it to move towards $115,000 as a Projected Target of wave ((5)). However, if it breaks below the invalidation level, we'll need to re-analyze the wave counts. We've also drawn some trend lines, marked in black dotted lines, which act as support and resistance. This is a 1-hour time frame chart. The red line marking the nearest invalidation level is crucial. If it breaks, we'll need to adjust our wave counts. If it holds, we can expect the price to move up towards $115,000. Let's see how the market unfolds. Please note that this is an educational analysis and not a trading tip or advice.
Analysis Summary
- Analyzing Bitcoin chart using Elliott Wave theory to understand market trends and potential price movements.
- Recent high around $112,000 on 23rd May 2025, & Recent Low around $103,000 on 31st May 2025 indicates a significant turning point in the market.
Wave Count
- Completed Primary Degree Black Wave ((3)) suggests a major uptrend has concluded.
- Completed Wave ((4)) on 31st May 2025 indicates a correction phase has ended.
- Possibly unfolding Wave ((5)) implies a new uptrend may be emerging.
Key Levels
- Nearest invalidation level: 31st May's low at $103,000 serves as a crucial support level.
- Projected Target: $115,000 represents a potential upside target based on Elliott Wave principles.
Elliott Wave Principles
- Wave 2 cannot retrace more than 100% of Wave 1: a key rule governing wave relationships.
- Wave ((5)) projection based on Fibonacci ratios and wave extensions.
Chart Details
- 1-hour time frame chart provides a detailed view of recent price action.
- Trend lines marked in black dotted lines highlight key support and resistance levels.
- Red line marking nearest invalidation level is crucial for validating the wave count.
Important Notes
- Breaking below the invalidation level would require re-evaluation of the wave count.
- Sustaining above the invalidation level increases confidence in the projected target.
I am not Sebi registered analyst.
My studies are for educational purpose only.
Please Consult your financial advisor before trading or investing.
I am not responsible for any kinds of your profits and your losses.
Most investors treat trading as a hobby because they have a full-time job doing something else.
However, If you treat trading like a business, it will pay you like a business.
If you treat like a hobby, hobbies don't pay, they cost you...!
Hope this post is helpful to community
Thanks
RK💕
Disclaimer and Risk Warning.
The analysis and discussion provided on in.tradingview.com is intended for educational purposes only and should not be relied upon for trading decisions. RK_Chaarts is not an investment adviser and the information provided here should not be taken as professional investment advice. Before buying or selling any investments, securities, or precious metals, it is recommended that you conduct your own due diligence. RK_Chaarts does not share in your profits and will not take responsibility for any losses you may incur. So Please Consult your financial advisor before trading or investing.

A look at monthly Chart of BTCIf we count Elliot Wave at weekly or monthly, we see we are at the ABC Correction of the Primary Impulsive wave, that the ABC might create an Irregular or Expanded Flat. I think the chart is going to create a C wave of the ABC Primary wave, and those numbers might be a target, but according to Fibbonaci Levels, 0.618, which is 40,000. Other targets can also be seen on the chart.

Technical Analysis with Elliott Waves: A Combined ApproachHello friends, Welcome to RK Charts!
This Educational Post is based on technical analysis, specifically how to initiate analysis on a chart, and what points to consider. This is purely for Educational purposes.
This is not a trading or investing tip or advisory. Rather, it's a comprehensive guide on how to easily analyze a chart, intended for educational purposes. I hope that by reading and understanding this post, you'll gain valuable knowledge and insights. Your focused effort to understand this will surely provide you with something valuable and easy to grasp.
Let's dive in, During technical analysis, what we had observed certain points in this chart, I'm highlighting them here:
1. Resistance line breakout, where the price has closed above it.
2. The volume within that breakout.
3. The price closing above Weekly Exponential Moving Averages.
4. Elliott Wave Counts.
5. Projected Target along with Invalidation level as per Elliott Wave theory.
6. Projected Duration for Projected Targets.
Breakout of Resistance zone with Good Volume intensity:
So, friends, here we can clearly see on the chart that this is a weekly time frame chart of Shipping Corporation of India Limited. Over the last eleven months, from July 2024, the price has been falling, remaining largely bearish, but has now broken out of Curved Resistance Trendline for the first time with a bullish candle on Weekly (Closing basis), accompanied by good volume intensity.
Alongside this, the price has sustained and closed above Major EMAs:
- 50-Weekly Exponential moving average (red line plotted on the chart)
- 100-Weekly Exponential moving average (blue line plotted on the chart)
- 200-Weekly Exponential moving average (black line plotted on the chart)
on the weekly time frame.
Elliott Wave Theory:
Considering the Elliott Wave structure, if we look at it theoretically, the top it made on July 2024, was the completion of Wave III. After that, it completed Wave IV in 7 swings (WXY) and is now possibly moving higher, making higher lows. It has closed above the moving averages, broken out of the Curved Trendline, and has strong volume. So, possibly, we are unfolding an impulse Wave V.
In Elliott Wave Theory, the invalidation level means that the price should not go below that level, which in this case is the low of Wave IV at ₹130. If the price goes below that level for any reason, even by a single point, our wave counts will be invalidated, and we'll have to re-analyze the chart.
That's why we call it the invalidation level. Analysts and traders also refer to it as a stop-loss level. So, in Elliott Wave Theory, our wave counts remain valid as long as the price stays above the invalidation level and doesn't trigger it.
Now, regarding the target, if we take the measurement of Wave IV and calculate its 1.236 level, the target for Wave V should be above the high of Wave III. According to Elliott Wave Theory, the projected target for Wave V is near ₹440, which is the 1.236 Fibonacci level.
Projected Duration for Projected Targets:
In the chart analysis we conducted, where we prospectively projected a target, if everything goes right and the invalidation level is not triggered, what could be the duration of this target? It will definitely take more than a medium-term duration, maybe even a long-term duration.
This is because each candle represents a week, and we're currently looking at the weekly time frame. Since the fourth wave has just ended and the fifth wave is upcoming, it will take a long-term duration
I am not Sebi registered analyst.
My studies are for educational purpose only.
Please Consult your financial advisor before trading or investing.
I am not responsible for any kinds of your profits and your losses.
Most investors treat trading as a hobby because they have a full-time job doing something else.
However, If you treat trading like a business, it will pay you like a business.
If you treat like a hobby, hobbies don't pay, they cost you...!
Hope this post is helpful to community
Thanks
RK💕
Disclaimer and Risk Warning.
The analysis and discussion provided on in.tradingview.com is intended for educational purposes only and should not be relied upon for trading decisions. RK_Chaarts is not an investment adviser and the information provided here should not be taken as professional investment advice. Before buying or selling any investments, securities, or precious metals, it is recommended that you conduct your own due diligence. RK_Chaarts does not share in your profits and will not take responsibility for any losses you may incur. So Please Consult your financial advisor before trading or investing.

Gold Is Doing What Ever Gold Wants To DoPreviously I posted a reading where I said gold was to go a bit down before is went up. But Gold didn't go down, and went straight up.
But it did go up right :D
Right now I strongly believe gold is in a wxy correction.
And I think will finish the y-wave i the green box area somewhere between 3,147 and 3,077, which is the 100-123% fib-level of the w-wave.
The reason I believe this, is at that timewise the y-wave will here have taken as long as the w-wave, and I the price is heading for that cyan median line. And normally price will also go to the bottom and a bit below of the Kennedy line.
Multiple factors are pointing to that level.
When price hits that level, I believe we will see a 5th level to the upside where 4,000 definitely is in play.
I will include a link to a higher degree reading, where you can see I believe gold has finished a third wave, so we still need a 5th wave to the upside.

BTC is Still A Correction.BTC is in good rally these days, but my believe is that it is still in a correction.
I am not 100% confident in wavecount, but I am confident that BTC is not done correcting until it has gone down to somewhere between 62.500 - 52.500.
If the rally BTC is currently in, I believe we are seeing a flat, and I will correct my count accordingly.. But right now I'm seeing a W-X-Y-X-Z correction.
Be careful, and do not bet on BTC is rallying to a million just yet ;)
For now I believe there will be good odds for following the white line I've drawn on the chart.

DXY In Difficult Circumstances Since the Start 80's I decided to give a go at the Dollar Index given the circumstances around the world. And to be honest, I tried to put on the positive glasses.
I believe the dollar has been in a complex correction since the mid 80's. Starting out with a large dump in '85 with the a-wave, the correction slowed down and only grew more and more complex.
Thought about current wave: What I believe we are going through now is, that we are finishing up the purple C-wave in a green (C)-wave. This wave can end at any time now, since it's now at the 61.8% fib level of the purple A-wave. But it might go down to the 95 level (The green box) to complete at the 100% fiblevel of the purple A-Wave.
But first we will have the fourth wave meaning the DXY is gonna struggle for some weeks. Because we had a swift two week wave 2, which means we are probably going have a slow fourth wave according to the rule of alternation. This mean the purple C-wave could drag out into the end of '25 into early '26.
This is also with that in mind that a C-wave most likely will take longer than an A-wave. These are the Purple boxes.
BUT, after this, DXY is gonna experience some happy years again, going back up to the yellow box somewhere between 110 and 120 to finish the WXY of x of the larger degree. This will take DXY into a couple of years bull-run as long as the green (C) wave runs and completes no earlier than late '27, depending when the purple C-wave prior to the green (C) wave ends. But I believe the green (C)-wave will take about two years to complete.
But after this, DXY could again go into some dark ages and considering the high degree purple w-wave took 23 years to complete (blue giant box), there is no reason to believe this high degree purple y-wave will be a swift matter and actually don't complete before the year 2050. And it will take the DXY all the down to start 60's or lower.
The reason I said I tried to put on the positive glasses, is that I tried seeing the white channel as a leading diagonal for a new bull run, but I just don't see it as such.
I also tried seeing it as a C-wave of a flat diagonal, but this would result in another C-wave afterwards, and also take us down to the 60's level. So that didn't do us any good.
For the sake of DXY, I hope I'm wrong, but this is how I see it.

My take on Gold. It's a difficult one..This is the read that makes most sense to me. And I have zoomed all the way into 15m, for you to be able to see my thoughts around it all.
For that wave down from April 2nd to April 7th to make any sense to me, I have labeled it as W-X-Y to complete (A). At first I had labeled it as a diagonal, but then price should not have retraced as much as it has since April 7th.
And I also believed Gold has finished a 5th of a 5th wave, so we need to see some more correction before price head to the upside again.
I simply can't read the retracement back up since the April 7th as a A-B-C, and this is why I believe price is just finishing up the A wave (and it might already have) before it goes into the B correction.
The initiated wave down (wave B of (B)) I believe will go down to 3,044 - 3,013 level and then finish of the flat with a wave C of (C).
This wave C should be able to go to the 3,130 - 3200 level.
But as I said, first we spend some days to the downside heading for that 3,044 - 3,013 level.
What is your current take on gold?

“Gold’s Resilience: Sustaining the Long-Term Uptrend”XAUUSD remains in an uptrend and is estimated to be in wave (v) of wave ; more specifically, it is currently within wave iv of wave (v).
In the short term, XAUUSD is expected to undergo a correction toward the 2,948–2,989 area. However, in the broader outlook, I anticipate further upside movement toward the 3,091–3,161 level.

“DXY Set to Strengthen, but Upside Potential Appears Limited”The current position of the DXY is estimated to have completed wave (iii) of wave . Consequently, the DXY is expected to strengthen, forming wave (iv) while testing the 104.800 to 105.346 area.

(ATOM) cosmos "wave count"Long form wave count would appear to be in trend with an entirely new cycle for Cosmos, potentially, although I did not go all the way back to the origin of the company which is necessary to get a true depiction of history. Is the history of a company based on short lived moments or is there any knowledge to keeping track of the trend of a company through the entire duration of the chart regardless of what trends occur based on major moments in society and the seasonal hype from December and end of year excitement,.
Many years in the making. . .

A Closer Look at Bitcoin's Elliot Wave PatternHello friends, today we'll attempt to analyze the Bitcoin chart using Elliot Waves. Our approach will involve using Elliot Wave theory and structures, which involve multiple possibilities. The analysis we present here focuses on one potential scenario that seems possible to us.
Please note that this information is for educational purposes only and should not be considered trading advice or investment tips. There's a risk of being completely wrong, so never trade based solely on this post. We're not responsible for any profits or losses. Individuals should consult a financial advisor before making any trading or investment decisions.
Now, let's discuss the Bitcoin chart. On the daily chart, we can see that a black primary degree wave has completed its ((4th)) wave, and the ((5th)) wave has started. Within the fifth wave, an intermediate degree wave is unfolding, which will have its own set of waves (1), (2), (3), (4), (5). The primary black degree wave five will be complete once the intermediate degree wave is finished.
We've drawn accounts on the chart, illustrating the entire structure, including the nearest invalidation level at around $76,666 and the real invalidation level below $50,000.
I hope this analysis based on Elliot Wave theory has helped you understand the chart better and learn something new. Please keep in mind that this is for educational purposes only.
I am not Sebi registered analyst.
My studies are for educational purpose only.
Please Consult your financial advisor before trading or investing.
I am not responsible for any kinds of your profits and your losses.
Most investors treat trading as a hobby because they have a full-time job doing something else.
However, If you treat trading like a business, it will pay you like a business.
If you treat like a hobby, hobbies don't pay, they cost you...!
Hope this post is helpful to community
Thanks
RK💕
Disclaimer and Risk Warning.
The analysis and discussion provided on in.tradingview.com is intended for educational purposes only and should not be relied upon for trading decisions. RK_Charts is not an investment adviser and the information provided here should not be taken as professional investment advice. Before buying or selling any investments, securities, or precious metals, it is recommended that you conduct your own due diligence. RK_Charts does not share in your profits and will not take responsibility for any losses you may incur. So Please Consult your financial advisor before trading or investing.

EUR/USD Key Levels – Watch Out! The EUR/USD pair is approaching crucial selling zones, signaling potential bearish pressure ahead! 🔥
📉 Price Action Insights:
A strong supply zone is identified, aligning with our bearish outlook.
Choch (Change of Character) confirms a shift in structure—indicating a possible rejection from higher levels.
If price taps into our selling zones, we could see a strong drop to the downside!
🔎 Plan Ahead:
Will sellers dominate, or will bulls regain control? Stay sharp and trade smart! 💡
💬 Drop your thoughts below! Are you shorting or waiting for confirmations? 👇

BTCUSDTAccording to this analysis, if the price reaches around $70,000 in a corrective structure with a time-consuming and low momentum in the form of wave F, it may grow to around $120,000 and even higher in the form of wave G.
But it seems that the ideal buying point is around $60,000 and the origin of the breakout node. In this case, of course, we will have a strong wave F, which means that we must be a little flexible in the possible targets of wave G.
In terms of time, late June, July and early August are the ideal time areas for the end of wave F, and late 2025 and early 2026 are the time areas for the end of the two waves G.

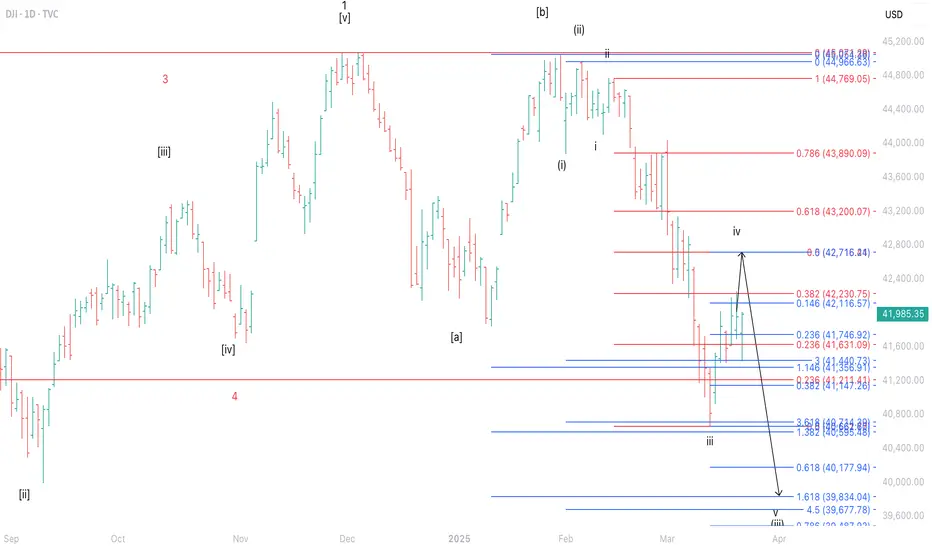
“DJIA Rally Continues, but Caution Is Advised for the Next Move”The current strengthening of the DJIA is estimated to be part of wave iv of wave (iii). Pay close attention to the potential short-term upside, as the index may retest the 42,230–42,716 area.
Russell 2000 Elliott Wave Analysis (WXYXZ in progress)Possible wave (ii) complex correction in the form of a WXYXZ still in progress.
Expecting corrective rally to fail around the 2200 resistance zone.
A final wave down from there should find a bottom around the 1900 support zone where wave (ii) should end.
Expecting wave (iii) to commence from there...
------
*would appreciate feedbacks and thoughts on this*
**this is not a trade recommendation, just an idea that I am working with**

“IDX Composite Index: Assessing the Depth of the Downtrend”The IDX Composite Index is expected to remain under pressure, forming wave of wave A. The nearest corrective target for the index is projected in the 5,879–5,975.
This outlook aligns with prevailing market sentiments, as Indonesia’s economic and political landscape has yet to support a trend reversal. Additionally, global sentiment remains negative, further weighing on the index.

UEC: Close to a Substantial Bottom? Bullish Outlook!The current pullback, which began in December, is still unfolding. Right now, the market is testing the white wave 2 support zone between $4.80 and $5.46, but the chart doesn’t yet look ready for an upside reversal. Even in the white scenario, a bit more downside is likely with some small downward moves still to come.
In the orange scenario, the price would likely form a larger 4-5 structure to the downside. If UEC breaks below the wave 2 low at $4.10 (a swing low from September 2024), the orange wave 2 scenario would take precedence, with support between $3.86 and $3.08.
Despite the short-term weakness, the overall structure remains bullish. Whether this is a smaller-degree wave 2 or a larger-degree wave 2 is still unclear, but the long-term outlook for UEC remains positive. I'm closely watching for an upside reversal, with the first signal coming from a break above $6.34.
