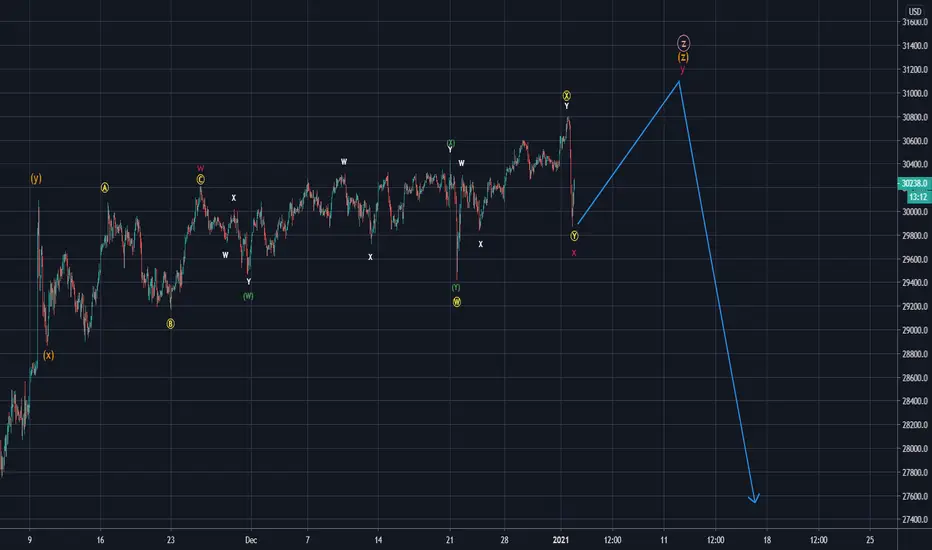
BTCUSDT going back to 43000 before new high?? ATH of BTC 61800 is not gonna break yet?
Yes, we're still in massive bullish price zone even retrace back to 43000! By applying elliott wave principle to the BTC market, we're currently on point B of the price correction zone.
Anyone may share your thought and tell me if i'm wrong? The chart drew according to the guideline of "Elliott wave principle key to market behavior"
Elliottwaveideas

GBPUSD Daily Timeframe With Elliot WaveHere is my continuation analysis in GBPUSD. In my opinion GBPUSD just completed wave 4. After completed 3 subwave A B C and hit Daily Uptrend and also i see a double bottom in in daily timeframe. Right now im focusing how GBPUSD will make wave 5. My analysis will be invalid if GBPUSD break below 1.3670.

Elliott Wave ExtensionHello guys :)
In the previous tutorials we have taught you what Elliott wave theory is.
In this tutorial we're going to talk about extensions.
we have an extension in either wave 1, 3 or 5.
Follow me for more tutorial.
Cheers :)

Elliott Wave TheoryThe elliott wave consists of three impulse wave and two correction wave. And each impulse wave consists of 5 waves. And each correction wave consists one ABC wave. And after all it consists one ABC wave. It's like the number 53535.
Follow me for more tutorials.
Cheers :)

SPX Elliott wave count daily. 101 probable count1/ This new idea is based on the previous idea below, rsi possible extended 1st wave like our spx. Nothing guaranteed
here just an amazing similarities (chart # 1).
2/ The previous idea is coming handy for "Gaps behavior " and how they usually appear in waves 3 & C. Well it kind
of supporting this idea of an extended 1st wave. Here it is below (chart # 2).
3/ Combining these together kind of make the argument for and extended 1st wave is more probable, or not.
4/ So what's next, well Elliott Fibonacci Retracement and Extension Guidelines for an extended wave 1 as follow:
If wave 1 is extended, then the size of wave 3 through to the end of wave 5 is often 61.8% – 78.6% relative to the size of wave 1
If wave 1 is extended, then wave 2 and 4 are very likely to be shallow (i.e. 23.6% – 38.2%)
If wave 1 is extended, then wave 2 will often end at the level of sub-wave 4 of 1 (i.e. the internal wave 4 of wave 1)
4/ That's would put the probable target for this bull's move since March's low between .61-79 fibs with
minimum requirement @ 4122:


Bitcoins Elliot Wave Formation..Good day & Welcome to another edition of FrancoBlanco's Dreams today my nightmares are confirmed Bitcoin is forming an Elliot Wave pattern according to my charts give me the benefit of the drought please don't judge me as a trader judge the sentiment of the market. And above all keep a close eye on the TOTAL & TOTAL2 Market caps. I'm a long Term Bitcoin Bull by the way. Happy Hunting Fellow Traders. PS This is by no means investment advice. Please do your own research.


Price targets for Wave up from 11k.NOT a professional, just a person who loves TA and is very very good at pattern recognition. Do your own due diligence and make your own decisions. This post is only for speculative/educational purposes. Consult a professional if needed. Good luck trading!
If this post saved or made you money, please consider tipping and/or commenting as I lost a decent amount trying to trade this before I realized what was happening. I have another published idea which further explains things.
-Wave is doing a large correction (prediction made 12am Feb 21) to 39500
- Wave 5 of higher Wave 3 is ending Diagonal, causing deep correction to 39600 (top of wave 1, it will finish below that if entire large wave is leading wave)
- Predicting entire leg up from 11k is a leading diagonal.
- Complete wave prediction: 77240 (could be less entire large wave IS a leading wave, as wave 4 will finish inside wave 2 area. Add 19700 to end of wave 4 to find wave 5.
-Wave 5 will extend past wave 3 guaranteed.
-Wave 3 was 68% of wave 1, applied same % to wave 3 to predict wave 5 (don't know if there are known numbers for this.


Potential Long SwingTrading Opportunity on $W Wafair IncBrief video setting up a potential Long Swingtrading opportunity on the Wayfair Inc Stock using our Elliottwave Indicator suite.
Main focus in this video is using all the tools to measure the wave 4 profit taking pullback. Then looking at a sensible entry strategy for that high probability 5th wave move.
If the stop for the order is broken, we cancel, and wait for support to be found. If support is then found and all of out tools for measuring the wave 4 are sill looking good, then we adjust and setup the trade again. If not, then we must have the discipline to walk away from the trade setup.


Trading The Behaviour with Stocks - ETSY perfect exampleIn this quick video recap we discuss using our ElliottWave Indicator suite when trading the behaviour of stocks after profit taking pullbacks. As they say, when its trending - its trending. You just need a set of tools to measure the behaviour in a simple and consistent way. ETSY is behaving very well this last 12 months and is a great example of trading the 5th wave move of an elliottwave sequence.

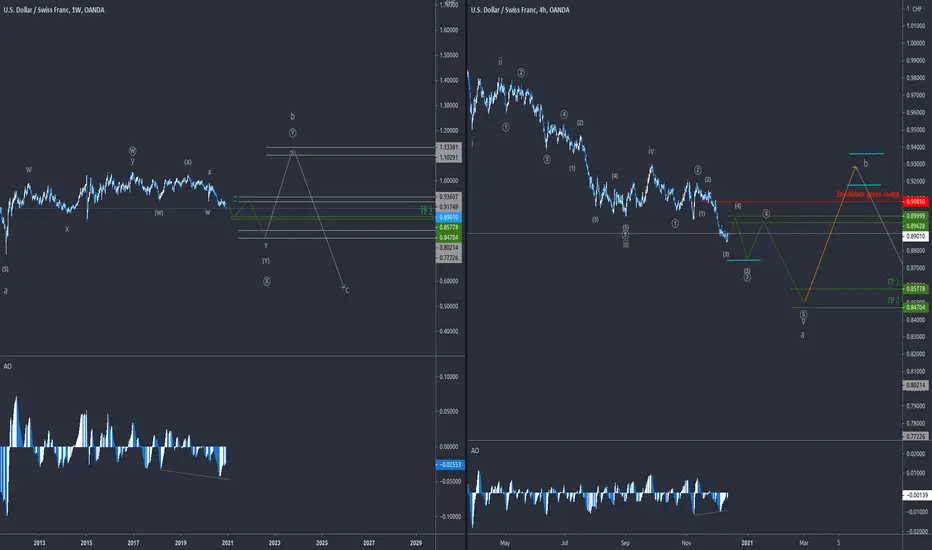
USDCHFAdmittedly, this pair is basically not too nice to count. I still did my best and this is the most likely count for me at the moment. What must of course always be taken into account with the corrective count is that the market can always still attach another corrective pattern. So the movement can be counted finished, but if it's really finished, only the future will show. It is possible that the 5 circled in green forms a Zig Zag and is therefore not yet finished. The target for this scenario would be 0,8721.