Elliottwaveideas
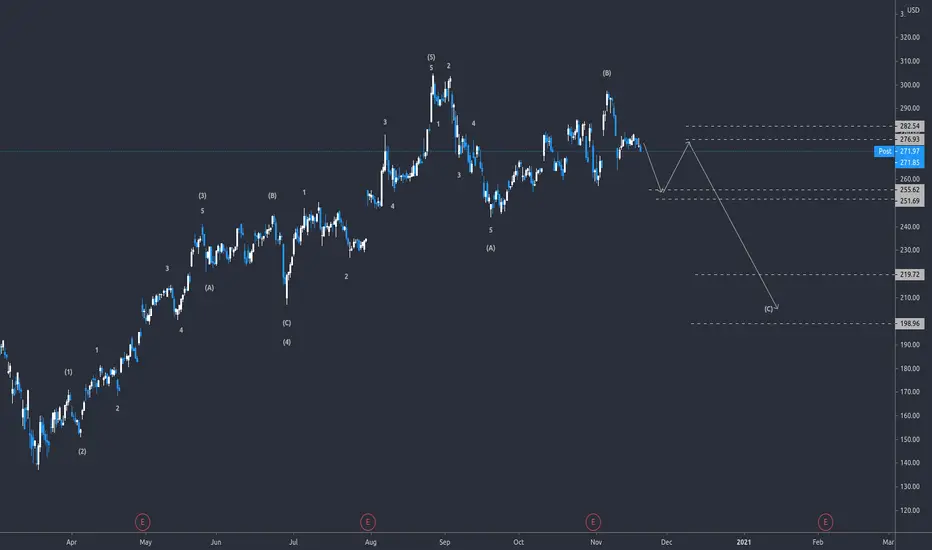
A discount or ?Still Bias on A Rally in GOLD
Looks like a zig zag forming giving more buy opportunities


Bitcoin is yet to reach a top, here’s whyHello Traders! Welcome to today’s analysis on bitcoin, I hope you’re doing good
From our last analysis on bitcoin, we tried to forecast a downtrend which didn’t quite play out because our wave c fib ratio exceeded 1.236 ideal extension for a wave c, which gave us more insight that what we called a wave c earlier is an extended wave 3, that was why I updated the idea with a note “trade closed manually” few hours later
So, where are we now?
Wave 3 gave an extension beyond 2.618 fib extension level which is the usual for btc, and that leads to a truncated 5th most times.
We saw a massive rejection very close to 20k region down to lower 18k, in wave 4, and the current structure may lead to a truncated 5th. Usually with truncated 5th, we have a long-term consolidation in wave 4 forming ABC corrective structure. Having a closer look at smaller timeframe, wave 4 seems to be forming a flat correction.
What is a flat correction?
Flat correction is one of the simplest corrective structures with 3 wave structure labelled ABC. The difference between a flat and zig zag correction is the amount of sub waves. While flat correction gives a smaller 11 sub-waves, zig zag gives 13 smaller sub-waves. The usual convention for a flat correction is 3-3-5 ABC waves
In this case, we had 3 waves complex correction in a, and waiting for the 3rd sub-waves in b to be completed before the final push downward in form of a wave c. The ending point of the last sub-wave in b will determine what kind of flat we get, if we close around the last high close to 20k, we’d call it a regular flat. If we close above 20k, then we’d call it an extended flat.
We can expect some rejection around 20k or slightly higher to complete wave c of the flat correction. If otherwise, I’ll post an update on that.
Conclusion: usually truncated 5th comes with a lot of scalping opportunities because of quick swings back and forth, just don’t get caught in the middle. We won’t be holding our positions for long we’ll be scalping the waves along.
If you’re don’t like scalping and you got an entry in mid 18k you can leave it open till we break above 20k. I’m forecasting mid 20k as the ending point for the truncated 5th, let’s see how things play out.
This is a very detailed analysis which could play out throughout the week or maybe more, I hope you get the idea.
I’ll stop here for now and update you more as the structure unfolds.
Trade setup: we entered a long trade below 18k, and we’ll exit the trade around 20k region before the next swing down.
If you enjoyed this analysis, don’t forget to hit the like button, subscribe to this channel to get latest updates and signals on bitcoin.
Don’t forget to share your charts, questions and contributions with the community in the comment section below.
Donations via Trading View coins also helps me at posting more free trading content and signals here.
Thanks for your continued support as always
Trade Responsibly.
I’ll see you all shortly
Have a great week traders!
Thank you
Nueel_classic


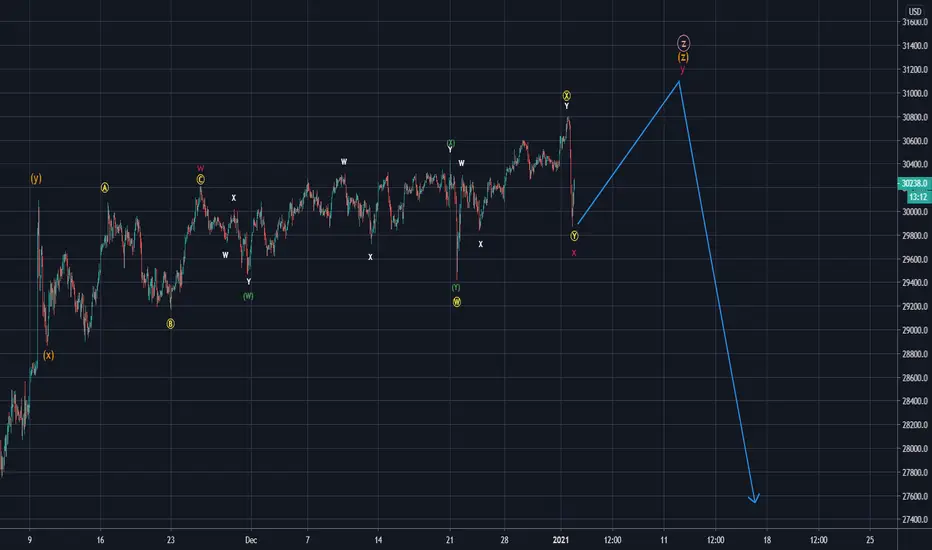
Bitcoin latest updateHello traders, welcome to today’s analysis. I hope you are all doing great.
From our previous analysis, we took a swing trade from higher 17k region to around mid 19k, sorry I missed an update earlier this week.
We reached the top on btc around 19.5k with a lower sub-wave truncation and got some massive rejection.
Wave truncations generally indicates that the market is over stretched and reach a top, but in this case we can call this a local top for btc if and only if we get some healthy corrections to the downside to keep the bull run in motion and eventually shatter the ATH another possibility is a change in trend which there’s no confirmation for that yet except for the fact that we got a double top with ATH in our last rally.
The correction can come in any form and I don’t want to be all speculative about it, but usually with btc, WXY correction is a common one.
The first level of correction we got is about 0.618(or 68%) retracement of wave 5(higher degree) impulsive move which is around 16k region, I labelled that wave w.
The second level of correction we would like to see which could turn out to be a major correction for the impulsive move we’ve been tracking from higher 9k to 18k region could lead us to around 14 or 13k region, which is a good spot for re-accumulation for a market continuation pattern. If it fails, then that could hint a change in trend.
We’ll be taking the corrective phase one at a time and try to be less speculative as possible.
Trade Setup: We expect some retracement to 18k region (.5 or .618 fib level) which I’ll call wave x to correct for the recent dip we had before a continuation to the downside. You can wait for this retracement if you don’t want to scalp to 18k
If you enjoyed this analysis, don’t forget to hit the like button, share, subscribe and stay tuned to this channel for more free updates.
Don’t forget to share your questions, ideas and chart with the community in the comment section below.
Donations via TradingView coins also helps me at posting more free trading content and signals here.
Thanks for your continued support as always.
I’ll see you all shortly
Thank you
Namaste! Traders
Nueel_classic


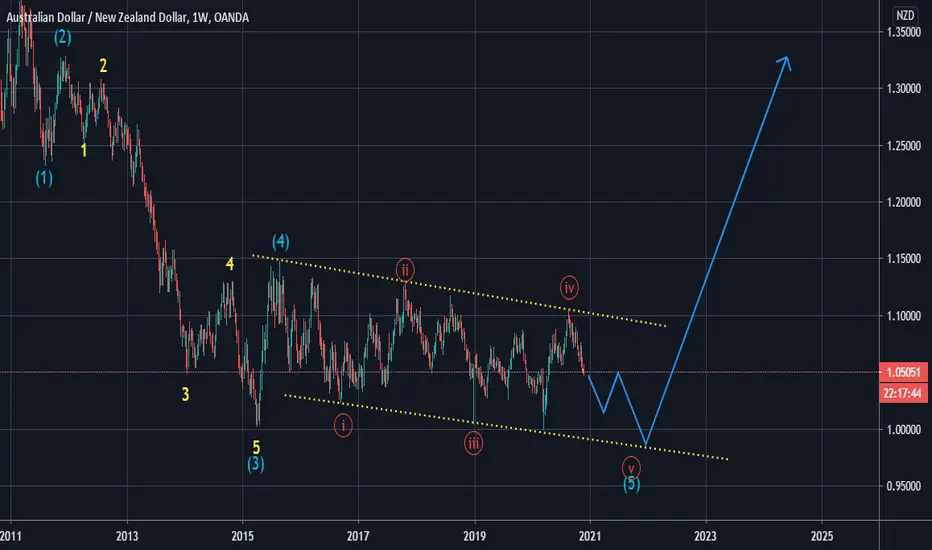

XAUUSDHELLO Traders here is a full forecast of GOLD aka XAUUSD for a long term bullish . Trade based on price Actions indicated on the charts. Let me know your forecast ideas in the comments section based on your stratergy so we can learn each other.

Bitcoin Short Update. Where can we call the TOP?Hello traders, welcome to today’s analysis. I hope you are all doing great
From our wave count, we know bitcoin is in wave 5 which is the final leg of the bull run, but predicting the top remains uncertain at the moment.
Currently, we just finished a triangle formation which I adjusted the label as smaller degree wave x2 or a sub wave 4. Since we agreed that the price is in the 5th and final wave, we need to take a closer look at the sub-waves to get more insight on predicting the top. The sub wave shows an extended 3rd wave, and the triangle formation hints at a further push to the upside and indicates that the top is close.
If we are right with our wave count, the last leg of the rally should push the price towards 19k or maybe close to 20k, a decline below the triangle (lower 17k region) would invalidate this possibility.
Conclusion: while the exact top of bitcoin cannot be accurately determined yet, the triangle formation hints we are not there yet but we’re very close. Bearing this in mind, be very careful with your long positions and use low leverage and smaller portion of your portfolio to manage your risk, I’m saying this because the top can give a very strong rejection in form of a dip because of the overstretched nature of the market and market makers trying to liquidate leveraged longs, it’s been a while we had a big correction which is inevitable by the way.
Trade Setup: we’ll be taking a long position from higher 17k and riding the wave up to lower 19k(our ideal target) or maybe close to 20k region adjusting our stop as the market gains momentum to protect our gains.
Ride the wave, see you at the TOP.
Hitting the like button and follow button helps me reach out to more audience, and it encourages me to create more value for the community. Don’t forget to share questions, ideas and chart with the community in the comment section below, let’s master the market together.
Donations via TradingView coins also helps me at posting more free trading content and signals here.
Thanks for your continued support as always.
PLEASE TRADE WITH CAUTION AND TRADE RESPONSIBLY
I’ll see you all shortly
Thank you
Namaste! Traders
Nueel_classic


