XAUUSD DAILY TIMEFRAMELower timeframe perspective attached down below.
Elliott Wave is high subjective, i will post if there's a new update on my perspective.
Trade safe, Everyone!
Cheers.
Elliottwaveideas

Part [A] Basic of Wave PrincipleElliott Wave background
In the 1930s, R.N Elliott identified the price of the stock trends and reversed a specific pattern. This pattern is repetitive in form and, the patterns have predictive value. He decided to use this pattern (Elliott wave theory) to predict the market. The Elliott wave is not primarily a trading system. It is a detailed description of how the market acts. The Elliott wave is part of technical analysis. Also, the Wave principle is the reassembled form of dow theory.
-Elliott Wave Principle The key To Market Behavior]
Waves in the market?
We all know that price never moves in a straight line. It will neither fall in a straight line nor rise in a straight line.
Price will create highs and lows. And this high and low creates waves. Elliott wave theory is all about counting waves and, we are going to use the Elliott wave to trade the market.
Now, the concept of waves is acceptable for you.
Elliott wave theory is made of 5+3= 8 waves.
Let me show you that structure in both trends.
In bull market ( UP Trend ) :
Figure 1.1 This is the Elliott wave structure in an uptrend. As we discussed, Elliott's wave theory is made up of 5+3=8 waves. Where five waves move with the trend and three waves move against the trend.
In Bear market (downTrend)
Figure 1.2 This is an example of Elliott wave theory in the Bear market. We can see that five waves move with the trend and, three waves move against the trend.
Take a deep breath, I know you have lots of doubts in your mind. Let me solve some.
1. Elliott wave theory works in any time frame.
2. These 5+3=8 waves will give us a market edge. It will provide strong trends & trend reversals.
3. The accuracy of Elliott wave theory is 84% of you are using the wave principle correctly.
Practical Example of Elliott wave theory :
In the Bull market :
Figure 1.3 This is the TATA MOTORS 4 hour timeframe chart. I used bar charts because It is easy to recognize Elliott's waves in bar Patterns. Well, it works for me to recognize if you feel that you can recognize patterns in another chart, go ahead with bar charts!
In Bear Market:
Figure 1.4: This is the ITC daily time frame chart. It shows the beautiful Elliott wave structure in the Bear market.
Elliott wave structure :
Now, we all know that Elliott is made of a 5+3= 8 wave structure. So, Let's start getting into it!
To understand the wave principle, we have divided the wave structure (5+3=8) into two Phases which are an Impulse phase/structure & a corrective phase/structure.
Figure 1.5 This picture illustrates Two phases of the Elliott wave principle.
The impulse phase is made up of 5 waves and, the corrective phase is made up of 3 waves.
Figure 1.6: This picture divides the wave principle into two phases.
1. Impulse phase/structure ( which includes five waves and, which moves with the trend you can see in bull market impulse phase is going upward and in a bear market, impulse phase is going down which is directional move.)
&
2. Corrective Phase/structure ( which includes three waves and which moves against the trend, you can see that in bull market corrective phase is going downward and
In bear markets, the corrective phase is going upward, which is a counter-trend move.
Figure 1.7 , Elliott wave has 2 phases. motive/Impulse phase ( directional move ) and corrective phase(counter trend move). We can divide these 2 phases into two types of waves. Impulsive waves and corrective waves.
Let’s zoom in on the impulse phase to understand the underlying structure and wave behavior.
Motive/Impulse Phase :
Important things about the impulse phase
1). Motive/Impulse phase is a Five wave structure that includes wave1,2,3,4 & 5.
2). motive/Impulse phase is a directional move ( moves with the trend.)
3). The Ending point of the impulse phase is the starting point of the corrective phase.
4). motive/Impulse structure is powerful than corrective structure.
5) Impulse phase can divide into two types of waves
i) Impulse waves: 1, 3,5 ( move with Trend of impulse Phase )
ii) Corrective waves: 2,4 ( Moves against the trend of Impulsive Phase)
Let me give you a quick understanding because we are going to cover these waves in-depth,
Impulsive waves are trend-following moves. We can find this type of wave structure in both phases. Impulsive waves create trends. Impulsive waves are (1,3,5,A,C). Corrective waves are counter-Trend moves. We can find this type of wave structure in both phases. Corrective waves provide pause to continue the trend,
Corrective waves : (2,4,B)
Motive/Impulse Phase in Bull market
Figure 1.8(A) , wave 1,3,5 is an impulsive wave of impulse phase because The trend of impulse phase up and, Impulsive wave are following the trend and heaving upward move.
And
wave 2,4 is the corrective wave of an impulse phase because the trend of the impulse phase is up but, the corrective wave is moving down, which is against the trend.
Figure 1.8(B) , wave 1,3,5 is an impulsive wave of impulse phase because the trend of Motive/impulse phase down and Impulsive wave are following trend and heaving downward move.
And Wave 2,4 is the corrective wave of an impulse phase because the trend of the Impulse phase is down but, the corrective wave is moving upward, which is against the trend.
Corrective Phase/structure :
Important things about the impulse phase
1). The Corrective Phase is a three-wave structure that includes waves A, B, C.
2). The corrective phase is a counter-trend move ( moves against the trend.)
3). The Ending point of the corrective phase is the starting point of the Impulse phase.
4) correction phase can divide into two types of waves
i) Impulse waves: A, C ( move with Trend of correction Phase )
ii) corrective waves: B ( moves against Trend of correction Phase )
Corrective Phase in a bull market:
Figure 1.9(A) : wave A, C is the impulsive wave of the Correction phase because the trend of the correction phase is down and Impulsive waves are following the trend and heaving downward move.
And
Wave B is the corrective wave of a Correction phase because the trend of the Corrective Phase is down but, the corrective wave is moving upward which is against the trend.
Figure 1.9(B): wave A, C is the impulsive wave of the Correction phase because the trend of correction phase Up and Impulsive waves are following the trend and heaving Upward move.
And
Wave B is the corrective wave of a Correction phase because the trend of the Corrective Phase is Up but, the corrective wave is moving down, which is against the trend.
Impulsive wave structure:
1. Impulsive waves are directional moves that are bigger than corrective waves.
2. Impulsive waves create trends.
3. Impulsive waves are subdivided into five waves.
( that means wave 1,3,5, A, C which moves with the trend will have five sub-waves.)
4. Impulsive waves are easy to recognize.
(Impulsive waves can also be called motive waves)
5. Ride of impulsive wave can give us a high probability trade setup with high Rewards
We are going to cover impulsive wave formations in the next part.
(diagonals,extensions,Impulse,Truncation)
Figure 1.10: As we discussed, Impulsive waves subdivide into five waves.
Here wave 1,3,5, A, C has five subwaves which you can see in the chart.
See you in the next part.
@forextidings

How to Count Waves Using Chart Patterns?We can count waves using traditional patterns like Head and shoulders, Double Top and Bottom,
Triangle, cup & handle, etc. This article is about how you can count waves by identifying chart patterns.
I have covered Three chart patterns in this article,
1) Triangles
2) Head and shoulders
3) Double Top and Bottom
1) Head and shoulders:
In addition, the two lows formed when the price failed to rise and fell back down were basically at the same level. The horizontal line is often referred to as the "neckline" When the price fails to fall back for the third time neckline will break. So "head and shoulders" was officially established.
Changes in volume with head and shoulders:
During the formation of "head and shoulders", the left shoulder has the largest volume, the Head has a slightly smaller volume, and the right shoulder has the smallest volume. The phenomenon of diminishing trading volume shows that when the stock price rises, the chasing force is getting weaker and weaker, and the price has the meaning of rising to the end.
Operation plan after the Head and shoulders appear:
When the head and shoulders formed, you can decisively follow up the short order. The formation of the head and shoulders indicates the beginning of a new round of decline in the market, and the minimum drop is the distance from the head to the neckline. The profit is very substantial. Therefore, studying the formation of the Head and Shoulders is also a necessary analysis process for band enthusiasts.
Wave Count:
The left shoulder: wave 3/A.
The first touch on the neckline: wave 4/B
Head: wave 5/C
The second touch on the neckline: wave A/1
The right shoulder: wave B/2
The ending point of the right shoulder: wave C/3
2) Triangles:
These are the most commonly used triangle patterns. In this motion, we are going to understand the triangle in terms of the Elliot wave. We'll be talking about the classical triangle pattern in an upcoming educational series.
Wave Count:
A triangle forms in corrective waves. There are Four corrective waves in Elliott wave theory. The corrective waves are 2,4, B, and X.
There are four waves in a triangle which are A, B, C, D, E.
The starting point of wave A of the triangle is the ending point of impulsive wave 1/3/A/W. After the completion of wave E of wave 1/3/A/W, the Impulsive wave will initiate.
3) Double Tops and Bottom:
In the chart, you can sometimes see the stock price fluctuations. The stock price fell back after reaching the highest price. After some sorting, it rose again to near the previous stock price level and then fell back. Two "normally highs" The high point is formed on the circuit diagram and will not be seen again in the short term.
Wave Count:
In a Bull market, The first Top of the pattern represents the completion of the impulsive wave. The ending point of the Impulsive wave is the starting point of the corrective wave.
I started the wave count from the first Top and labeled it as A, B, and C waves.
In a Bear Market, The first Bottom of the pattern represents the completion of the impulsive wave. The ending point of the Impulsive wave is the starting point of the corrective wave.
I started the wave count from the first Bottom and labeled it as A, B, and C waves. After wave C is complete, we can ride the impulsive waves.

AUD/USD: Technical AnalysisThe technical structure on daily chart is still very interesting, our short term setup has been corrected (see chart below), but now the pair is approaching an important long term resistance around 0.6880 area. That said, we still don't rule out some bullish consolidation in short term, but once the impulsive structure on 1H chart is completed, we expect an interesting corrective structure.
OUR SHORT TERM ANALYSIS SETUP
Trade with care!
Like 🚀 if my analysis is useful.
Cheers!

XAUUSD PROJECTIONElliott Wave is high subjective, i will post if there's a new update on my perspective.
Trade safe, Everyone!
Cheers

XAUUSD 4-H TIMEFRAMEElliott Wave is highly subjective, i will post if there's a new update on my perspective.
Trade safe, Everyone!
Cheers

Gold looking BEARISHGold has had a fantastic bull run since December 2015, however this trend may be due for a reversal ahead.
The Green wave 5 seems to have completed, so an entry on a short position can be taken at the current price of 1960.39
Further size can be added to the short if the price reaches 2068.32 as this could be the final push upwards before the reversal.
The weekly RSI is "bearishly diverging" meaning we are seeing higher highs in price with lower highs in the RSI, although in this case the highs in price are at the same level.
A conservative target that will commonly be reached is the 0.382 retracement of all 5 green waves at the 1641 level.
Given that this is on the weekly chart, this could take between 6-12 months to play out.
Entry 1 = 1960.39
Entry 2 = 2068.32
Take profit = 1641.51
Stop loss = 2185.85

NASDAQ DAILY TIMEFRAMEHere's my view on Nasdaq Futures on Daily Timeframe.
Elliott Wave is high subjective, i will post if there's a new update on my perspective.
Trade safe, Everyone!
Cheers

BNBUSDT BEARISH, Bulls be careful!This analysis is on BNBUSDT however, it relates to the market as a whole as all major crypto coins usually trend in the same direction.
This (A)(B)(C) Elliott Wave pattern indicates weakness from the bulls.
Wave (C) formed an "ending wave diagonal" where wave 3 is shorter than 1 and 5 is shorted than 3. This usually indicates exhaustion from the bulls and a reversal to the downside.
The red box indicates an area that would be good to enter a short position.
The green box is where previous support was found due to high levels of volume being recorded. The green box is also where (D) would equal 0.618 (the golden ratio) of (B). This is a common ratio for wave (D) if an ABCDE triangle was to form. In order to reach this level, the price would need to break below the upward sloping trend line.
I hope this helps you with your trading and as always, good luck!
Disclaimer: Not financial advice, intended for educational purposes only

DOW JONES FORMING BARRIERThis is a 15-Minutes Timeframe, in my perspective, Dow Jones currently forming a Barrier Triangle.
Elliott Wave is high subjective, i will post if there's a new update on my perspective.
Trade safe, Everyone!
Cheers

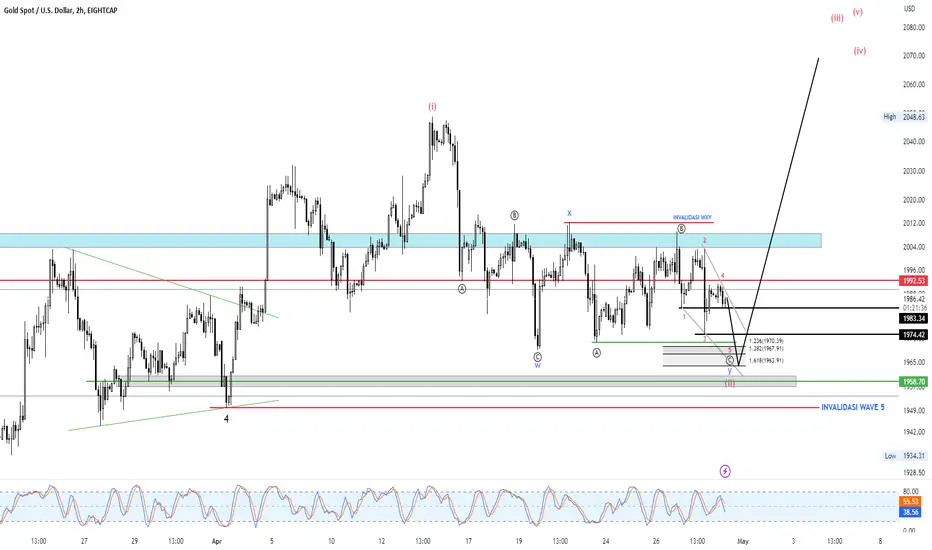
XAUUSD DAILY TIMEFRAME FORECASTI have tried many scenario on Gold, and i prefer this projection as my trading plan.
Invalidation level at 1949.77, means, in the short term Gold continue to bullish before making major correction on Wave 4 as you can see at the picture.
Elliott Wave is high subjective, i will post if there's a new update on my perspective.
Trade safe, Everyone!
Cheers

XAUUSD UPDATE (H-4 TIMEFRAME)Hi guys, here's an alternative of my projection on XAUUSD.
You can check 1st option on the link down below.
Elliott Wave is high subjective, i will post if there's a new update on my perspective.
Trade safe, Everyone!
Cheers

UPDATE ON XAUUSDHere's an update:
1st Scenario: Still on complex correction, the time XAUUSD hit all time high at 2078 was not a motive according to fibonacci (subjective), there's still a chance XAUUSD to go sideway until CPI or Core PPI release.
2nd Scenario: subwave v of (v) was truncated --> Ready for Major Correction.
I prefer to wait until structure and pattern formed.
Elliott Wave is high subjective, i will post if there's a new update on my perspective.
Trade safe, Everyone!
Cheers

XAUUSD BIG SHORTI still can't find the reason of XAUUSD continue to bull in my technical perspective, so here's my last update on XAUUSD.
You can wait until Daily/ Weekly Swing High formed.
Trade safe guys!

XAUUSD FORECASTI know almost all forecast on XAUUSD choose Triangle Scenario, So here's my perspective as WXY Corrective.
Elliott Wave's perspective is highly subjective, in my opinion, Invalidation Level is needed as all technical analysis is just an art of probabilities.
Safe trade, Everyone!
Cheers.
Please subscribe our Youtube Channel (Link on Profile) and follow Us for more contents.
BNBUSDT Short (Longer term view)Here we have a longer term trade for BNBUSDT shown on the daily chart.
The Elliott Wave pattern shown in the image is an "ABC" pattern.
Blue wave (A) moves upwards and consists of 3 waves: A,B, and C (in yellow).
Blue wave (B) moves downwards and consists of 3 waves: A,B, and C (in yellow).
In accordance with the theory, wave C in an ABC must end with 5 waves, which is what we see with blue wave (C).
Blue wave (C) also formed an "ending diagonal" which usually signals that a sharp reversal is due ahead.
Entry price 1 is so that the position can be entered in case we continue down from here and is at 311.03
Entry price 2 is there in case the market pushes higher one last time before moving down and is at 347.35
Be cautious not to over allocate capital at Entry price 1, otherwise your risk:reward ratio will go down to around 1:1
Profit target 1 is at 253.77
Profit target 2 is at 235.74
As always this is not financial advice and is only intended for educational purposes

Whatever you need to know about BTC sycle** IT'S NOT FINANCIAL ADVICE **
** SO PAY ATTENTION IT'S JUST MY IDEA ABOUT THE NEXT MOVEMENT IN THE CRYPTOCURRENCY MARKET **
------------------------------------------------------------------------------
Hello Guys
what's up?
Hope you feel great and always be happy and successful.
Today I want to talk about the Elliot cycle of Bitcoin.
it's really interesting.
so don't waste time and see carefully this Elliot analysis.
this analysis is about BTC in the weekly timeframe.
as you see we have two different parts.
in the first part, a huge bullish trend is obvious.
I drew the five main trend (Red Line)
and show you all the details you need to know. it's about minor waves(Blue & Black lines)
so after finishing 5th wave, I expect the market to correct. this correction contains three waves. we call it A, B, C
A is a downtrend wave.
B is up trend wave.
C is a downtrend wave.
The market started to downtrend from 69k to 15k as A downtrend.
at the end of the A wave (15500) we started an uptrend that we know as B.
and finally, we have a C downtrend to the support zone.
but there is a question, How high can the B wave rise?
well, well, well ... let me tell you.
we change the timeframe from weekly to daily. so we can see 35500-36000 is a very strong zone that causes to push the price in the previous movement to 69K.
at this time we lost this support zone and unfortunately, this support zone converted to a Resistance zone.it's really bad news. I expect the price to retest 32500-33500 and then drop. it means the B wave will be finished. and a new correction wave is beginning.
as I told you in the previous analysis we have three strong zones to support the price
this first one is 9800-12500
the second one is 7500-8500 and the Third one is 3800-4300
it means the target of the C wave is one of three support zone.
and if we close two days below the first support zone with high volume, the next support zone will be active.
please pay attention to money management and put stop loss in your trade.
I EXPECT YOU TO SHARE THIS ANALYSIS WITH YOUR FRIENDS AND WRITE YOUR COMMENTS BELOW.
Thank you so much in advance.

Bitcoin Wyckoff and Elliott WaveThis is the structure I have been discussing on Twitter, YouTube, and elsewhere since the June 2022 swing low. Wyckoff methodology indicates that it is likely accumulation. The Elliott Wave count may or may not be correct locally. We want to see an impulsive breakout above that ascending red dashed resistance to signal that the wave ((ii)) flat structure may be complete, but a breakout above wave (b) is required to add confidence to that count. Further breakdown has a target of the daily pivot. If the count is correct, then wave ((iii)) of 3 has a minimum expected target of $42350 from here. The Daily RSI is printing hidden bullish divergence at the moment, but we need confirmation that it is complete. The daily Stoch RSI has reset into oversold, so a breakout of oversold would add more support to the idea that wave ((ii)) is complete. We can also note the red parabola. While price remains above that curved line we should continue to expect higher, overall, rather than a larger pullback.
Let's see if we can get that rally from somewhere around this area.

XAUUSD - Long
As per my earlier post XAUUSD impulse down is completed and now price action is correcting the impulse in an ABC fashion in 5-3-5 pattern.
My target for this ABC is 2020. 2018 and 2030 are the .618%/.786% retracements from the impulse down wave from 2048-1969.
If we see any rejections on daily on these levels one can go short.
Trade Safe!

XAUUSD ShortHello Traders!
As you can see from the price action, XAUUSD is in sell mode as of now.
Currently we are in 5 wave impulse down with a target of 1971.

DOGEUSDT | Wave Projection | ABC Pattern TP +60%Wave projection combined with price action and chart pattern trading signal
> After a sideway breakout of mega falling wedge - the price pattern breakout of MA200 and made 2 false breakdown with a doubled bottom formation.
> A potential ABC uptrend pattern now retesting MA200 confluent zone support at key volume profile POC and golden cross MA20x50.
> If breakout successfully - TP1 @ 0.618 retracement +60% , TP2 @ 1.0 of Wave A +100%+
> Pullback Entry S1: MA200 - 0.80, S2: 0.74, S3: 0.68

NASDAQ PROJECTION ON 1ST WEEK OF FEBRUARYApex level as confluence of the Expansion WXY with the Triangle Pattern gonna be my sell zone. If price break 12750, consider to stop selling, might up to 135xx.

MICROSOFT (MSFT) Still going down?This idea is only for educational purpose, and just from technical perspective. I know nothing about the fundamental analysis.
