DIANA Shipping - Ending Diagonal Diana Shipping has an Ending Diagonal.
The ending diagonal is wave 5.
The pattern is active, this is mean that we have change in polarity
and the target is at least 38.2% Fibonacci.
Elliottwaveideas

NASDAQ in the C wave as expectedHello trader!
As you can see, the NAS100 keeps dropping exactly like what we analysed on 19th March.
Thanks to the Elliott Waves, we are now in the C of the ABC correction.
We are therefore in the C of the C.
We will then see another red week to go to reach the different objectives.
First objective: 12250/12173
Second objective (strongest) : 11720/11600. This one is the strongest because we will reach the 50% of the retracement of the 2 years of COVID, and also the 123% of extension

LICHSGFIN : READY FOR THE NEXT WAVE : ELLIOTT WAVE 3LICHSGFIN : After giving a breakout from a wedge pattern, It has completed it's first waves 1 & 2. Now ready for it's next move wave 3.
-Definitely not SEBI - Registered. So, this is only for educational purpose.

AARTIDRUGS ON HIGH! : ELLIOT WAVE FIVE - UPTREND AARTIDRUGS, after giving a breakout from wedge, looking for a breakout for the a,b,c, correction. One may enter after breakout and retest by following strict stoploss.
-Definitely not SEBI - Registered. So, this is only for educational purpose.

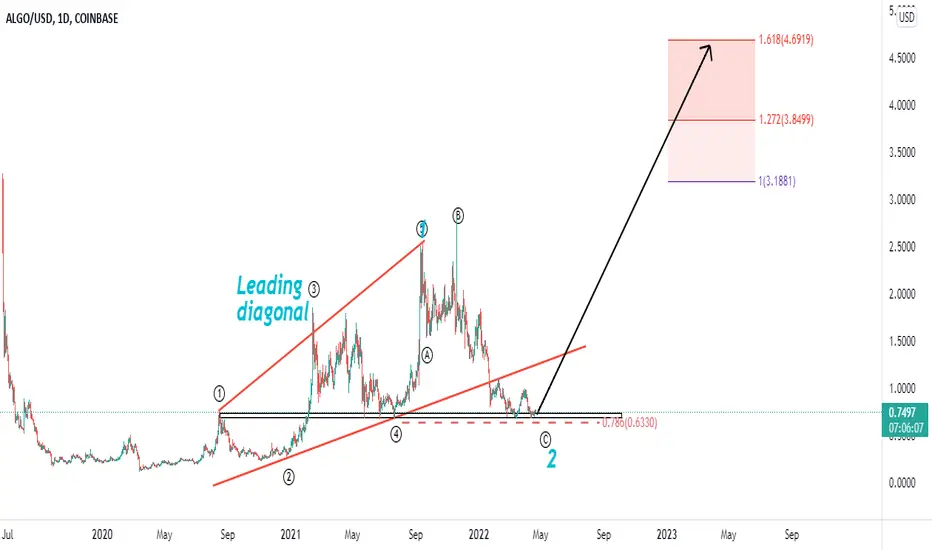
AlgorandAlgorand Technical analysis basically on elliott waves Principles and Priceaction Strategy
Algo can be grow to 5$
Wait and watch.
USDJPY Trade Idea - Elliott WaveLet’s discuss the price chart of the USDJPY currency pair based on the 480 minute timeframe.
From the Elliott Wave perspective, the price action appears to have completed Wave (5). The parallel channel also confirms this analysis. Additionally, most momentum oscillators are forming a bearish divergence pattern, which is typical at the end of fifth waves. Essentially the upside momentum is waning, and a downward correction is imminent.
From the Hurst Cycles perspective, the composite model line which measures the combined cyclical pressure, topped on April 1 (1st vertical line), and is projected to form a bottom on May 6 (2nd vertical line).
Based on this, we can expect prices to move lower from here. The actual sell confirmation would occur upon the breakout and close below the lower parallel channel. A Fibonacci retracement of 50% of the entire bullish impulse would be a likely support area.
If you find this analysis useful, make sure to press the “Like” button and Follow us.

GBPAUD Trade Idea - Elliott WaveLet’s discuss the price chart of the GBPAUD currency pair based on the 480 minute timeframe.
From the Elliott Wave perspective, the price has completed the 5 wave impulse sequence down on April 5. From that point, we have been trading higher in a corrective formation which appears to be carving out a W, X, Y pattern.
From the Hurst Cycles perspective, the composite model line which measures the combined cyclical pressure, bottomed on April 3 (green vertical line), and is projected to form a top on June 17.
Based on this, we can expect prices to move higher after the minor X (circle) is complete, which should be within the next few days or so at the latest. The price should continue until it reaches a distance equivalent to that traveled in wave W (circle).
If you find this analysis useful, make sure to press the “Like” button and Follow us.

Oh my sweet ADAWhat have they done to you?
From a higher timeframe prespective, ADA is in a massive downtrend and sadly, I don't think it is near ending.
However, locally, I do think we will see lower prices. After we do so, there is a very nice confluence zone, from which I expect a reaction to happen.
Minimum bounce of 10%. Who wouldn't take that?
BTC pair looks decent short term too ;)

GOLD - EW main count !! LongHello trader,
good mood and profitable deals! 💲
GOLD
2 hour chart
EW - Analysis
This is my Elliot Wave main count!!
EMA 10 - 13 - 20 and EMA50 in red are also geared towards EW.
EMA50 serves as a strong support. This should hold otherwise we should prepare for a stronger bullback or trend change!
I would like to mention that all I post are just options and my own opinion!
Always trade with SL, and do not risk more than 1% of your portfolio (max 3%) per trade.
➡️If you like my posts smash the like👍👍 button, comment or follow me.⬅️
Thanks for reading my ideas!

Gold in time frame 1hrHi
This is a elliott analysis for gold in timeframe 1 hr. Gold could be increase to 2100 in 40-60 days.
Now, 2000 resistance can be stop the large increase for one week and then.... .
Have a good trade

$ES1 ~ Bears gotta relax...I know, I know... Bears wants those shorts to print hard, but we are not seeing this in the forecast...
Expecting further upside soon...
Relax, Be patient, and EnJoY the Waves...

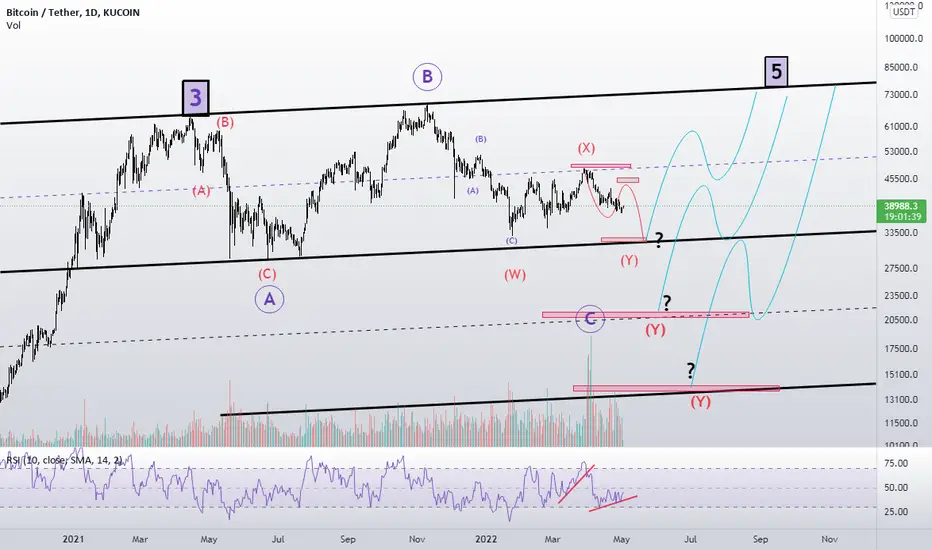
Bitcoin can go to 52k and fall Hi
In abc correction, we are in wave 5 of ending diagonal of wave c. Bit can touch the 52-54 resistance and must fall to 28k and beyond
Thanks for your attention
Have good trade

Elliott Wave AnalysisAs you can see the wave 2 just got completed, what do you guys think the next move? For me it will go to the moon the market is still bullish but the price action is bearish. Lets wait for confirmation to go long. Always use risk management when trading, do not fomo, do not be greedy and happy Trading everyone

S&P 500 MOMENTUM FRACTALS If MACD cross signal in daily chart, will synchronize with negative weekly momentum and monthly momentum

EURGBP Trade Idea - Elliott WaveLet’s discuss the price chart of the EURGBP currency pair based on the 480 minute timeframe.
From the Elliott Wave perspective, the price action has recently completed an ending diagonal triangle formation. The price is trading within Wave 3 (circle). The most recent retracement is approaching a 78% Fibonnaci level.
From the Hurst Cycles perspective, the composite model line which measures the combined cyclical pressure, bottomed on April 1 (1st vertical line), and is projected to form a top on April 29 (2nd vertical line).
Based on this, we can expect prices to find support at or near the current level and start trading higher towards the 0.8599 level which is the next major resistance area.
If you find this analysis useful, make sure to press the “Like” button and comment.

There are only a few certainties a man has in his lifeBut surely one of them is that BTC will bounce from one of these levels and go to 23k then. Which one will it be though? Place your bets guys ;)
Anything between 51-58k is a possibility
Take care!
THE BIG PUMP IS COMING!As you can see we are coming to WAVE 2 at 42000 - 41000 ( 1Day Timeframe) base on my Elliott wave analysis. Once its completed dont buy long immediately, always wait for a choch "Change of Character" inside of little timeframe ( 5mins to 30mins ).
This is just my analysis, always trade at your own risk.

Using Elliott Wave strategy in my TAAs you can see in my chart the wave 2 of elliot wave got completed. Lets wait for the price action and confirmation before to buy long. This is just my technical analysis I am not an expert.
Just wanted to share my ideas 💡

Very Short Term opportunity on ETH using Elliott WavesBYBIT:ETHUSDT
This is on a 15 minute time scale. The pullback that we have seen over the last day or so seems to be getting over. What we are seeing is an advance that might unfold in 5 waves as labelled on this chart. This should be followed by a decline in 3 waves (ABC). In case that happens and the price starts to move up explosively, I will look at entering a long trade at the top of wave 5, which might happen around the 3308 level, and a stop loss at the bottom of wave C of 2. The RSI also indicates a bullish divergence which is favouring the end of the recent pullback.

ABC Flat, wave 4 macro finished?I'm still having this possible scenario. The bullish structure of the new impulse upwards from January 24th is only valid if we don't go below these levels we are now. Losing them will send us at least to those low levels again to finish the 5th wave down of the ABC the correction.

GBPAUD: bearish outlookHello everyone
Before we start a discussion, it is my pleasure to read your opinion on this post's comment section and support this idea with your likes if you enjoyed it!
GBPAUD :
the price reached a Wave 5 and reacted well to the PRZ of wave 5. At the same time, this PRZ for W5 coincides with a strong resistant zone.
I show the daily chart below.
You can place a sell stop order below today's low or wait for a pullback at 4H time frame to short.

BITCOIN Range Trading - I do not trust the latest pump++++++++++++++++++++++++ no financial advice ++++++++++++++++++++++++
I reproduce my thought processes in detail in the video.
Summary: Still ranging!
Don't forget to like, follow and comment :)
Have fun
+++++++++++++++++++++++++++++++++++++++++++++++++++++++++++++++++
Contact me NOW if you want to have the following:
- ✍️ Analyzes every day – crypto and forex
- 📈 Our self programmed wavereader – a force in any market
- 🗣 Our personal trading setups
- 🥇 Education in Elliott Waves, Gann and more (videos and scripts)
- 🏆 Discussing trading ideas with our community, that we have trained
