As we Approach the 4307.50 target, a Reminder Seems AppropriateI’ve written about price heading to the mid 4200’s to low 4300’s for a while now. By my count, I’ve written a total of 4 times just in the month of September.
Links below:
Sept 15
Sept 14
Sept 8
Sept 2
The target moved up slightly following the Sept contract change to Dec from 4256 to 4307.50. As the analysis changed, I adjusted my targets. But I must be honest, this has been a difficult pattern to trade so far up till today.
From an educational standpoint, yes, I found some silver linings. Ones in which I feel will end up working in my favor in the future. However, I didn’t decide to write this article to announce to my followers how great of an analyst I am.
I did so to issue a reminder.
When price does finally come into the 4307.50 area…if we bounce impulsively higher in a 5-wave pattern, we may complete an abc correction to the downside and rally for the remainder of 2023.
However, if we breach 4307.50 to the downside for a sustained period of time, and price continues to move through the 4250 level. That is our first big clue (NOT CONFIRMATION) that we’re headed to 3200-3300 MINIMUM IN early to mid 2024...
Just a friendly reminder.
Best to all,
Chris
Elliottwaveprojection

Emerging Markets Show A Corrective Decline For StocksEmerging markets show a corrective decline for stocks from technical point of view and from Elliott wave perspective.
Emerging markets chart with ticker EEM made sharp an impulsive rally at the end of 2022, which indicates for more upside after a corrective a-b-c setback that is actually still in progress since the beginning of 2023. So, for stock market support keep an eye on EEM chart, as they are in positive correlation.
With current slow down in the stock market, we can see it finishing wave »c«, but wave »c« has still room down to 61,8% Fibo. and 36-35 support area before market stabilizes.

My thought on $BTCMy first analysis that i publish here. Let me hear your thoughts.
I am open for any input.

GOLD: rebound in short term?From a technical point of view, on intraday chart we have an interesting support area just below 1900. If a bullish reaction appears, wait for the clear signal (wave A) and try to take Long position on pullback (wave B).
Trade with care
Like | Share | Comment
PREVIOUS SETUP

USDCAD: Corrective structure in short term?Many of you already know this big picture on daily chart, in the last few weeks we have been following this beautiful rally. Having said that, the trend is bullish on daily chart, but at the same time we don't rule out some corrective structure i short term. From a technical point of view, we have shown on the chart two potential areas useful for trying to take a short position.
As we said earlier, our view has been bullish over the last few weeks and we traded the rally thanks to our harmonic structure:
(click on chart below)
From a technical point of view, it could be interesting to look for some reversal pattern (bearish) on intraday chart, so if the conditions are right, we will publish our updates below.

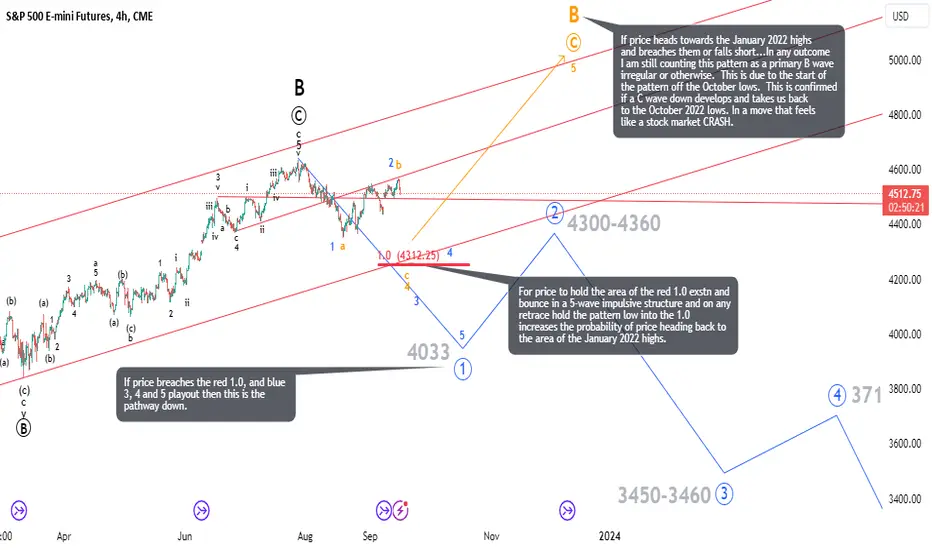
Weekly Update: Strap-In and be PatientToday, we have clearly started our descent down to the low 4300 level. I have posted about this sort of move for a while now. This move to the 4300 level will not happen in a day, nor do I think it will reach my target by next week. However, I do think this will be the type of descent that will not allow for good short entries.
That day has come and gone.
We now track a pattern that is in the very initial stages of carving out a 5-wave structure towards the low 4300. I offer one thing of support to those who are already short. This is now an incomplete wave 1 and should finish today or Monday...but if you think this is swift and scary...wait for wave 3. LOL
Best to all,
Chris
USDCAD: Rebound in short term?In the last few sessions we have seen an interesting consolidation on intraday chart. From a technical perspective, this bearish leg could also be a 12345 impulsive structure. That said, some corrective structure is possible in short term. In this specific case, the problem is not "if" we reach the Target, but "when" we will reach it and from where the technical rebound will begin. Target1 at 1.36 with long position accumulation strategy (Buy the Dip).
Trade with care
Like | Share | Comment

Weekly Update: Next Stop 4312.25The rally off the August 18th lows is an overlapping mess that stands a high probability of concluding very soon, if not TODAY.
However, yesterday's CPI report market reaction marked a unique opportunity to remind followers, that markets are not linear. You can choose to look at the CPI report positively through a bullish or bearish lense. The reality was the pattern forming prior to the release was overlapping and signaled traders were uncommitted to higher or lower price action. In my trading room we debated the micro pattern the night before and, in the end, we had nothing constructive to the downside, nor the upside. Therefore, it really didn't matter what the report said, we had no micro pattern pointing us down. The upside was well contained within a larger counter trend rally and that was because we had no impulsive pattern up either.
I commented in my trading room, "Does anyone still feel markets are moved by news or events"?
A hotter than expected CPI discredits the narrative the Fed may be done raising rates. Therefore, one would expect the markets to sell off.
But the opposite happened.
You can choose to embrace any narrative you would like to explain that sort of price action. You can choose to invest or trade based on your personal perspectives…all of those buys and sells create a pattern. In reality, traders were telling us prior to the release...there was indecision about market direction and therefore we remained mired in this consolidation.
But I do think market participants will get the memo shortly. That’s because outside of the micro patterns, the larger patterns are telling us we have a meeting at 4312.25 regardless of your narrative, or perspective.
…and attendance is mandatory. See you all at the meeting.
Best to all,
Chris

GOLD: Bearish consolidation in short term?Trend is bearish on intraday chart and Gold could consolidate this leg with some corrective structure (ABC or ABCDE Pattern). Having said that, we are following this bounce from 1907 area (daily support) and if it is limited to 1915 area, we cannot rule out the formation of a bearish harmonic structure.
Trade with care
Like | Share | Comment

GBPJPY 30 Minutes Timeframe Kindly remember, Elliott Wave is highly subjective, i will post if there's a new update on my perspective.
Trade safe, Everyone!
Cheers.

Bitcoin (BTC): Bearish below 25.600From a technical point of view, Bitcoin could trigger a bearish consolidation below 25,600, if this happens, the first level to reach will be the support around 25,000, and subsequently it could reach 23.9/22.9k area.
Trade with care
Like | Share | Comment

GBPUSD: Potential Corrective Structure or Technical reboundFrom a technical point of view, FX:GBPUSD pair is approaching a very important support area in short term, if from here some Reversal Pattern will form on intraday chart, it is possible to try to take a long position. If the pair will not form a corrective structure, at least a technical bounce should appear. Be careful, the trend is bearish, do not take a position if a clear signal (Pattern) does not appear, follow us.
Trade with care
Like | Share | Comment

INDUDINDBK - Triangle breakout / flat formationElliott Wave Analysis:-
View 1:-
Triangle was formed and breakout happened and waiting for the retracement.
Once retracement took place we can enter into the trade with safe trade setup with Stop loss @ 1396 .
target 1:-1500
target2:-1575
View 2:-
There is a Flat formation in 4the Wave. expanding flat is getting into picture. Wave B crossed wave A and waiting for the C wave to get retraced. According to C wave we can decide whether it is an Expanding flat or Running flat.
we have to wait for retracement.
For Triangle Setup :-
aggressive buyer can enter the trade right now with same stop loss.
Conservative trader can wait for retracement.
I'm not a SEBI registered advisor.
Before taking a trade do your own analysis or consult a financial advisor.
I share chart for education purpose only.
I share my trade setup.

Expanded Flat on BTC, C Wave (Impulse) Targets.The current correction on Bitcoin looks incomplete, but it's difficult to be certain if it's a flat or an expanded flat. If it's a flat, it's very close to complete, and a fast move up can be anticipated. If it's an expanded flat, then wave 5 of the C wave could extend.
I'm inclined to label it an expanded flat because the wave B move appears to extend more than 105% of the wave A move. And the recent price action, with long wicks to the downside, despite very optimistic news events, do not give a feeling of strength.

CBOT SOYBEAN : We maintain the same outlookThe soybean futures continues performing as anticipated. Wave B in place and the wave C in progress.

SP500 Is In A Higher Degree CorrectionSP500 has been bullish most of the year; a trend that can resume after a corrective pullback that is underway now, seen in wave 4 on a daily chart. However, wave 4 should then be made by three waves before correction can come to an end; which is not the case yet, as the recent bounce to 4492-4543 resistance area looks like a corrective wave, ideally wave (B), so be aware of more weakness after recent turn down. Ideally, wave (C) of 4 is now underway towards the lower side of a summer range. If wave (A) low is not going to be broken then wave four can also become a triangle rather than deep A-B-C drop.

USD/CAD: SomeHi everyone!
In the past few weeks we have already traded FX:USDCAD pair on the first trendline re-test, but at the same time this technical element could still be useful to us. The big picture on daily chart is harmonic structure followed by corrective structure with ABC Pattern formation.
✔ At the moment, we remain below an important resistance (not shown on chart), but if there is a bullish breakout during the first hours of trading, another bullish consolidation should appear, pushing the price to retest the trendline around the 1.3389 area.
✔ From a technical point of view and following the pair on intraday chart, it could be interesting to take a long position on pullback or corrective structure that will appear.
During the next hours/sessions, we will publish new updates, even on minor time frame in the section below, or visit our Blog for a more detailed technical analysis. Trade with care.
Analysis by
Anonymous Banker Team
Like | Share | Comment

Is BTC Headed to 2019 Bear Market Lows - SHORT -85%?In this video analysis, we dive deep into the current state of Bitcoin's price action. We'll explore the critical M formation that emerged in June 2021 and how Bitcoin is currently resisting its lower boundary. We'll also discuss the ongoing corrective b-wave within the larger wave C, examining potential upside targets.
Join us as we analyze key support and resistance levels, Fibonacci retracements, and Elliott Wave Theory to provide insights into where Bitcoin might be headed next. Our target zone of interest? The 2019 bear market lows, situated between $3,000 and $4,900, which aligns with the 1.618 to 1.272 Fibonacci levels of the preceding wave a.
Stay ahead of the cryptocurrency market trends with our in-depth technical analysis. Don't miss this opportunity to gain a comprehensive understanding of Bitcoin's potential price movements and make informed trading decisions.

Triangle burst Elliottwave pattern in Global EducationThe Global Education chart looks so good when it is making a triangle pattern.
The five waves such as the abcde of the triangle are complete and it is directed upward.
The move from here is near about 50%.
Play with your risk and you will earn good money on your capital.
Thanks

3M Company Is At Technical Support3M Company with ticker MMM has been trading bearish for the past 5 years, actually since the beginning of 2018, where we see a completed higher degree wave III.
The wave structure from 2018 highs is in three waves A-B-C, which indicates for a higher degree wave IV correction. We can now see it sitting at interesting 90 support area, especially if we consider equal wave length of waves A=C that stopped at the former wave 3 swing high resistance around that 90 area.
A recovery back above channel resistance line and 210 region would be definitely signal that higher degree wave V is in progress, which would send the price back to all-time highs.

EURUSD: Bearish consolidation in near term?Hi everyone!
Trend is bearish on intraday chart and an approach around 1.07 area is possible. Having said that, on 1H chart the pair remains under pressure as long as the Price Action stays inside the descending channel. From a technical point of view, it is possible to form a harmonic structure or a bearish impulsive structure with Target around 1.07 area. A bullish channel breakout would initiate a bullish corrective structure.
Trade with care
Like | Share | Comment

EURUSD: Short Term Buy opportunityFrom a technical point of view, the trend is bearish on intraday chart, but at the same time, the FX:EURUSD pair could trigger an interesting corrective structure. That said, with a short-term bullish view, it is possible to build up long positions and try to let them run all the way to Target 1. Don't forget that the Big Bears still have open short positions. This idea is just tactical setup, the main trend remains bearish at least for now. From a technical point of view, we are still awaiting the formation of wave A. We will expand on this idea in our next analysis or update.
Trade with care.
Like | Share | Comment

Bitcoin Is Approaching Support, While Finishing A CorrectionBitcoin made nice and clean impulsive five-wave recovery away from the lows, which from Elliott wave perspective indicates for a bigger recovery. However, after every five waves, there comes a three-wave A-B-C corrective slow down before the uptrend resumes.
Bitcoin dropped sharply recently, but the current leg down from 31k can still be part of a complex correction that has been underway since May of this year. It's ideally an A-B-C corrective flat pattern, where wave C can be now in progress, so we think that Bitcoin will stabilize, but probably once current wave C fully unfolds with the support around 24k-23k area. Lower, deeper strong support is at 20k.
