EUR/USD Forecast: Impulse Wave Progressing TowardThe EUR/USD is currently exhibiting a well-defined impulsive structure following the completion of a corrective (ABC) phase. The market has successfully formed waves (1) and (2), and is now advancing within wave (3), which typically carries the most momentum in an Elliott Wave cycle.
The ongoing rally suggests wave (3) is targeting the 1.15350 level — a key Fibonacci projection area that aligns with previous structural resistance. Momentum remains strong, supported by bullish market structure and sustained buying pressure.
Should wave (3) conclude near this zone, a brief corrective pullback into wave (4) is anticipated, likely retracing toward the 1.14440–1.14730 support range. This would offer a potential entry opportunity before the market resumes its higher trajectory in wave (5), targeting the 1.16077 level.
T1: 1.14857
T2: 1.15090
SL: 1.13867
Elliottwaveprojection

PIXELUSDTThe outcome of this analysis is that based on the structure of a zero - D wave, which may be a pig or triangle, or even a pig, we should look for the optimal areas to buy Spot …
In the event that this analysis is correct, it may be ideal to purchase Spot in the vicinity of Beijing to the tribes.
A cautious target for the Chinese outbreak and a more risky target could be a dollar casualty.
In time terms too, mid - June and more accurately the beginning of the third week of June would be the ideal approximate time for the start of the DC wave …
As indicated in the chart late July and early September are important times in the chart that will probably work depending on the structure and my guess is that the mentioned times are the ideal time for the end of the larger D - wave …

Elliot wave - Elopak This is my analysis of Elopak in Norway. We are facing a final push before we might see a potential correction

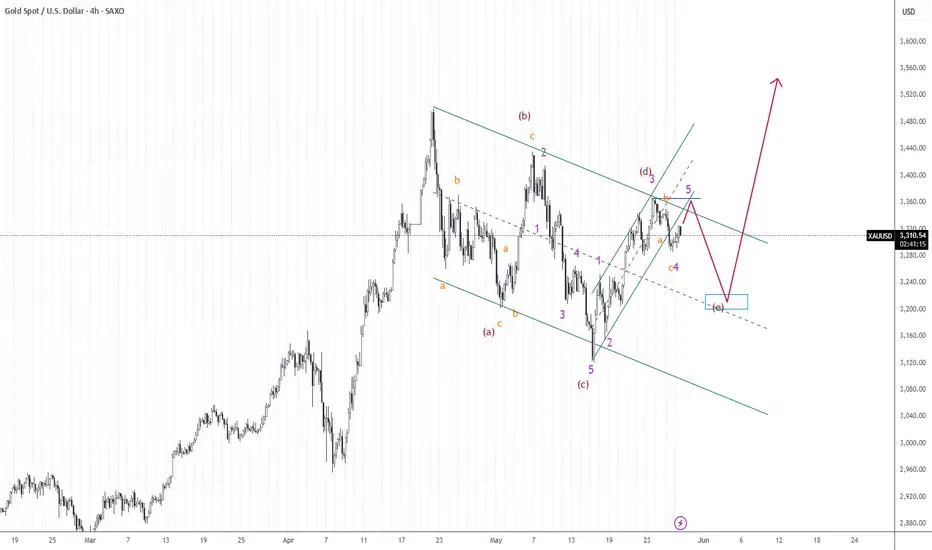
XAU/USD Elliott Wave Analysis: Gold Price Set for Drop to $3,240The chart for XAU/USD (Gold Spot vs. USD) on the 4-hour timeframe displays a potential Elliott Wave structure within a descending channel. The price recently completed a five-wave impulsive move upward, labeled as wave (d), suggesting a corrective move down to complete wave (e). A potential short-term entry point is identified near the top of the rising wedge at **\$3,360**, targeting a bearish pullback. The expected retracement may reach the **\$3,240–\$3,200** zone, where the (e) wave is projected to complete. This area aligns with the lower boundary of the corrective channel and prior structural support. After this correction, a bullish reversal is anticipated, potentially launching a strong rally towards **\$3,520+**, which serves as the long-term **take profit** zone. This setup presents an opportunity for traders to position short in the near term and long once the (e) wave completes, signaling the end of the larger correction and the start of a bullish breakout.
Solana(based on NEowave)I consider this as a triangle but under the price zone which is 139 it tells us its going to make a diamond diametrical.

Dow Jonas - Elliot wave📉 DJI — Elliott Wave Top in Sight?
🔍 A long-term analysis with serious implications...
I've been diving deep into the Dow Jones Industrial Average (DJI), using Elliott Wave principles — and what I see may signal the end of one of the longest bull markets in history.
Elliott was right — the massive bull cycle did arrive and extended well into the 2000s. But now, that journey looks to be nearing its final destination.
Currently, I believe we're witnessing the development of an Ending Diagonal pattern — a structure often seen at the end of a major impulse. This formation appears to be completing a set of blue sub-waves, which in turn cap off the larger green primary impulse wave.
📍 The box marks my anticipated top for the DJI. From this point, I expect a strong reversal and the beginning of a major correction.
Now here's the shocking part:
If this correction plays out in time and reaches the Fibonacci 0.382 level, that would suggest a retracement spanning up to 86 years — yes, 86 years.
This isn’t just about markets anymore — such a scenario could carry massive consequences for the global economy and society as a whole.
If, however, we see a strong breakout above the box, then the ending diagonal thesis would be invalidated, and we might instead be witnessing an extended wave 5 — complete with five internal sub-waves.
But either way — the top is coming. It’s just a matter of when, and how hard we fall.
💬 What are your thoughts? Could we really be on the edge of a generational peak?

Technical Analysis with Elliott Waves: A Combined ApproachHello friends, Welcome to RK Charts!
This Educational Post is based on technical analysis, specifically how to initiate analysis on a chart, and what points to consider. This is purely for Educational purposes.
This is not a trading or investing tip or advisory. Rather, it's a comprehensive guide on how to easily analyze a chart, intended for educational purposes. I hope that by reading and understanding this post, you'll gain valuable knowledge and insights. Your focused effort to understand this will surely provide you with something valuable and easy to grasp.
Let's dive in, During technical analysis, what we had observed certain points in this chart, I'm highlighting them here:
1. Resistance line breakout, where the price has closed above it.
2. The volume within that breakout.
3. The price closing above Weekly Exponential Moving Averages.
4. Elliott Wave Counts.
5. Projected Target along with Invalidation level as per Elliott Wave theory.
6. Projected Duration for Projected Targets.
Breakout of Resistance zone with Good Volume intensity:
So, friends, here we can clearly see on the chart that this is a weekly time frame chart of Shipping Corporation of India Limited. Over the last eleven months, from July 2024, the price has been falling, remaining largely bearish, but has now broken out of Curved Resistance Trendline for the first time with a bullish candle on Weekly (Closing basis), accompanied by good volume intensity.
Alongside this, the price has sustained and closed above Major EMAs:
- 50-Weekly Exponential moving average (red line plotted on the chart)
- 100-Weekly Exponential moving average (blue line plotted on the chart)
- 200-Weekly Exponential moving average (black line plotted on the chart)
on the weekly time frame.
Elliott Wave Theory:
Considering the Elliott Wave structure, if we look at it theoretically, the top it made on July 2024, was the completion of Wave III. After that, it completed Wave IV in 7 swings (WXY) and is now possibly moving higher, making higher lows. It has closed above the moving averages, broken out of the Curved Trendline, and has strong volume. So, possibly, we are unfolding an impulse Wave V.
In Elliott Wave Theory, the invalidation level means that the price should not go below that level, which in this case is the low of Wave IV at ₹130. If the price goes below that level for any reason, even by a single point, our wave counts will be invalidated, and we'll have to re-analyze the chart.
That's why we call it the invalidation level. Analysts and traders also refer to it as a stop-loss level. So, in Elliott Wave Theory, our wave counts remain valid as long as the price stays above the invalidation level and doesn't trigger it.
Now, regarding the target, if we take the measurement of Wave IV and calculate its 1.236 level, the target for Wave V should be above the high of Wave III. According to Elliott Wave Theory, the projected target for Wave V is near ₹440, which is the 1.236 Fibonacci level.
Projected Duration for Projected Targets:
In the chart analysis we conducted, where we prospectively projected a target, if everything goes right and the invalidation level is not triggered, what could be the duration of this target? It will definitely take more than a medium-term duration, maybe even a long-term duration.
This is because each candle represents a week, and we're currently looking at the weekly time frame. Since the fourth wave has just ended and the fifth wave is upcoming, it will take a long-term duration
I am not Sebi registered analyst.
My studies are for educational purpose only.
Please Consult your financial advisor before trading or investing.
I am not responsible for any kinds of your profits and your losses.
Most investors treat trading as a hobby because they have a full-time job doing something else.
However, If you treat trading like a business, it will pay you like a business.
If you treat like a hobby, hobbies don't pay, they cost you...!
Hope this post is helpful to community
Thanks
RK💕
Disclaimer and Risk Warning.
The analysis and discussion provided on in.tradingview.com is intended for educational purposes only and should not be relied upon for trading decisions. RK_Chaarts is not an investment adviser and the information provided here should not be taken as professional investment advice. Before buying or selling any investments, securities, or precious metals, it is recommended that you conduct your own due diligence. RK_Chaarts does not share in your profits and will not take responsibility for any losses you may incur. So Please Consult your financial advisor before trading or investing.

U.S. Dollar Index Set for Bearish Continuation The U.S. Dollar Index (DXY) has completed a five-wave impulse decline (labeled (1) through (5)) from the top of the descending channel. This downward move suggests a completed impulsive bearish leg. Following that, we’ve seen a complex corrective structure – a WXY double zigzag correction – now complete.
Price action shows a rejection from the upper trendline resistance near wave (2), confirming the bearish structure remains intact. The bounce into the corrective high (wave (2)) failed to break above key resistance, and we are now potentially entering a new impulsive move down labeled as wave (3) of the next larger degree impulse.
Primary Impulse Decline: Wave (1) to (5): Classic 5-wave move down ending late April.
Corrective Phase: Complex WXY correction (with subwaves A-B-C in both W and Y).
Current Wave in Play: Wave (3) of a larger impulsive sequence is initiating.
T1: 99.172
T2: 98.013
SL: 101.259
If price closes above 101.265 the current bearish impulse scenario would be invalidated.

Nifty: Correction aheadNifty is likely to correct lower towards 23400-23000 zone before resuming up.

ETH(based on NEowave)Im sharing this because wave D is at the end and in the next 2 month you can see the main movement which is the start of wave E.
wave E takes about 350-450 days but after that there is a big and longtime bearish wave!

SPY Green Light to All Time Highs?As VIX is sitting around 25, this is the first Monday in I can't remember how long we aren't gapping down at open! I'll take it! There is a ton on the calendar this week: jobs, first print for Q1 GDP, PCE, ISM mfg, and a ton of consequential earnings! Not to mention will we get a couple deals announced this week. Feels like India, UK and Japan are close. This could spur a market rally to continue! Did a ton of work on Elliott this weekend, but didn't create a video. Essentially, since we closed in the wave 1 of the red C leg (on daily and weekly basis), we have invalidated a chance of a fifth leg lower (thank God!). This means we are in first impulsive intermediate 5 wave that should go to all time highs (next Apr)! Since we already have two minute impulsive waves that were similar in size, we likely will finish the minor wave 3 as pictured and then since 1 & 3 of minor waves will be similar in size the impulsive 5 wave target will be as pictured as well. Remember it is simply the net of waves 1 through 3 times 0.618 and add that to the finish of wave 4 in either case. After wave 3, we will get a pullback, but this will be a buy the dip opportunity finishing the 5th wave around 580ish. After this we will get a deeper corrective wave but if sentiment is positive it may be shallow, only 38% to 50%, so will want to re-evaluate at that point! This is why it is important if you are investing not to FOMO, as there will be many opportunities to buy the dip!

Surge Energy (SGY) Elliott Wave Outlook26/04/25 SGY Update
I’ve been long Surge Energy since Jan 24. Price did move higher initially following my entry but has since ground lower in what looks like an ending diagonal pattern in red C of a larger ABC zig zag correction. There is RSI divergence on the weekly time frame which helps the case that SGY could be bottoming, but that will of course be effected by what the price of oil does.
Any further downside on SGY I will be looking at the yellow zone which contains the 786 retracement at $3.9, measured move target of the red A wave at $3.28 & 886 retracement at $2.64. There is an ending diagonal invalidation level at $3.2, if this is tagged, I will need to adjust the current count.
The completion of Red C will complete the (X) wave of the higher degree (W)(X)(Y) in yellow, from these levels the (Y) wave target will be $16-$17.

EURJPY: Short Setup with Target Zones in FocusEURJPY outlines a clear W-X-Y corrective pattern. Wave (W) ended at 161.297 , followed by an upward corrective move in Wave (X), which topped at 162.665 with a classic ABC formation.
Currently, the price is hovering around 162.084, likely forming Wave B of the final Y leg. A brief move higher could complete this B wave before the pair resumes its decline toward the 160.922–160.680 area, which marks the projected end of Wave C of (Y).
The broader correction is framed by two descending blue trendlines, providing dynamic resistance and support, while a short-term red ascending trendline is currently holding the price action but may soon give way. If the price stalls or rejects around the 162.3–162.5 zone, it could signal the start of the next leg down, making it a potential setup for short positions. After the reversal from Wave Y, potential upside targets are 161.600, 162.500 , and 163.100 .
We will update it soon!

#Bitcoin Future Forcast of Final moves towards #BullRunAs per Weekly Chart Analysis,
Bitcoin performing on the perfectly into #ElliottImpulsive waves and its #CorrectionWave and this time the 5th Cycle of Elliott Impulsive Wave was completed and last Correction Wave cycle will under movements.
Now, it is completed the 0 to A-cycle & performing the moves towards B-cycle around $84k to GETTEX:87K and after that final moves towards C-cycle for last Lower-Low point around FWB:67K -65k approx, and that will be completing around next 120-150 days with 0-A-B-C of this cycle around July-August approx..
While, from 0 to A cycle was its first movement point of Retest of lower point, after the Bitcoin's $109k #AllTimeHigh point was at 0 point and $76k is the direction of Point A.
Then, after the completion of this cycle of Correction Wave, Bitcoin's final BullRun movement will be starts around August onwards for next 120-150 days for this season last Bullish cycle to reach out min. $180k to $220k and max. Mark will be around $250k to $280k approx.
Thereafter, the #BearishZone of market will be starts next year, after completion of this Elliott Impulsive & Correction Wave pairings, which is completely starts from Nov. 2022 from its last Lower-Low mark up point of Bitcoin was $15.5k approx.
Anyways,
Study deeply always to perform any trade and take StopLoss strategy for that as well DYOR too...🙏

DIVISLAB: Eyeing Breakout from A-B-C ChannelDaily TF
DIVISLAB is nearing the completion of a complex W-X-Y corrective pattern. A long position could be considered after a breakout from the A-B-C channel, with potential targets in the 6100–6400 range.
I will update more information soon.

$XAUUSD Gold | Are We Looking at a Local Top Here?Looking at Gold again, I’m going a bit out on a limb and saying: There’s a good chance we’ve just seen a local top — at least for the coming weeks.
Last time I was pretty spot on with my target after being wrong about the top. I wanted to see $2,955, and Gold ended up reaching $2,956.5 — missing my level by just $1.50. Totally fine, especially considering the huge rally that followed.
But now it looks like that rally might be losing steam. We’re currently trading between the 127.2% and 138% Fibonacci extension levels, specifically between $3,225 and $3,250. That’s a zone I see as highly likely for a short-term correction.
Possible downside targets?
First $3,146, then lower at $3,034, and ideally even a move back toward $2,900.
Of course, a lot will depend on macro news, especially from the US — tariffs, geopolitical risks, and overall market sentiment. If Gold pushes above $3,300, then this whole scenario gets invalidated and I’d switch to an alternative setup that I haven’t detailed here yet.
The RSI is also sitting deep in overbought territory, with multiple bearish divergences building — which supports the idea of a pullback.
But as always: Just because the RSI is overbought doesn’t guarantee an immediate drop. We still need price confirmation.

A Zoom of the Weekly DXY into a Daily viewI kept the colored rectangels from my weekly analysis, to keep the focus and knowledge where we are on the chart.
DXY is doing a long A-B-C before it's is going into the last impulse og the C of Y of x of the larger degree.
It's quite a lot of corrections to manage, but if you swipe from the daily to the weekly timeframe, it makes good sense. For me at least :D.
The purple B wave took some time to figure out, but this was what made most sense to me. I was trying to look at it as a triangle, but that wouldn't have a good shape, so I ended out with this white ((w))-((x))-((y)) correction.
DXY is right now performing, what I see as, a extended 5th wave in the white ((iii) wave, before it goes into the white ((iv)) correction.
The white ((iv) wave correction could be become a long shallow drawn out correction for two reasons.
We had a steep and swift white (ii) followed by an extended white ((iii) wave. This usually means we are going to spend some time correcting that white (iii) wave and the rule of alternation tells us, if we have a quick 2nd wave, we are usually going to see a slow fourth wave.
I don't believe we have completed the white (iii) yet, so we have a long time to go still until that white (iv) wave is done.
When the white (iv) wave is done, the white (v) wave is probaly going to take us down to that green box.
So relax for the next 6 months and grab yourself a cup of coffee.

DXY In Difficult Circumstances Since the Start 80's I decided to give a go at the Dollar Index given the circumstances around the world. And to be honest, I tried to put on the positive glasses.
I believe the dollar has been in a complex correction since the mid 80's. Starting out with a large dump in '85 with the a-wave, the correction slowed down and only grew more and more complex.
Thought about current wave: What I believe we are going through now is, that we are finishing up the purple C-wave in a green (C)-wave. This wave can end at any time now, since it's now at the 61.8% fib level of the purple A-wave. But it might go down to the 95 level (The green box) to complete at the 100% fiblevel of the purple A-Wave.
But first we will have the fourth wave meaning the DXY is gonna struggle for some weeks. Because we had a swift two week wave 2, which means we are probably going have a slow fourth wave according to the rule of alternation. This mean the purple C-wave could drag out into the end of '25 into early '26.
This is also with that in mind that a C-wave most likely will take longer than an A-wave. These are the Purple boxes.
BUT, after this, DXY is gonna experience some happy years again, going back up to the yellow box somewhere between 110 and 120 to finish the WXY of x of the larger degree. This will take DXY into a couple of years bull-run as long as the green (C) wave runs and completes no earlier than late '27, depending when the purple C-wave prior to the green (C) wave ends. But I believe the green (C)-wave will take about two years to complete.
But after this, DXY could again go into some dark ages and considering the high degree purple w-wave took 23 years to complete (blue giant box), there is no reason to believe this high degree purple y-wave will be a swift matter and actually don't complete before the year 2050. And it will take the DXY all the down to start 60's or lower.
The reason I said I tried to put on the positive glasses, is that I tried seeing the white channel as a leading diagonal for a new bull run, but I just don't see it as such.
I also tried seeing it as a C-wave of a flat diagonal, but this would result in another C-wave afterwards, and also take us down to the 60's level. So that didn't do us any good.
For the sake of DXY, I hope I'm wrong, but this is how I see it.

CFD Gold Chart Analysis: Wave 4 in FocusHello friends, let's analyze the Gold CFD chart from a technical perspective. As we can see, the higher degree Cycle Wave III (Red) has completed, and we're currently in Cycle degree Wave IV (Red). Within Wave IV, we expect a Primary Degree ((A)), ((B)), and ((C)) in Black. Wave ((A)) has completed, Wave ((B)) is almost complete, and Wave ((C)) is expected to follow.
Within Wave ((B)) in Black, we have Intermediate Degree Waves (A), (B), and (C) in Blue. Waves (A) and (B) are complete, and Wave (C) is nearing completion. Once Wave (C) in Blue completes, Wave ((B)) in Black will end, and Wave ((C)) in Black should begin.
According to theory, Wave ((A)) came down and then wave ((B)) retraced upwards so now Wave ((C)) should move downwards, forming a zigzag correction. The equality level is around $2858. However, we don't know if it will reach this level or extend/truncate.
The invalidation level for this view is 3169.23. If the price breaks above this level, our analysis will be invalidated.
This analysis is for educational purposes only and not trading advice. There's a risk of being completely wrong. Please consult your financial advisor before making any trades.
I am not Sebi registered analyst. My studies are for educational purpose only.
Please Consult your financial advisor before trading or investing.
I am not responsible for any kinds of your profits and your losses.
Most investors treat trading as a hobby because they have a full-time job doing something else.
However, If you treat trading like a business, it will pay you like a business.
If you treat like a hobby, hobbies don't pay, they cost you...!
Hope this post is helpful to community
Thanks
RK💕
Disclaimer and Risk Warning.
The analysis and discussion provided on in.tradingview.com is intended for educational purposes only and should not be relied upon for trading decisions. RK_Charts is not an investment adviser and the information provided here should not be taken as professional investment advice. Before buying or selling any investments, securities, or precious metals, it is recommended that you conduct your own due diligence. RK_Charts does not share in your profits and will not take responsibility for any losses you may incur. So Please Consult your financial advisor before trading or investing.

XAG getting ready for another run down.I believe XAG has finished the blue ((c)) of green (iv) with an ending diagonal, and now doing the first 1-2 of the green (v) wave of gray ((c)).
The price might do a very small retrace to 31.12 before starting a 3rd wave down.
I believe the green (v) is going to the green box area at 28.15 - 27.40 area.
But I actually have a weekly trendline lower down, which the price might want to go won and test, which also fits with the idea that the (v) wave could go all the way to the 100% Fiblevel of (i)+(iii) level.
This would mean the price would probably test the 25.0 level.

My take on Gold. It's a difficult one..This is the read that makes most sense to me. And I have zoomed all the way into 15m, for you to be able to see my thoughts around it all.
For that wave down from April 2nd to April 7th to make any sense to me, I have labeled it as W-X-Y to complete (A). At first I had labeled it as a diagonal, but then price should not have retraced as much as it has since April 7th.
And I also believed Gold has finished a 5th of a 5th wave, so we need to see some more correction before price head to the upside again.
I simply can't read the retracement back up since the April 7th as a A-B-C, and this is why I believe price is just finishing up the A wave (and it might already have) before it goes into the B correction.
The initiated wave down (wave B of (B)) I believe will go down to 3,044 - 3,013 level and then finish of the flat with a wave C of (C).
This wave C should be able to go to the 3,130 - 3200 level.
But as I said, first we spend some days to the downside heading for that 3,044 - 3,013 level.
What is your current take on gold?

AUD/JPY Technical Outlook: Wave 5 Completion in SightIn AUD/JPY, the 4th wave has been completed, and the 5th wave is in progress. According to Elliott Wave theory, there is a high probability of the market continuing its downward movement.
Regarding potential targets, the price may reach 88.151 and 87.365 on the downside. However, a bullish move could also emerge if the market breaks above 89.645 .

Bearish Setup on NFLX: Correction Wave (C) UnfoldingTF: 4h
NFLX appears bearish at the moment. The corrective structure on the 4-hour timeframe suggests a potential decline. The current formation indicates that wave B likely completed at 998.61 , and the stock has now begun its descent into wave (C) of the correction.
The correction may extend to the 100% projection of wave A at 788.67 , or potentially deepen to 659.06 , aligning with the 1.618 Fibonacci extension of wave A. After the completion of wave (C), traders can buy for the target up to wave B at 998.61 .
I will continue to update the situation as it evolves.
