Broken Channel Support On EURUSD Can Cause Deeper Correction“USD is turning up vs EUR ahead the US debt-ceiling deadline. EURUSD pair breaking the trendline support“
The USD is higher while stocks are still somehow sideways. The reason for the higher USD can be optimism and speculation about US debt-ceiling. We expected that they will approve it, otherwise, this will cause a lot of damage on the financial market. Yellen has repeatedly warned that »failure by Congress to raise the $31.4 trillion federal debt limit could spark a “constitutional crisis” and would unleash an economic and financial catastrophe for the U.S. and global economies”, as reported by Reuters.
USD is trading higher with US yields, and it appears there can be more USD strength coming when looking at the EURUSD pair.
From Elliott wave perspective, every five-wave impulse from lows/highs suggests a change in the trend, but most importantly, after every five waves there comes a three-wave correction.
EURUSD has been trading higher as expected and reached a new 2023 high, where we still think that pair can have now a “temporary” failure break to the upside, which certainly can be the case as recovery seems to be slow and overlapping up from March 1.0517 low. So, latest leg up EURUSD from 1.0517 low, can be an ending diagonal in wave 5 of a higher degree five-wave bullish, which is also a very strong bullish reversal pattern.
Now that EURUSD is turning down, we can also see the pair trying to break out of an important Elliott wave channel support line after a bearish divergence between highs of wave five and wave 3 which is usaully the case at an important top of an impulse. That said, we think that a higher degree correction can be underway now with next ideal support for the EURUSD this year visible at the former wave (4), 1.05 support area.
Elliottwaveprojection

Weekly Update: Do the Little Things Matter? As an analyst, I often wonder if I get too much into the weeds (so to speak) at times. In the final analysis do those tiny details even matter? When you’re both a full time trader for profit, and simultaneously an analyst who shares one’s work publicly, often times distraction and multi-tasking is the enemy of discovery.
Hopefully, this is not one of those times.
It’s no secret I exclusively use MACD in my analysis. To use MACD properly is to know the indicator intimately. MACD, or moving average convergence/divergence, is a trend-following momentum indicator that shows the relationship between two exponential moving averages (EMAs) of a security’s price. The MACD line is calculated by subtracting the 26-period EMA from the 12-period EMA. The result of that calculation is the MACD line or Zero-Line. A nine-day EMA of the MACD line is called the signal, which is then plotted on top of the MACD line, which can function as a trigger for buy or sell signals. That's probably more than you ever wanted to know about the indicator.
Now in my analysis I do not use MACD as a buy/sell indicator. I exclusively use MACD as a means to guide me within my Elliott Wave analysis. In doing so I have to rely on the indicator to guide me with the following:
1. Is this an A-wave within a corrective structure, or a wave 3 within an impulsive structure?
2. Is the trend concluding or persisting?
3. Is the bottom or the top of a wave structure valid, or should I expect One More High or Low (OMH/OML).
Without observing the indicator in conjunction with my Elliott Wave count, I fear I would be inaccurate in my forecasts. To say MACD is essential to my price pattern analysis is analogous to saying water is essential to life. For me, I cannot perform one without the other. However recently I noticed some very small anomalies in the indicator while analyzing price action that I hope to remember to come back and check for validity.
in the above chart I notated two bottoms in price action and how the indicator reacted to both. As I track and report on each and every tick of the ES/SPX Futures, I noticed our recent breach of 4068.75 a week go to 4062.25 was not on positive divergence. Now anyone who would say I'm way to focused on a detail that in the grand scheme of things means nothing, would get no push-back from me. But is it really meaningless? Is it a clue? Is it the detail 99% of traders would miss, and in the end...is everything?
Truth is...I don't know yet. Time will tell.
The above chart I have manually stretched the MACD indicator, but unstretched and it clearly debatable the recent bottom may not have breached the previous MACD reading and since price has reversed, to the unobservant eye, we have what could be positive divergence.
So, how do we know?
To confirm this was not a mear over estimation of one's detailed orientated skills, the price action would need to follow through lower, without making a new high. Thereby confirming this MACD reading was no random reading worthy of being overlooked. RN Elliott postulated that price action is fractal across all time frames. That's interesting to me, because of this one singular MACD reading has chosen to occupy space in my brain so much that I'm now noticing the very same anolmolies in the micro patterns as well.
Nonetheless, I have a tendency to think positive or negative divergence is either confirmed or it's not. In my current mind, this is not up for debate. Now maybe I am proven wrong as time goes on, but even if that happens, this would not be an unworthy study in what confirmation actually means.
Therefore, I will continue to wonder, IF THE LITTLE THINGS MATTER.
Best to all,
Chris

XAUUSD UPDATE (H-4 TIMEFRAME)Hi guys, here's an alternative of my projection on XAUUSD.
You can check 1st option on the link down below.
Elliott Wave is high subjective, i will post if there's a new update on my perspective.
Trade safe, Everyone!
Cheers

BTCUSD | 1st ABC Correction A-wave Target ProjectionA potential bullish scenario : 1st ABC correction zigzag pattern with upcoming wave 5 of c-leg targeting 0.382 retracement of previous 5X motive wave move between 24-25K
However, wave 1 and 3 in c-leg are extended, wave 5 can be the shortest wave and truncation is still possible.
Action: A safer long entry can be placed when breakout downtrend line 2-4 or above wave 4 of c -leg, targeting the upper resistance of the bull flag.
Always trade with affordable risk and respect your stoploss!

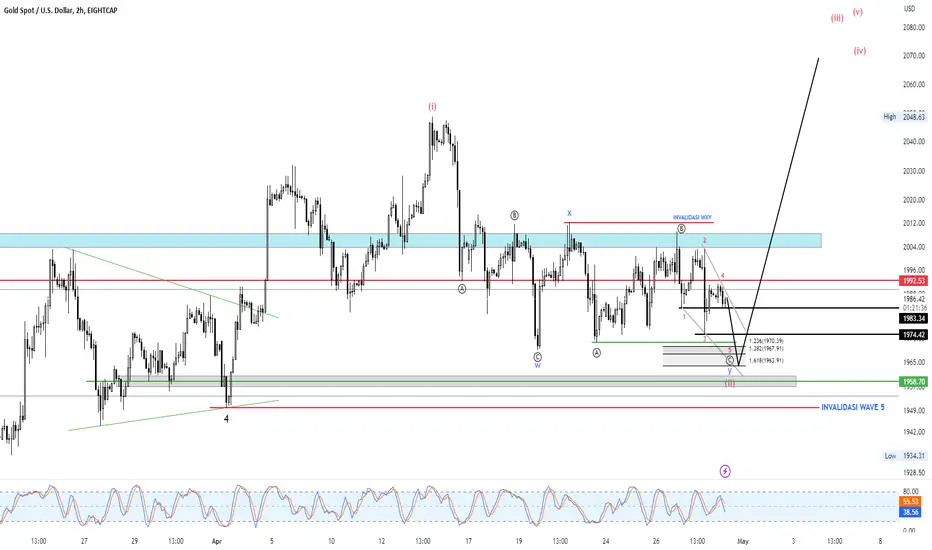
XAUUSD FORECASTI know almost all forecast on XAUUSD choose Triangle Scenario, So here's my perspective as WXY Corrective.
Elliott Wave's perspective is highly subjective, in my opinion, Invalidation Level is needed as all technical analysis is just an art of probabilities.
Safe trade, Everyone!
Cheers.
Please subscribe our Youtube Channel (Link on Profile) and follow Us for more contents.
Weekly Update: Stop Motion ChartsUnfortunately this week I do not have the time to do a deep dive into the ES futures...suffice to stay, if you like being entertained...go back and review my ES Chart posts over the weeks. It's like watching stop motion animation as the only that has changed on the chart is the price action.
PS: Next week I'll have more time to update my followers.
Best to all,
Chris

BNBUSDT Short (Longer term view)Here we have a longer term trade for BNBUSDT shown on the daily chart.
The Elliott Wave pattern shown in the image is an "ABC" pattern.
Blue wave (A) moves upwards and consists of 3 waves: A,B, and C (in yellow).
Blue wave (B) moves downwards and consists of 3 waves: A,B, and C (in yellow).
In accordance with the theory, wave C in an ABC must end with 5 waves, which is what we see with blue wave (C).
Blue wave (C) also formed an "ending diagonal" which usually signals that a sharp reversal is due ahead.
Entry price 1 is so that the position can be entered in case we continue down from here and is at 311.03
Entry price 2 is there in case the market pushes higher one last time before moving down and is at 347.35
Be cautious not to over allocate capital at Entry price 1, otherwise your risk:reward ratio will go down to around 1:1
Profit target 1 is at 253.77
Profit target 2 is at 235.74
As always this is not financial advice and is only intended for educational purposes


GBPJPY: Consolidation in near term?From a technical point of view, the trend is up but at the same time, some consolidation is possible.
Trade with care!
Like if my analysis is useful.
Cheers!

$BTC #BTC #Bitcoin Long-term Chart. Buy Setup #Elliottwave.This count is based on my assumptions so anything can happen not a trading or financial advice just for educational purposes only kindly do your own ta thanks trade with care good luck.

$BTC #BTC #Bitcoin #Elliottwave Buy Setup.This count is based on my assumptions so anything can happen not a trading or financial advice just for educational purposes only kindly do your own ta thanks trade with care good luck.

#BTC #BITCOIN $BTC EW ANALYSIS.This count is based on my assumptions so anything can happen not a trading or financial advice just for educational purposes only kindly do your own ta thanks trade with care good luck.

Getting ready for a retracementI am expecting a retrace on Neo.
Maybe one more month of correction before this goes parabolic.

NZDUSD: Bullish structure in play...From a technical point of view, the trend is bullish with potential impulse structure (12345).
Trade with care!
Like if my analysis is useful.
Cheers!

XRPUSDT LongThis is Elliott Wave Analysis that shows a potential long trade opportunity.
If Bitcoin breaks down sharply, do not take this trade, as the price will likely drop much further than shown in the image.
If the parallel trend channel holds, this could be a good trade. If you do take this, be ready to cut the trade if the market drops further than expected. It is best to not enter with a limit order, but manually enter using a market order if the market seems to hold within the green triangle buy zone shown in the image.
Entry: Between 0.4073 and 0.4000
Exit: 0.4337: profit target 1, 0.4581: profit target 2
Stop loss: 0.3792
Disclaimer: Not financial advice - intended for educational purposes only

Tesla Is Coming Into SupportTesla made nice and clean impulsive five-wave recovery from the lows that is now followed by a three-wave A-B-C correction, which from Elliott wave perspective suggests bigger recovery.
Tesla is now coming down into a support as mentioned few weeks back. Looks like wave C is now at the support, deeper one is 140. Invalidation level is at 102.

Elliott wave analysisThis idea is based on Elliott Waves that I have customized - don't forget the stop loss

⚠️CONGESTION ON THE BITCOIN NETWORK⚠️Hello TradingView, today I'm going to share with you a little bit of my opinion about BITCOIN network congestion as well as the possible impacts on asset prices.
To begin with, some classic headlines after this weekend were:
"Bitcoin drops 3% after “congestion” and suspension of withdrawals on Binance"
But many claim that what caused all this was the Ordinals protocol, which allows the storage of NFTs on the BITCOIN blockchain.
The cryptocurrency market dawned red this Monday, still shaken by a tense weekend caused by congestion on the Bitcoin (BTC) network and the momentary suspension of withdrawals on Binance, the largest exchange in the world by trading volume.
The slowness in the Bitcoin network is attributed to the growing popularity of the Ordinals protocol, which allows storage of non-fungible tokens (NFTs) in the cryptocurrency system. The project led to “massive increases in network fees and congestion,” Hayden Hughes, co-founder of social trading platform Alpha Impact, told Bloomberg.
What are the possible impacts of congestion on Bitcoin?
The biggest impact can be felt in the pocket of those who use the network. Especially when we talk about smaller transactions, after all, to transact in the first layer of the network, fees are much more expensive, thus making lower value transactions unfeasible.
Miners will see this impact positively. That's because, in addition to receiving part of the new bitcoins issued on the market, miners also receive part of the fees paid as a form of economic incentive... And yes, for the first time thanks to congestion we observe the first block that paid more in fees to the miner than the reward itself. Fees received were 6.75BTC vs 6.25BTC reward for being mined.
Now a positive point is that the current stress test can be important to imagine a large-scale adoption of BITCOIN and this will probably make the network stronger for the next battles that will arise!
Some people also see a positive impact on prices as: The demand for, and struggle for, space can also inflate the price of bitcoin. The reason is that, since the “tip” to the validators is paid in satoshis, the smallest unit of bitcoin, and the issuance is controlled, there may be a supply shock within the network itself, which in my opinion is a little less likely because many brokerages stopped withdrawals which pushes the asset price down.
OK, Now let's go to the charts, these are my target zones the first reading and also more classic and objective would be a test on the VAH combined with a VWAP anchored from the bottom of the market, so the ranges from U$25,110 to U$23,770 are relevant points for realization of SHORTs.
Now thinking about Elliott Waves,with the chart OKX:BTCUSDT
I believe in these possibilities here.
Context 1- ABC followed by 5-3-5 combo
This first correction can evolve into this variable here, if it is a longer wave in time!
Context 2 - Flat ABC and the market should continue rising strongly unless the new impulse fails and gives rise to an X wave, thus building a WXY combo.
But my main score is this

EURAUD Is Looking For Strong ResistanceBroken multi-year trendline support suggests that the Australian dollar will be doing much better than the euro in years to come. Despite recent recovery, we just see it as a corrective rally within downtrend with nice technical multi-year resistance.
Looking at the daily chart of EURAUD currency pair, we can see a three-wave higher degree (A)-(B)-(C) corrective rally after completing the leading diagonal at 1.43 area in summer 2022. By reaching projected August 2021 resistance within a five-wave cycle for wave (C), a bearish reversal can be near, especially if we consider a bearish divergence on RSI. However, keep in mind that bearish confirmation is only below channel support line and 1.5844 level.

EW ANALYSIS EXPERIMENTI've been doing a little reading on elliott wave analysis amd after an extensive period without any publishing. i'll be running a few back tests and then i'll start publisng on a regular basis.
this is just a little little wave count i did. trend is bullish. the wave count confirms it. i wam wait for that triangle/combination pattern to retrace into the fib areas then i'll start taking long from 13202.3 if price confirms.
i'll work on improving my analysis . comments,questions and suggestions are welcome.
thank you.

MY THOUGHTS ON GBP/USDIn my analysis on the 2 HOUR CHART, price is moving BEARISHLY, forming a Barrier Triangle Ending Diagonal. Price is currently at 1.25498, I forecast that Wave A may move to price 1.23957 which is 100% of Wave A. Then to price 1.23013 which is 1.50% of Wave A. and finally to price 1.22800 which is 1.618% of Wave A. I used the Elliott Wave and Fibonnaci for my analysis. FX:GBPUSD

AAPL | Wave Analysis | potential bulltrap expanding triangleWave Analysis with price action and chart pattern trading
>A potential bulltrap scenario with fake bb line breakout with d wave of expanding triangle in major wave III.
> wave d - targeting at price rejection zone 1.0 - 1.272 fibonanci extension of wave a
> wave e - tp1 small wave a of e correction pattern possible target 1 at 0.618 retracement of wave d @ ma50w zone
> completed major wave IV correction, targeting wave e tp2 small c of e leg correction bearish scenario at 1.0- 1.272 of wave d @ ma200w to complete.
> before moving into motive wave 5 @ 1.618 fibononci length of major wave I. 210 - 220 USD zone with an estimated +60 - 70% upside.
Always trade with affordable risk and respect your stoploss!
Good Luck

HEX back to ATH for Christmas 2023? Could be!I've got a feeling...
So, my call for Hex's bottom got a bit messed up as TV decided to re-generate the chart or something. That means my previous charts won't load, but my bottom target box was hit (check the related chart), and we've seen some nice moves since then.
With Richard Heart's ETH-Fork Pulse Chain launch looking like it's just around the corner, there's a bit of a fundamental twist to my analysis. But getting back to all-time highs is just what good crypto projects do, right? Why Christmas? Well, bull markets often have a wild festive period, even if they keep climbing later on. So, I thought, 'Why not? It's got a fun vibe to it.'
Now, the waves might not play out exactly as shown, but something along those lines seems likely. I've always relied on Fibonacci extensions for targets, and they usually match up well with previous levels when you look back.
Good luck and have fun out there!
