SP500 Short OpportunityHi traders,
SP 500 is in a corrective cycle that started at the beginning of 2022. We do expect further down to end the WXY corrective structure. This will create new lows and it will break down the 3480 level.
Considering that, we can take advantage of it by trading the end of B in the intermediate degree (blue) and riding the whole wave C before ending the corrective cycle WXY of wave 2 and starting the new bullish cycle.
Short potential idea:
Entry: 4144
SL: 4442
Target: 3210
Risk: max 2% of your account
Always keep in mind that risk management is, at least, as important as the entry-level or the SL. Remember the quote “If you do not manage the risk, you will not have any risk to manage”
The market is always repeating the same type of defined structures. There are only two main wave types: the motive wave and when the motive wave ends it starts a corrective wave. Within them, there are only 3 motive waves structures (Impulse, leading diagonal , and ending diagonal ) and 5 main types of corrective structures (ABC, WXY, Flats, triangle, WXYXZ (triple correction))
Learning them and being able to spot them in the price action graphs will completely change the way you trade as these structures will provide entry point areas, invalidation levels, and targets for the trade.
Have a safe and profitable trading day
Please feel free to express your ideas and thoughts in the comment section.
DISCLAIMER: This analysis is not intended to encourage any buying or selling of any particular securities. Furthermore, it is only the explanation of what we are going to do and it should not be a basis for taking any trade action by an individual investor. Therefore, your own due diligence is highly advised before entering a trade.
Elliottwaveprojection

MASKUSD: Elliot Wave 15minHello friends. According to chart we see the correction "abc" to reach the 2.66 price and then start downtrend.be profit... like and share.
Thanks..

$DXY #elliottwave $usd #usd #dxy.This count is based on my assumptions so anything can happen not a trading or financial advice just for educational purposes only kindly do your own ta thanks trade with care good luck.

TWTR | Wave Projection| Take Profit Position | Bear DivergencePrice action and chart pattern trading - The key area to watch
> The price is approaching the upper resistance channel and the target inverse head & shoulders pattern with a slight bearish divergence RSI signal.
> A possible partial profit taking zone and the price could retest its channel support SMA50 zone.

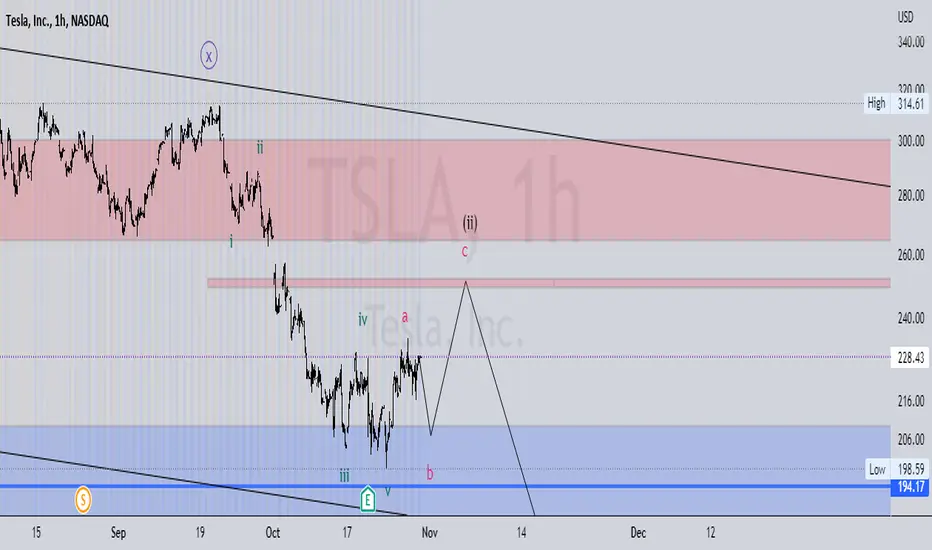
Tesla : Elliot Wave 1hrAccording to touching the monthly floor and the formation of wave A correction, we expect the formation of three waves b, and after that we will have a rise to form wave c, and then we will experience the fall.
ETHUSDT: Elliot Wave 4hrThe last wave of decline happens and it starts from this price. The 1st-2nd wave is completed and we are starting to fall in the third wave, so we open a sell deal and we will continue with it until 600-700 dollars.

ATOMUSDT: Elliot Price Action 4hrHello dear friends. In this currency we see the end of correction wave and we expected start downtrend and this price very very important shown at the chart .be profit... please like and share

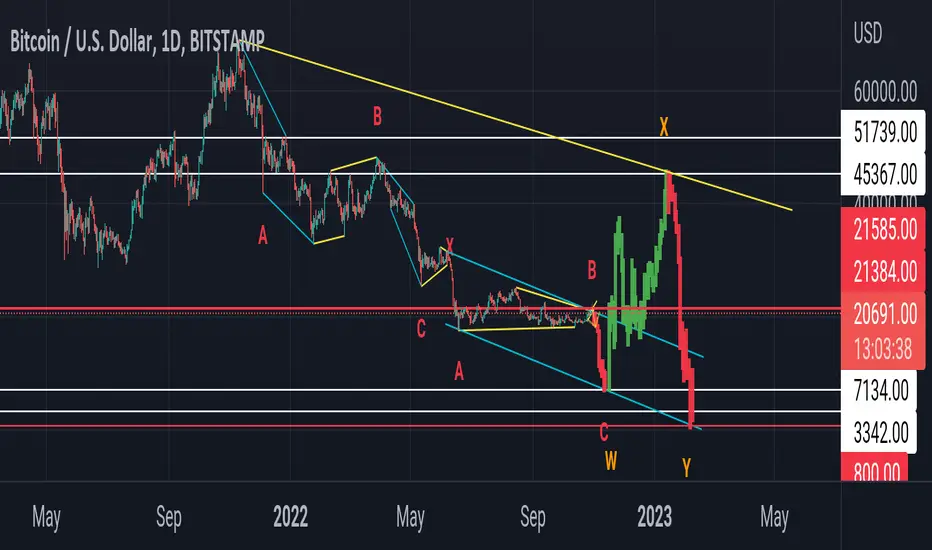
$BTC #BTC #Bitcoin #Elliottwave Projection (WXY).This count is based on my assumptions so anything can happen not a trading or financial advice just for educational purposes only kindly do your own ta thanks trade with care good luck
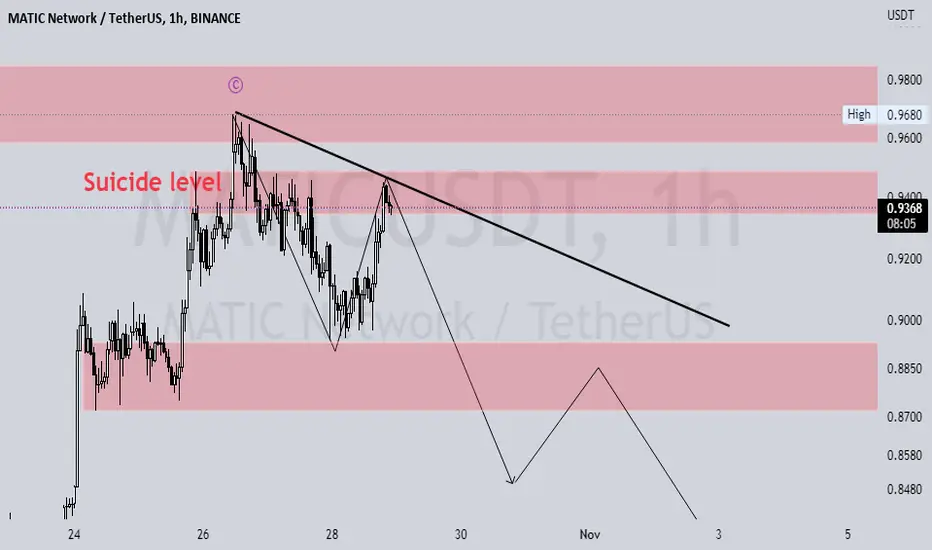
MATICUSDT: Elliot Price actionIn this currency, after the abc correction is completed and the price has reached the level of suicide, we expect a fall, and according to the path that can be seen, a fall is expected.
WHA | Wave Projection | ABCDE Rising Triangle TargetPrice action and chart pattern trading setup:
> The key level to watch for the price now almost reaches the upcoming channel resistance and minor ABC pattern T1 zone.
> Take partial profit recommendation, most likely to retest the triangle neckline or breakdown making E wave dump and pump pattern.
> Entry @ neckline pullback zone 0.382 and S2 @ 0.618 SMA200D zone
> Target @ T2 Major ABC Target and Inverse Head & Shoulders +25%
> Stoploss @ SMA200D zone -8%
> Risk reward ratio: 3:1
Always trade with affordable risk and respect your stoploss

UNISWAP amazing bull elliott count!UNISWAP is one of my favorite alt bull counts.
If we zoom out this could have been the major 2 proceeding into a massive 3 to new all time highs.
The first wave 1 (blue count) has ended in a beautiful golden zone retracement finishing the WXZ.
And thus, the possibility of the first 1-2 into the new bull cycle begins.
A fantastic tell about this setup would be breaking the high of the purple wave 1, while holding the low of the wave 2. Setting up another 1-2 1-2.
Do not miss this one!

ETHUSD | Wave Projection | 4-Wave Always TrianglePrice action and chart pattern trading setup:
> A possible symmetrical triangle 4-wave breakout now a C-wave uptrend resistance SMMA50W - +25-30% upside triangle target (RECOMMEND SHORT ENTRY POSITION)
> Entry @ A pullback trade entry could be possible at EMA10W support
> Stoploss @ lower support B position -15% downside
> Risk reward ratio: 2.5:1
Always trade with affordable risk and respect your stoploss, nothing 100%!

AUDUSD : Elliot Price Action 1Hr Aussie Dollar AnalysisRBA appears less hawkish after shock 25 bps hike in OctoberDiverging pace of future rate hikes may leave AUD susceptible to the downside into year endAUD/NZD, AUD/USD price action setups analyzedRBA Appears Less Hawkish after Shock 25 Bps Hike in OctoberThe RBA shocked markets on the 4th of October when it decided to hike the target cash rate by a mere 25 basis points after 4 consecutive clips of 50 bps prior, citing sizeable frontloading.But in the one-hour chart of this currency, we see an ABC correction wave, and now we are on the path of wave c and the third and fifth wave of this correction, and we continue to expect this currency to fall again.

BAC - Bank of America (full monthly chart)A difficult chart to label. On an linear scale it looks like an expanding ending diagonal, BUT on a logarithmic scale it looks like a contracting ending diagonal. I chose the latter, even though it, in theory, violates the rule (the first wave is shorter than wave 3). Still, the rule is not violated on the linear scale. It's also possible the move is an impulse wave (in that case the diagonal would be a leading diagonal), but the initial wave 1 of the higher degree looks more like a zigzag.
The bottom line is - if the price doesn't enter the price territory of wave 1 (around $19+) it invalidates the pattern and would suggest an impulse wave.

AUDUSDHello Traders, here is the full analysis for this pair, let me know in the comment section below if you have any questions, the entry will be taken only if all rules of the strategies will be satisfied. I suggest you keep this pair on your watchlist and see if the rules of your strategy are satisfied.
The way I told you, you have to trade like this and you will have more profit always and you will not be a loss.

AMZN | Wave Projection | Upcoming Fakeout Head & ShouldersPrice action and chart pattern trading:
> A possible ABC downtrend correction scenario with a upcoming fake breakout head & shoulders formation
> Key dynamic resistance EMA50W and EMA160W
> S Entry @ EMA50W and downtrend upper resistance zone
> TP1 @ 0.786 fibo extension +35%
> TP2 @ 1.0 fibo head & shoulders target +45%
> SL @ B-wave head position -15%
> Risk reward ratio: 2:1 and 3:1
> Indicator: RSI week bullish momentum supporting the uptrend resistance false breakout
Always trade with affordable risk and respect your stoploss, nothing 100%

$usd $pkr #usdpkr predictions.This count is based on my assumptions so anything can happen not a trading or financial advice just for educational purposes only kindly do your own ta thanks trade with care good luck.

$DXY Until Feb 2045 😂😂 No Joke 😳 #elliottwaveThis count is based on my assumptions so anything can happen not a trading or financial advice just for educational purposes only kindly do your own ta thanks trade with care good luck.

HMPRO | Wave Projection | Complex Inv. Head & Shoulders BreakoutPrice action and chart pattern trading setup
> A possible bullish uptrend ABC scenario with complex inverse head & shoulders pattern with SMMA50D as its neckline BREAKOUT!
> The candlestick pattern is consolidating just above the breakout area which possibly retest its neckline next week before price push higher.
> Entry @ B1: PULLBACK retesting neckline within area of candlestick consolidation B2 @ breakout as follow buy.
> Target: Inverse head & shoulders T1 is fibo 1.0 extension and T2 just below 1.618 ext. zone + 12 - 18%
> Stoploss: right shoulder zone - 7 - 8%
> Risk reward ratio: 1.5 - 2: 1
> Indicator: RSI > 60 bullish channel and breakout MA
> The key fundamental analysis found that this coming high season after Thailand major flooding could trigger a boost in revenue and profit in upcoming Q4 company performance.
Always trade with affordable risk and respect your stoploss.

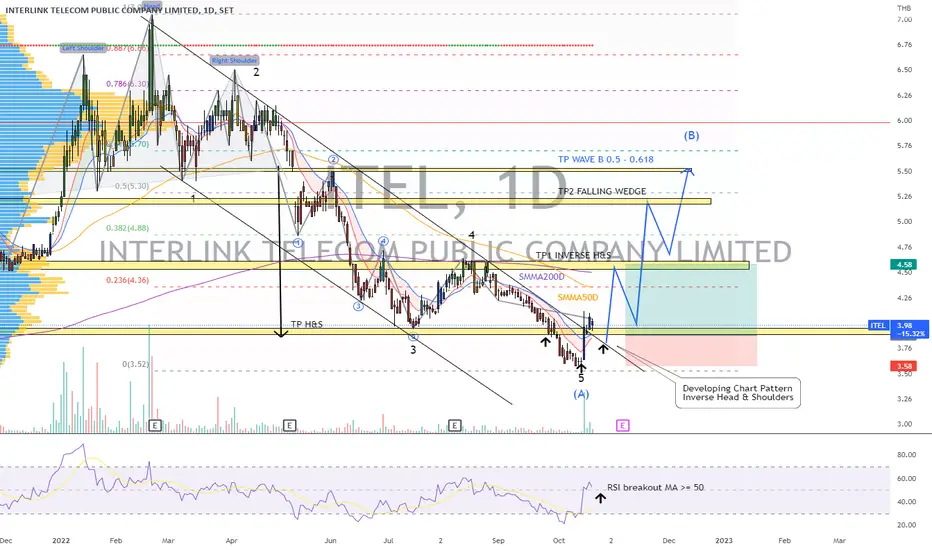
ITEL | Wave Projection | Downtrend Channel Breakout - A-Wave?Price action and chart pattern trading setup:
> A possible downtrend A-wave reversal zone at the 5-wave uptrend Head & Shoulders target
> Now breakout downtrend 5-wave channel and developing an Inverse Head & Shoulders reversal pattern below SMMA200D zone.
> If breakout successfully, A possible scenario for long entry, we could wait for price to retest its neckline.
> Target zone 1 - 2 - 3 as follows: Inverse H&S SMMA200 zone, bullish channel target, and B-wave targeting 0.5 - 0.618 retracement zone.
> Stoploss at inverse head & shoulders' head - 7 - 8%
> Risk reward ratio: 2:1 / 2.5:1 / 3:1 respectively
Always trade with affordable risk and respect your stoploss, nothing is 100%.
GOOGL | Wave Projection | A-wave Correction Bullish DivergencePrice action and chart pattern trading setup:
> A possible A-wave correction zone at 0.618 fib retracement from previous 5-wave uptrend as well as the head & shoulders target with a bullish divergence RSI indicator in weekly timeframe which is showing a strong reversal signal.
> In daily timeframe, the price breakout SMA20 with a small double bottom pattern and MACD golden cross signal line just below zero and now consolidating at upper key level resistance.
> If breakout, the upside is opened to a possible B-wave ABC uptrend with a target 0.5 - 0.618 retracement between +20 - 25% with its double bottom downside -7%, estimated risk reward ratio at 2.5:1
Good Luck
Always trade with affordable risk and respect your stoploss, nothing is 100%.

USDJPY - CURRENT SENTIMENT , FUNDAMENTAL BIAS#USDJPY
- USDJPY is currently BUYing. The reason for that is that with US ECONOMIC DATA being POSITIVE, UJ was BUY very well until last week. And FED UPDATES were very POSITIVE. Another major reason was that the dollar continued to strengthen after last Friday's LABOR DATA. So JPY went down automatically in previous days. But with the intervention of the BANK OF JAPAN, there is now a very good demand for YEN in the market.
- At present, the MARKET is becoming somewhat RISK ON, that's why the JPY is going up. According to the USDJPY ANALYSIS we provided earlier, the USDJPY UPSIDE WAVE is currently UP around 145 ++ PIPS.
- There is definitely a very high possibility that USDJPY will go down a bit more and move to 148.45 LEVEL. The reason for that is because the MARKETS RISK is already on, so it can happen. After that USDJPY price can go up to 152.67 LEVEL. We focus on MARKET UPDATES and MARKET SENTIMENT. Follow the given MARKET STRUCTURE.

$BTC Is Up For Wave 5 #ELLIOTTWAVE.This count is based on my assumptions so anything can happen not a trading or financial advice just for educational purposes only kindly do your own ta thanks trade with care good luck.
