BITCOIN ITS DECISION TIME!!!Bitcoin is at a critical point right now. We are hitting the trend line from the all time high. Be prepared for a breakout or fake out!. Personally wont be trading till it's confirmed but expect a big move. If I had to guess which it would be a guess possible relief rally before new lows.
Elliottwaveprojection

GALUSD | Wave Projection | Target Triangle 4-Wave BreakoutPrice action and chart pattern trading:
> A possible bearish scenario with descending triangle breakout to complete 5-wave downtrend wave with the target of 1.618 extension of 4-wave (-60% downside)
> Stoploss can be placed at the right head & shoulders pattern - SMMA50 zone
> Indicator: MACD squeezed below 0.

Nifty 50 Next Wave PredictionI used Elliott Wave and Fib to predict the future move for Nifty 50. After bounce back from 16747.70 the next wave should be 1.272 (17240) or 1.414 (17370 ) or 1.618 (17540) as I explained in the Image.

NIFTY ELLIOTT WAVE ANALYSISThe NIFTY Index which has been trending in impulsive move for couple of weeks, which trend is about to terminate now.As it has been forming the Ending Diagonal structure in which wave 4 is in progress now nad the wave 5 targets are 18170 and 18275.After that Nifty should give big bearish move to down a correction of previous trend.

HINDALCO ELLIOTT WAVE ANALYSISHindalco the metal stock has been moving good for last couple of weeks.The stock is in wave 4 flat correction which will end around 410 and then the next wave 5 will start for the target 468 rupees.

Nifty Elliott Wave Short Term ViewThe nifty is in micro degree wave in wave 4 which will complete around 17765 and then wave 5 to downside will start for the target of 17270 level.

BankNifty Elliott Wave AnalysisThe Banknifty index has been in a very complex correction for some weeks.As per my one of view the currecnt complex correction looks like Extended or Elongated Double Three pattern which will complete at 40071 or 39635 level as shown in the chart.

USDINR Elliott Wave AnalysisThe USDINR has shown breakout on the Wednesday night during the FOMC Fed Meeting and the pairing is trading in the impulse pattern.Presently it is in wave 4 now which will complete around 80.60 level and then wave 5 will begin which will have the target of 81.62.

Bajaj Finance Wave AnalysisThis NSE stock has made big impulsive move previously which is being now corrected in Flat A-B-C pattern as shown in the price chart.The corrective wave will get completed around 7000 price and from there onwards the wave 3 impulse will start for the target of 10700 level target.

Icici Bank Elliott Wave AnalysisThe stock has very high liquidity everyday and has been moving in great impulse for last 2-3 months and now the correction is getting completed as expanding flat pattern.After the end of correction at the shown level the wave 3 impulse will start for the target of 1200 level in coming months.

Nifty Wave Analysis Next weekThe Index has just completed wave 3 and bounced in wave 4 which will complete around 17170-200 level and then the wave 5 will begin for the downside target of 16487 level very high probability of hitting it.

CADJPY : Current Situation & Technical , Fundamental View#CADJPY
- At this point, CADJPY is selling very well due to the current MARKET SENTIMENT. So CAD automatically went down. Also, unexpectedly, a JPY STRONG came in the last few days. This was because the Bank of Japan intervened to strengthen the JPY.
- But after that the price of OIL went down very fast. Due to this reason CAD was sold very fast before. You can check it by going to CAD CHARTS.
But now with JPY WEAKNESS, CADJPY is selling very fast.
- Currently, the MARKET is slightly RISK OFF, JPY is going UP, therefore, CADJPY is being SELL.
- Definitely CADJPY should be slightly DOWN until 102.91 LEVEL. After that, the possibility of moving to 110.06 LEVEL is very high. The reason for that is because even now OIL PRICES are going up a bit.

$DXY Turning Down For W4 Monthly EW. $BTC #XAUUSDThis count is based on my assumptions so anything can happen not a trading or financial advice just for educational purposes only kindly do your own ta thanks trade with care good luck.

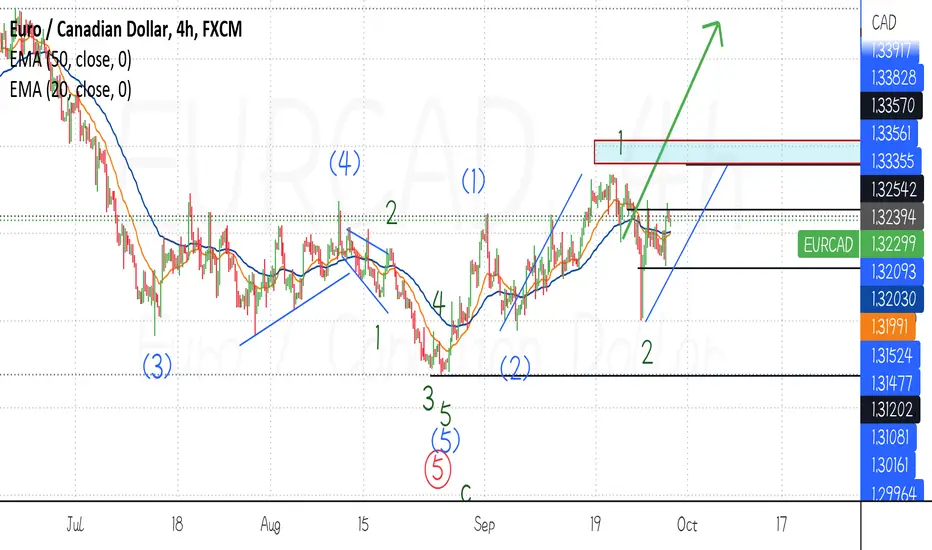
1/2 1/2 sequence?If price gets to 1.33570 then we are in for a 1/2 1/2 sequence and no longer a leading diagonal... Cus the basics rule of a Diagonal where Wave 3 can't be the shortest will be broken... This a very nice setup, monitor and #DYOR
Price predictions for MATIC. Are you Bullish on Polygon?My primary expectation for Matic is one more low in a wave five of the wave c. However it has done a lower low so we could technically go up up from here and nearly hit the 50% fib which is an ideal retracement for a lager wave 2. If we are in the wave 4 still before wave down in the wave C. We could comedown between 0.6867 all the way down to 0.4587 in a wave 2. If we come down any further I will be laddering buy orders down to 0.45 cent. Just remember it reversing in this area is not guaranteed but I think its very likely. If we do reverse to the upside the wave 3 targets would be 1.41 to 1.86 which is 90 to 150% from where we are now. :)

Has the DXY topped out?DXY has been on an extended pump to the upside and is definitely getting exhausted in its wave 5. We have nearly hit the 1.618 fib at about 120.00. It does not have to go any higher and has done more than enough for a wave 5. If the wave 5 is over we could be looking at a retracement down in an ABC to 92.78 to 80.00. Obviously this will take months or years to retrace to this level.

CAKEUSDT | Wave Analysis | Wave 4.4 Take Profit ZonePrice action and chart pattern trading;
> Take profit zone at the upper resistance of the wave channel, possible at SMMA100 fakeout resistance - 0.382 - 0.5 retracement of Wave 4.3
> The final Wave 5 downtrend could be projected at 0.5 - 0.618 extension of wave 4.3 slightly below the previous low - a usual dump & pump is expected before making its uptrend wave
> Indicator: RSI and MACD bearish divergence in TFD squeezed just above the baseline 0, limited upside.
Always trade with affordable risk and respect your stoploss, nothing is 100%

Bitcoin $BTC 28-32k Target - Elliott Wave Hi guys,
At a time when everyone has been so bearish and looking for lower targets on Bitcoin, you know that this is the time to start getting bullish, even just for a short time.
First, I'll guide you through market structure of this current bear market, then, in my next analysis, I'll look at recent price action to see if it is giving the game away as to where bitcoin is heading.
Bull Run - Nov '18 - Apr '21
There is a clear 5 wave impulsive structure from November 2018 to April 2021
Bear Market Apr ' 21 - PRESENT
Then you have a clear A-B-C pattern from June 2021 to November 2021, meaning this must be a wave B expanded flat to the 1.05 fib retracement. From then we have begun to follow an impulsive five wave C. So far, we can see a wave 1 to $32917 before a triangular wave 2 to the 0.50 at 47.4k
Wave 3 was a clear impulsive structure with minimum retracements down to the 1.272 fib extension with the lowest wick down to 17.6k
Currently, we are in a wave 4 correction, more specifically, the impulsive C wave of a wave 4, denoted as WC.4.C
My most likely target for this is the 1.272 fib extension of wave 4.A to 28.6k with next being the 1.618 at 32.4k as seen on the chart above, but may fall somewhere in between.
WC.4.C.1 will most likely end at the 0.618 shown below and come to the string resistance at around 22.2-22.5k, then follow a probable 5-wave structure as shown below:
What's Next?
I wish I can say Rocketships but I have to look at the evidence and suggest an impulsive wave 5 down and I have to say that it will most likely be nasty.
Due to the shallow wave 3, only reaching the 1.272, the 5th wave will most likely be an extended 5th wave to around the 0.786, 1 or the 1.272 extension of the wave 1:
There are still chances of lower targets but all I can do for now is show the most likely scenarios
Thanks for reading and let me know what you think.
Tchau

XAUUSDGold a cute impluse wave is running in a channel , as long as if gold didn't break 1658 , i think the target will be around 1600 ,1610 ,1620 in upcoming hours / days ! keep watching :) cheers

GBPUSD HISTORICAL LOWS IN THE MAKINGEIGHTCAP:GBPUSD
TRADE PLAN
GBPUSD
TIMEFRAME: H1
COMMENTS
Price traded below 1985 lows at 1.05500. Looks like the Sept 2022 low at 1.03589 is not historical yet.
Currently I'm looking forward to revisit Sept 2022 low, and potential visit to 1.02858 and even parity of GBP=USD (Price of 1.0000).
Disclaimer:
Charts are educational

Dollar index DXY bullish till end of this yearSeems to be in wave 3 of 5 to complete at 124 end of 2022, start of 2023
When 5 is reached, all markets (stock/crypto) should reverse and become bullish

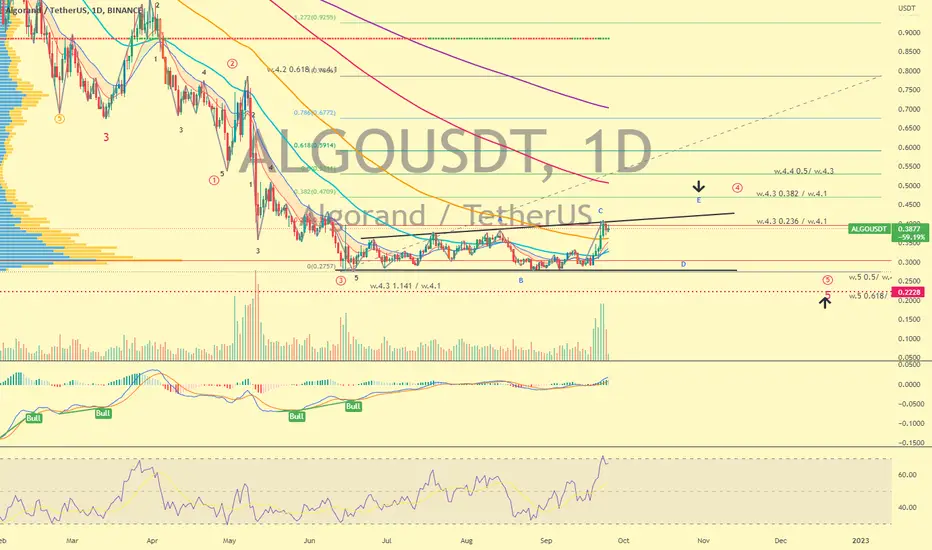
ALGOUSDT | Wave Projection | 4.4 Wave Expanding DiagonalPrice action and chart pattern trading setup
> A possible uptrend 4 wave with expanding triangle pattern ABCDE
> Target take profit zone at 4.4-wave @ 0.382 - 0.5 retracement zone of previous wave 4.2-wave
> The final downtrend 5 wave zone could be projected at 0.5 - 0.618 retracement zone between the recent lowest zone and original major 2-wave - dump & pump pattern is expected.
> Indicator: MACD squeezed and gold cross the baseline with wider uptrend ribbon, most likely to continue rising for now.
Always trade with affordable risk and respect your stoploss - nothing is 100%
Nifty wave C 80% completed & heading towards 17255 - 17161-Nifty gave further confirmation of wave C after my last post & now heading to cross 17255 zone which is also 100% level
-As discussed in last post wave C generally retraces to 100% - 130% in most of the cases
-markets can fall further too after crossing 100% - 130% zone but 17161 is strong support from where wave 4 was started
-safe players can exit theirs positions after 100% level is crossed or book 90% of profits with strict stop loss around 17300 zone (in case anything goes against us) & trail till 17161 - 17100
-After that we can expect new wave cycle from there but we will discuss it when the time comes
Hope this idea was helpful & good learning experience
