Elliott wave analysis of Crude Oil WTI Futures As per Elliott wave analysis Crude Oil WTI Futures is in 4th wave, expect it to reverse and go down to $87 area marked in red circle.
Elliottwaveprojection

Nifty fall till 17500 Levels | Wave C confirmed on Daily chartLooking at the current market condition it is very clear that the top of wave B is completed here & also today big red candle gave us the indication that it is going for the wave C
-in the downside wave C projects minimum around 61% so first target would be 17511 which is minimum projection & after that it can retrace till 100% (17257) - 127% (17100)
-Yesterday's analysis of wave 5 on 15 min chart was invalidated & ABC correction is formed
-Form now on till the wave C is completed i am bearish on market & after that we will see new waves which will target All time High & will drive markets to new highs hopefully :)
*This theory gets invalidated if today's high is broken*
Ideas for profits which i am considering : one can buy OTM puts for the next month expiry & square of positions when targets are archived on the spot chart
Disclaimer : this is not recommendation or tips this is my personal view for the markets & i am not SEBI registered analyst.

$BTC #Btc #Bitcoin #Elliottwave Flat Correction.This count is based on my assumptions so anything can happen not a trading or financial advice just for educational purposes only kindly do your own ta thanks trade with care good luck.
Now don't mess it up please.

Have bitcoin bottomed?Looks like bitcoin has finished a double zigzag and correction could be over. Its overbought on weekly rsi and so far there is bullish divergence on Daily timeframe. 22.4 is key area so lets see if we Can break above that.

Nifty wave 4 completed now heading towards 17928-As discussed yesterday Nifty confirmed wave 3 & today itself it gave retracement of wave 4
-From now on nifty at the time of closing Nifty gave very small bounce from 17779 which is where 38% level is
-We can assume that wave 4 is completed here & from tomorrow we are heading towards wave 5
-Target of wave 5 is 17919 also because our wave 3 was extended & wave 5 may get extended or not but it should atleast target high of wave 3
*If market breaks 17665 then this whole theory gets invalidated*

Adani WilmarAdani Wilmar wave analysis:
Adani wilmar is doing well in terms of waves.
So far we have done wave 1, wave 2 also looks completed.
Now we are in a non-convincing up move but it looks like adani wilmar is making space for upward move.
Investor can invest on advice of their financial advisor.
This chart is not a trading/investing advice.
Please ask your experts for any such activity.
Every level which has its importance is depicted on the chart, you may ask for any doubt thereon.
Thank you
Regards

$Btc #Bitcoin #Btc $Dxy #Elliottwave ABC Flat.This count is based on my assumptions so anything can happen not a trading or financial advice just for educational purposes only kindly do your own ta thanks trade with care good luck.

Mayday!! We're going down!!! $Btc #btc $dxy #elliottwave.This count is based on my assumptions so anything can happen not a trading or financial advice just for educational purposes only kindly do your own ta thanks trade with care good luck.

$BTC $DXY #USD #Elliottwave Bottom @ 7.5k.This count is based on my assumptions so anything can happen not a trading or financial advice just for educational purposes only kindly do your own ta thanks trade with care good luck.

$BTC $DXY #USD #Elliottwave Buy Setup 15mtf.This count is based on my assumptions so anything can happen not a trading or financial advice just for educational purposes only kindly do your own ta thanks trade with care good luck.

US DOLLAR INDEX - UpdateMy forecast on DXY is now complete.
Please see link below for original idea
If you like my ideas, please leave a like or comment below for more updates.

Wave5? $Btc #Btc $DxyThis count is based on my assumptions so anything can happen not a trading or financial advice just for educational purposes only kindly do your own ta thanks trade with care good luck.

Weekly W5 #Elliottwave Buy Setup $Btc $Dxy #Usd #Btc.This count is based on my assumptions so anything can happen not a trading or financial advice just for educational purposes only kindly do your own ta thanks trade with care good luck.

INDUSIND BANK ELLIOTT WAVE ANALYSISThis bank stock analysis is on weekly timeframe for long term value investment , the stock is showing great movement after the 2020 crash has recovered well.As shown in the chart the stock is in wave 3 of cycle degree on weekly timeframe and the wave 3 target is around 3500 in coming years.

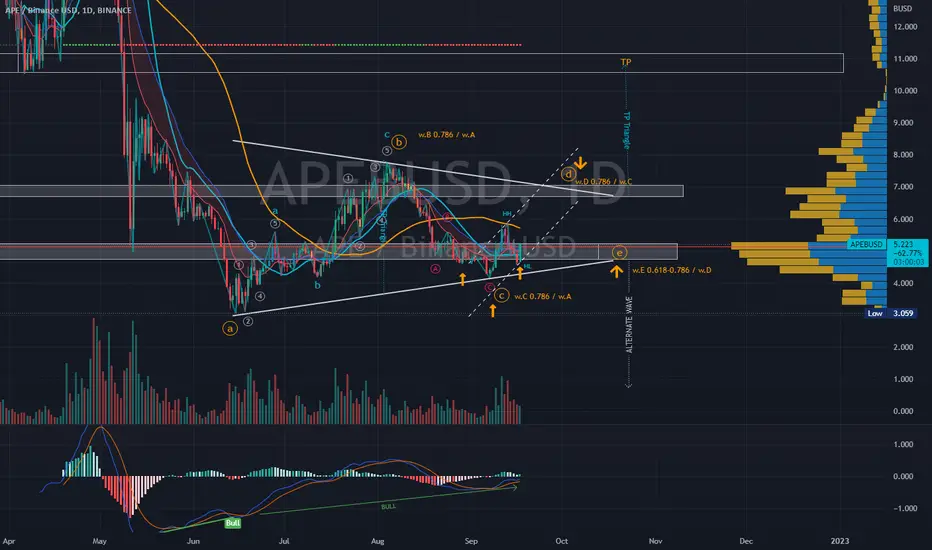
APEUSD | Wave Analysis | Bullish Triangle ABCDE ProjectionPrice action and chart pattern trading setup
> A possible upcoming bullish triangle ABCDE wave within 1-2 months
> B-wave retraced 0.786 of A-wave and recent C-wave retraced exactly 0.786 of B-wave.
> Expecting uptrend D-wave at 0.786 of C-wave with an inverted head n shoulders reversal pattern.
> Entry: head n shoulders breakout
> Target: D-wave position +30%+
> Stoploss: right shoulder -10%
> RRR: 3:1
Indicator:
> MACD above signal line just below 0.
> RSI bullish momentum rebounded from MA line
Nothing is 100%, always trade with affordable risk and respect your stoploss
$BTC #BTC $DXY #USD #Elliottwave W5 MTF.This count is based on my assumptions so anything can happen not a trading or financial advice just for educational purposes only kindly do your own ta thanks trade with care good luck.

TKN | Wave Analysis | Possible Upcoming Impulse 3-Wave ForecastPrice action and chart pattern trading setup
> Wave pattern: 2-Wave Triangle ABCDE - possible upcoming wave E before rising impulse 3 wave.
> Entry: Support level SMMA50 and SMMA20 @ 0.618 and 0.786 retracement zone
> Target: 3 -wave triangle breakout plus distance of the triangle channel 1.272 extension zone of main 1-wave +15-20%
> Stoploss: Lower triangle support zone -7-8%
> Risk reward ratio: 3:1
Always trade with affordable risk and respect your stoploss

$BTC #BTC #USD $DXY #Elliottwave Update MTF.This count is based on my assumptions so anything can happen not a trading or financial advice just for educational purposes only kindly do your own ta thanks trade with care good luck.

ATOM Elliott wave price cast attempt on ATOM elliott wave price cast considering moderate bullish sentiment, not financial advise

Next Top Is...Minor wave 1 may have finished today, slight chance of it finishing if a new low occurs shortly after the open tomorrow. For now, Minor wave 1 was 3 days. Wave 2 will likely be similar in length. Historical relationships point to a possible top around 4000.
There is not much news until the Fed so we could meander upward for a few days while we wait. I do expect Minor wave 3 to be a very sharp drop in the order of 300+ points over 3-6 days which would be fueled by a larger than expected Fed hike and/or hawkish comments afterward.
Minor wave 1 has been eventful so far, we shall see what happens next.

TATA STEEL ELLIOTT WAVE ANALYSISThe best Metal stock in Nifty 50 to invest your valuable money is Tata Steel.I t will give you the best returns in coming time more than 100 % as you can see the projected target for next third wave is 288 rupees.

USDJPY ELLIOTT WAVE ANALYSISThe pair price is traing in wave 4 of impulse shown in the chart that wave 4 pattern is double three which will end at the drawn support and pair will start wave 5 move as shown in the chart.

XAUUSD GOLD Elliott Wave AnlysisThe Gold Commodity has been moving in the Impulse pattern in the weekly timeframe.Now he gold is in the Wave 4 Double three pattern W-X-Y which will complete around 1670 and 1575 usd levels.After the end of his wave 4 correction the gold will move into a big wave 5 impulse target above 2200 usd as shown in the chart levels.
