Nasdaq heading towards 5th wave 13720 again.Looking at the wave analysis & retracement level of 4th wave market took support around 38.20 level(as per Fib retracement) & showing bullish momentum as long as 38.20 (today's low) is defended we can safely assume market to go towards 5th wave
First target is top of wave 3 & 2nd target is 38.20 level 13871 level(as per the 5th wave Fib projection) as long as today's low 12852 is defended.
Elliottwaveprojection

DXY/ZN Ratio Chart - USD Is Nearing Target Against 10Y US NotesThe longer-term trend and the cycle of the USD in a comparison with 10Y US notes ( DXY /ZN ratio chart). It can slow down later this year or in 2023, but if there will be recession, then USD can face another big leg up before an important shift occurs. GBP could stay weak in the meantime and it can even retest the 2020 lows first.
Be humble and trade smart!
All the best!

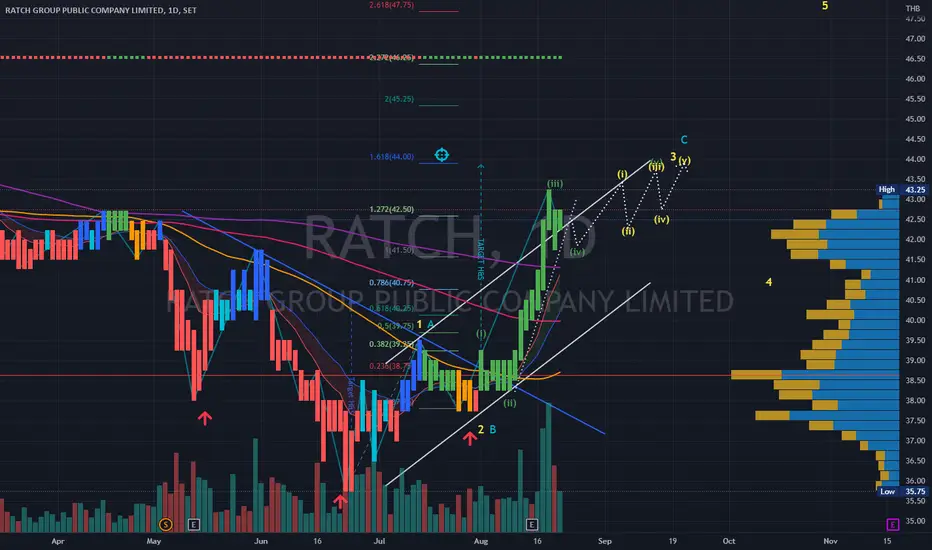
RATCH | Elliott Wave Analysis -Uptrend rising wedge projectionPrice action and chart pattern trading - take profit position
> Rising/Bearish Wedge false breakout wave iv correction
> Target Inverted Head & Shoulders 1.618 extension of wave 1 or A
> Recommend take some profit along upcoming wave (iii) of wave v of wave 3 or C should be the longest wave.
> Indicator: RSI / MACD should start showing bearish divergence during the next cycles
Ambuja Cement This stock has completed 4th wave on daily time frame, and now possibly we are in 5th wave, once resistance trendline is broken then it would be a good trigger point to go long, stock had reached that trendline and currently trying to break, once it's broken, then bulls can take charge, also trend indicators and wave counts are suggesting to go long.
Overall wave structure on daily time frame
Macd in daily positive crossover and Uptick and also above zero line
Macd in weekly positive crossover and Uptick and also above zero line
RSI trendline breakout on daily time frame, uptick and also above 60
Price pushing upper bollinger band to open more upside
RK's Mass psychological Cloud buy activated
Dmi adx also positive on daily time frame
Disclaimer
I am not sebi registered analyst
My studies are Educational purpose only
Consult with your Financial advisor before trading or investing

My biasThis my bias on #EURUSD... I will be monitoring the pair to see if price follows my projection for me to make an entry... I hope it helps, please drop a like, comment and follow me for more!!

DXY correction over?Using Elliot Wave Analysis this is my primary bias... What's your take? Drop a comment

1810 XIAOMI | Elliott Wave Analysis - Possible Dump & Pump?Price action and chart pattern trading
> Ending diagonal with asymmetrical triangle pattern - possible scenario with dump & pump before ABC uptrend reversal.
> Aggressive entry @ downtrend channel wave ii and iv breakout
> Safer entry point @ triangle breakout
> Target @ previous 1 wave 0.382- 0.5 retracement zone
> Stoploss @ triangle lower support zone
> Risk reward ratio: 2:1
Indicator:
MACD - signal golden cross anticipated soon
RSI to breakout downtrend line MA before making the long entry
Always trade with affordable risk and respect your stoploss

ETH - The best chart you will ever findETH analysis with the key dates
Have a look .
I think ETH has decoupled itself from Bitcoin.
Watch the video for a key reversal date to pick your next move

BTCLeading Diagonal in 1st wave position has broken down and now in wave 2, questions remaining are:
1. Bounce off fib retracement level 618% at $20,400
2. Bounce of 786% level at $19,300
Then quickly run it back turbo to $36K for a 3rd wave.
I don't make the rules guys.

SAM: Boston Beer CompanyLooking to follow his family’s passion for brewing, Jim brewed the recipe in his kitchen with the hopes of challenging the status quo in the American beer industry. He started by introducing American drinkers to craft-brewed beers that were full-flavored, balanced, and complex, and brewed with quality ingredients. Pleased with his brew, Jim started The Boston Beer Company with his co-founder and first employee, Rhonda Kallman. In those first months, Jim walked bar-to-bar with a briefcase full of beer that he called Samuel Adams Boston Lager, in recognition of one of our nation's great founding fathers, a revolutionary man of independent mind and spirit. Boston Lager soon became a catalyst of the American craft beer revolution, making its public debut in Boston on Patriot's Day in April 1985. Six weeks after its introduction, Boston Lager was selected as "The Best Beer in America" in The Great American Beer Festival's Consumer Preference Poll, which became an award Samuel Adams Boston Lager went on to win an unprecedented four times.
If you're unfamiliar as to what beverages are made by SAM, think Samuel Adams (of course), Angry Orchard, Twisted Tea, Truly (seltzer) among others. While you may not be hip to 'Boston Brewing Company', if you enjoy alcoholic beverages, chances are you've indulged in at least one of their products.
More fascinating to me than the number of household brands this company supports is the wave structure of its all-time price action. If one didn't believe in the power of an extended 3rd wave before now, feast your eyes on its magically vertical increase in price, practically since inception! For what its worth, I have no stock or positions with SAM however, as an Elliott Wave fanatic, I'm excited to show the power of such a move.
To get ahead of the wave and find potential moves like these (or avoid the downfall that comes after a completed wave cycle), join us on the waves.

BGRIM | Elliott Wave Analysis - Leading Diagonal Cup HandlePrice action and chart pattern trading
> Cup & Handle pattern with a leading diagonal wave forming the cup handle, possibly iv-wave correction targeting EMA70 slightly below the lower channel support
> Expecting a candlestick tight formation for reversal pattern formation before entering a long entry.
> The target 3-wave confirmation should break out the upper channel resistance.
> The final target of cup & handle at 2.618 extension zone

ACBThis stock can get some real momo off the .96c price, would be easy to time. But upside is massive in the coming year or two IMO.

WTI Crude Oil Daily Bearish continuationTVC:USOIL
CFDs on WTI Crude Oil Daily
Finally,, Oil appears set to visit the Daily Price objective at 70.200 with a completion of Bullish Bat Pattern on Daily Chart.
DISCLAIMER
Charts are EDUCATIONAL, not INVESTMENT recomendations

NAS100 H1 one more Bulliish Push?OMXHEX:BULL_NQ100X1_NF1
NAS100
Looks like PRICE objective is to visit 13765.00 area before we see a significant correction back to 12432.00 area.
Alternatively we will keep on buying the deep to 15500.00 area for a Bullish Cypher pattern.
DISCLAIMER
Charts are educational, not INVESTMENT recommendations

Could I have cracked a code! US30, DJIA, Dow JonesIf we start at (1) Jan 5th All time high and move 51 days down to a new low to Feb. 24th 2022 that would be the 1st leg down. Then take (2) Feb. 24 2022 up 57 days to April 21st 2022 that would be a new lower high. Then April 21st 2022 58 days down to a new lower low to (3)June 17th a new lower low, and finally back up to (4) 60 days up to 8/16/2022. If this is the peak of the (4th) part of the wave, we could see a down turn from here to the 5th and final leg down to the Dow being approx. 26,811 in 60 days OCT 17th 2022.Then a possible bounce back up from this market correction.

Expecting na final C wave to complete the whole correctionUsing Elliot wave I will be uploading a multi-timeframe analysis on this pair to show why I think it's a move up coming up next.. enjoy
