Elliott Wave View: Gold Likely Still Has More UpsideShort Term Elliott Wave structure in Gold suggests the rally to $1528 on August 16 ended wave 1. The precious metal then pullback to $1492 which ended wave 2. The internal subdivision of wave 2 unfolded as a double three Elliott Wave structure. Down from 1492, wave ((w)) ended at $1492.9 as a zigzag. The bounce to $1508.76 ended wave ((x)) and the next leg lower to $1492.16 ended wave ((y)) of 2 with subdivision also as another zigzag.
The metal has since resumed higher in wave 3. The internal of wave 3 is unfolding as an impulse Elliott Wave structure. Up from 1492.16, wave ((i)) ended at $1555.33 and wave ((ii)) ended at $1520 Near term, while above $1520, and more importantly above $1492.16, expect Gold to extend higher. The precious metal still needs to break above wave ((i)) at $1555.33 to confirm that the next leg higher has already started. We don’t like selling Gold and expect the precious metal to continue supported as far as pivot at $1492.16 low stays intact.
Elliottwaveretracement

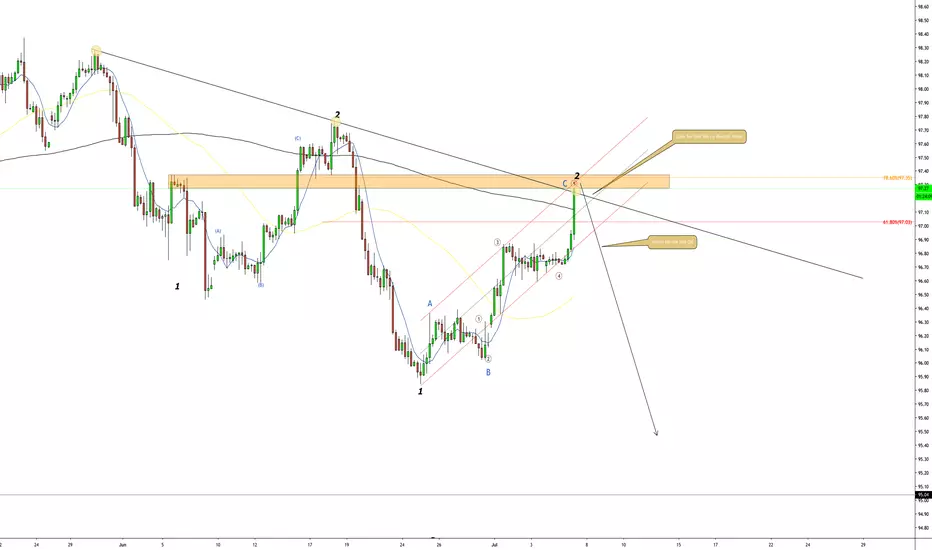
Elliott Wave View: Silver Remains SupportedShort Term Elliott Wave structure from the chart below suggests the rally in Silver to $17.5 ended wave (3). The metal then pullback in wave (4) to 16.91 with internal structure as a triangle. Triangle is labelled as ABCDE with subdivision of each leg in 3 waves. Triangle is therefore a 3-3-3-3-3 structure. In this case, wave A ended at 16.5, wave B ended at 17.39, wave C ended at 16.83, wave D ended at 17.19, and wave E ended at 16.91. We can also see each leg in the triangle subdivides in another 3 waves.
The metal has resumed higher in wave (5). Up from 16.91, wave 1 ended at 17.77 and wave 2 pullback ended at 17.49. Wave 1 subdivided as a 5 waves impulse structure. Wave ((i)) ended at 17.14 and pullback in wave ((ii)) ended at 16.96. Up from there, wave ((iii)) ended at 17.74, wave ((iv)) ended at 17.55, and wave ((v)) of 1 ended at 17.77. Silver still needs to break above 17.77 to confirm the next leg higher has started and avoid a double correction. We don’t like selling the metal. As far as pivot at 16.91 stays intact, expect Silver to extend higher.

Elliott Wave View: Netflix Structure Looking Further DownsideElliott Wave structure in Netflix shows an incomplete bearish sequence suggesting the stock should continue to see selling pressure. On the chart below, the rally to 316.59 ended wave 2. The stock has extended lower in wave 3 with the internal unfolding as 5 waves impulse Elliott Wave structure. Down from 316.59, wave ((i)) ended at 288 and wave ((ii)) ended at 311.75.
Wave ((i)) subdivided in another impulse structure of lesser degree. Wave (i) ended at 305.68 and wave (ii) ended at 316.43. Stock resumed lower and ended wave (iii) at 292.65, wave (iv) ended at 301.73 and wave (v) of ((i)) completed at 288. The internal of wave ((ii)) correction subdivided as a zigzag. Wave (a) ended at 303.55, wave (b) ended at 295.76, and wave (c) of ((ii)) ended at 311.75.
Wave ((iii)) is currently in progress and the internal subdivides as a 5 waves impulse of lesser degree. Down from 311.75, wave (i) ended at 293.15. Expect wave (ii) bounce to hold below 311.75, and more importantly below 316.59 for further downside. We don’t like buying the stock. As far as pivot at 316.59 high stays intact, the stock should resume lower. The bearish view will get further validation if the stock is able to break below August 15 low (288).

USDCHFIs the most respected pair that never disappoint. We're bearish on USDCHF and our long term target is 0.96000
Hope you'll catch this as it's going to be very profitable.

ROKU update: wave-iv complete or more complex!?In my first update on ROKU, on August 9, I warned "bears would want to step aside until at least 138-140" as that price zone would provide for a more substantial top. I was then looking for " Based on Fib-extensions and retraces we should see this wave-iii top at around 138-140, then a pullback to about 112ish for a wave-iv of 5, before wave-v of 5 ideally targets the 148-150 zone. ". Price reached $142 on August 14 and dropped as expected, but so far only to $127 last Friday, and is now trying to attack its ATH again.
So is all of wave-iv already in? It is possible as 4th waves can be shallow, but 4th waves are also known to be more often than not complex price structures (triangles, flags, and flats). So in this case, ROKU could be working on wave-b of iv, which can move beyond the ATH before wave-c of iv takes hold to bring price back down. Now this possible wave-c can then go beyond $127 or stall there. We don't and can't know this before hand. In the former case it will then be a regular "expanded flat" and in the latter case a less common "running flat". Time will tell... Bottom line, the bigger trade-able top from a short perspective has IMHO most likely not yet arrived and Bears would want to continue be nimble here as the irregular b-wave can reach as high as $144-149.
For now, the advance off Friday's low looks on a micro-scale better as 3 waves up, but can nonetheless still reach $149-153 if it wants to based on Fib-extensions and "a-wave to b-wave" relationships. That price level, in turn and however, would also fit with the wave-v of 5 of Cycle-C high (baring any possible extensions) and thus overall provide for a much better "top."
Trade Safe!

GBPUSD Target Price 1.19091GBPUSD Horizontal Contracting Triangle Trading Strategy
The Elliott Waves Theory refers to a Symmetrical Forex Triangle as a Horizontal One. If the triangle contracts, Elliott called it a horizontal contracting triangle.
Pennant, Symmetrical Triangle, Horizontal Contracting Triangle.

EURGBP SELL Onda inversa y Ondas de ElliotA través de un contéo de ondas de Elliot, se puede ver la culminación del ciclo alcista completo, ya presenta divergencia importante y el precio está en una zona diaria y semanal notoria. Para la entrada se busco un numero Fibo donde se tiene por onda inversa el 100% de 3 a5 que confluye con el -0.61 del retro

Nifty possible wave count and future pathThis shows the internals of the expanded flat, as detailed in one of the previous updates (link attached), that Nifty might be forming. This is a rather far-fetched view and the view is correct conditional on Nifty following each of the above arrow. At this stage, this seems to be the most likely future pattern.

GOLD - Possible reversal zone /*WEEKLY EW PREDICTION*/I think that this red zone is propable reversal zone and ongoing downtrend (correction) after (post-crisis 2008) buuble on GOLD. Maybe its another **** prediction :)


Elliott Wave View: EURUSD Continues LowerElliott Wave view suggests the decline in EURUSD from June 25 high (1.1412) is in progress as a 5 waves impulse Elliott Wave structure. Wave ((iii)) of this 5 waves can be seen on the chart below and subdivides in another impulse of lesser degree. Wave (i) ended at 1.1198, and wave (ii) bounce ended at 1.1282. Pair then declined in wave (iii) towards 1.11. and wave (iv) ended at 1.118. Wave (v) seems to be missing 1 leg, thus while pair stays below 1.118, it can see a marginal low to end wave (v) of ((iii)).
Afterwards, pair should do larger bounce within wave ((iv)) to correct cycle from July 11 high (1.1286) before the decline resumes. Shorter cycle, as we are near the end of wave ((iii)), it is risky to chase the weakness at this stage. However, we don’t like buying the pair and expect any rally to find sellers in 3, 7, or 11 swing for further downside. Later bounce in wave ((iv)) should fail while pivot at 1.1286 stays intact. Pair should then decline 1 more leg lower within wave ((v)) to complete a 5 waves down from June 25 high.

US Dollar Huge Sell Off Wave AnalysisYes I am still Bearish on the US Dollar! The bullish corrective structure that started on June 19th have turned out to be a deep zig zag corrective pattern that could be finding resistance at the 88.6% fibonacci level of the initial bearish decline. I am expecting the highs that the Dollar created on May 18th of 98.37 to hold strong. I am looking for a big move to the downside to start the bearish wave 3 as the Dollar weakens

Apple Elliott Wave View: Break Higher Is ImminentElliott wave view in Apple ticker symbol: $AAPL suggests that rally from June 04 low ($170.27) is showing nesting higher as impulse Elliott wave structure where a pullback to $197.60 ended lesser degree wave ((iv)). Up from there, the stock rallied higher in 5 waves structure and ended wave ((v)) $206.11 high, which also completed wave 1. Down from there, the stock corrected the rally from 6/14/2019 low in wave 2 pullback.
The internals of that pullback unfolded as an Elliott wave Flat structure where wave ((a)) ended in 3 swings at $202.80 low. Wave ((b)) bounce ended with another 3 waves at $206.70 high. Down from there, wave ((c)) unfolded in lesser degree 5 waves & ended the wave 2 pullback at $202.23 low. Above from there, the stock already made a new high above previous peaks making the 1-hour cycle from June 04 & June 14 low bullish to the upside favoring more strength.
Near-term, while dips remain above $202.23 low expect the stock to extend higher in an impulse structure looking for more strength & to see a break above May 2019 peak to catch up with rest of indices & ETF’s like SPX, YM & XLK, etc. We don’t like selling the stock & expect intraday buyers to appear in 3, 7 or 11 swings. As far as a pivot from $202.23 low stays intact.

Elliott Wave View: Gold Should Extend HigherGold shows an incomplete sequence from August 16, 2018 low favoring further upside. Near term, pullback to 1385.34 ended wave (4). The yellow metal has resumed higher in wave (5). Internal of wave (5) is unfolding as a 5 waves impulse Elliott Wave structure. Up from 1385.34, wave 1 ended at 1427.16 and wave 2 pullback ended at 1399.70. Internal of wave 1 unfolded also as an impulse in lesser degree. Wave ((i)) of 1 ended at 1400.03, and wave ((ii)) of 1 pullback ended at 1389.82. Rally then resumed in wave ((iii)) of 1 towards 1420.76, wave ((iv)) of 1 ended at 1418.7, and wave ((v)) of 1 ended at 1427.16
Wave 2 pullback ended at 1399.70 as a zigzag Elliott Wave structure. Wave ((a)) of 2 ended at 1400.56, wave ((b)) of 2 ended at 1419.75, and wave ((c)) of 2 ended at 1399.70. Gold has now resumed higher in wave 3 of (5). Up from 1399.70, wave ((i)) of 3 ended at 1430.08 and wave ((ii)) ended as well at 1414 low. We dont like selling it and prefer more upside against 1399.61 low.

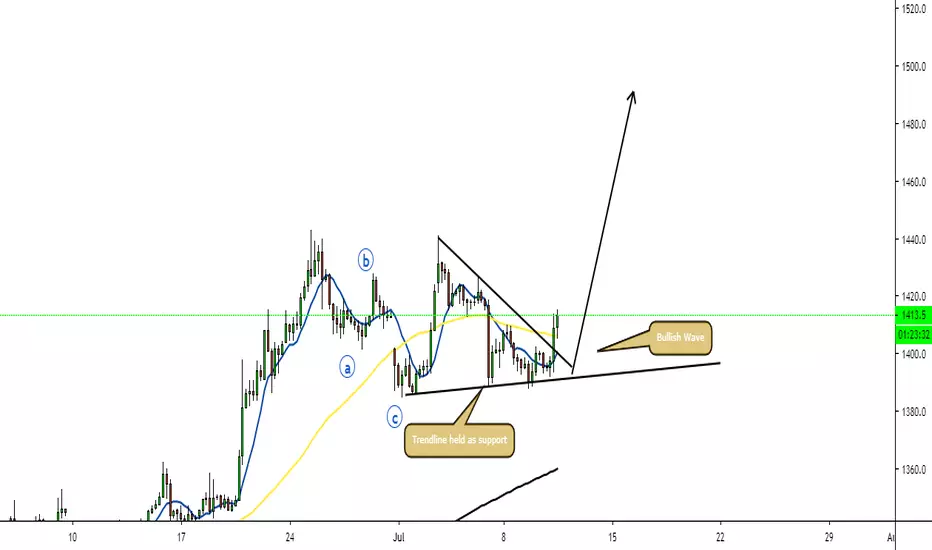
Gold Big Buy Set Up Wave AnalysisI am looking for Gold to push higher to 1500.00 price point for target 1 and eventually retest the highs around 1900.00 I believe the corrective structure is coming to an end and a big Bullish wave is in front of us.
Elliott Wave View: GBPUSD Should Remain WeakGBPUSD shows a bearish sequence from June 25 high (1.2784) favoring further downside. Near term, the decline from 1.2784 to 1.2438 ended wave ((i)) as an impulsive Elliott Wave structure. Down from 1.2784, wave (i) ended at 1.266 and wave (ii) bounce ended at 1.2735. Pair then resumed lower in wave (iii) towards 1.248 with internal subdivision also as an impulse structure of lesser degree. Wave (iv) bounce ended at 1.2513 as a triangle and wave (v) of ((i)) ended at 1.2438.
Wave ((ii)) bounce ended at 1.2581 as a zigzag Elliott Wave structure where wave (a) ended at 1.257, wave (b) ended at 1.2507, and wave (c) ended at 1.257. Pair has resumed lower in wave ((iii)) and broken below wave ((i)) confirming the next move lower has started. The move lower from 1.2581 also appears impulsive. Near term, it ended now wave (i) of ((iii)) and the pair is in the bounce in wave (ii) of ((iii)) to correct cycle from July 13, 2019 high before the decline resumes. We don’t like buying the pair and expect wave (ii) bounce to fail in 3, 7, or 11 swing for further downside as far as pivot at 1.258 stays intact in the first degree.

Elliott Wave View: NZDUSD Showing Incomplete SequenceNZDUSD has an incomplete 5 swing sequence from May 23, 2019 low favoring further upside. Short term Elliott Wave view suggests the pullback to 0.6565 on July 10, 2019 low ended wave ((X)). Pair then rallies from there as a zigzag Elliott Wave structure where wave (A) ended at 0.6737 peak.
Up from 0.6565, wave 1 ended at 0.6608 and wave 2 pullback ended at 0.659. The pair then rallied higher in wave 3 towards 0.6689, and wave 4 pullback ended at 0.6661. Up from there ended wave 5 of (A) at 0.6737 peak.
Pair is now in pullback in wave (B) to correct cycle from July 10, 2019 low before the rally resumes. We don’t like selling the pair and NZDUSD should see more upside after finishing the pullback in 3-7 or 11 swings.

Bitcoin BTC EW path - Can Wave 1 be over? W3 to 47.2k?Hi everyone here is a possible path for Bitcoin BTCUSDT.
It is possible that W1 may be over but I can be wrong. A retracement to at .5 fib around 8596$ or 7360$ (where MA 650 stand right now) is very possible. But if we are in a W2 it is possible that we retrace much more.. even 4.9k is possible. We if retrace around 8.6k I would consider W3 minimum reach to be the 261.8% fib around 36.5k or 361.8% fib at 47.2k. Best to you !

US Dollar(DXY) Short Wave AnalysisAlthough the Dollar have been gaining strength I am still long term bearish. We are retesting the trend line giving it a 3rd touch which would give us great confluence if it hold as strong resistance. Wave C of this zig zag have formed 5 waves which would mean it could be coming to a near end. I am anticipating a 3rd wave to the downside
EUR/USD Wave Analysis Buy Set Up Potential 3rd WaveI am looking at a potential 3rd of a 3rd wave which should show really strong bullish strength. I believe the corrective a-b-z zig zag that started at 1.14110 is coming near an end as wave 5 of wave c in the zig zag is forming a ending diagonal pattern. I am expecting a big push up and I will be looking at targets around 1.16000

Elliott Wave View: AUDJPY Should Remain SupportedShort term Elliott Wave view on AUDJPY suggests that the rally from June 18 low is unfolding as a zigzag Elliott Wave structure. A zigzag is an ABC structure with 5-3-5 subdivision. The rally from June 18 low ended wave A at 76.28 as a 5 waves impulse. Up from June 18 low, wave ((i)) ended at 74.77, and wave ((ii)) ended at 74.32. Pair then rallied higher again and ended wave ((iii)) at 75.62, then wave ((iv)) pullback ended at 75.3. Wave ((v)) of A ended at 76.28 and this ended the cycle from June 18 low.
Pair is currently correcting cycle from June 18 low within wave B. The internal of wave B is unfolding as a double zigzag Elliot Wave structure. Down from 76.28, wave ((w)) ended at 75.4 as a zigzag. While wave ((x)) bounce fails below 76.28, pair has scope to extend lower within wave ((y)) as another zigzag structure before ending wave B. Afterwards, pair should resume higher again. We don’t like selling the pair and expect buyers to appear and dips to be supported in 3, 7, or 11 swing as far as pivot at 73.9 low stays intact.

Dollar Index Sell Off Wave Analysis Look for a sell off on the Dollar, I believe the small correction is over.
