Bitcoin! Quick ABC 35-40% correction this week!All in the charts. That's how I simply see things :) It may take longer though, of course.
Best thing you can do is either HODL or add to your position. July will show a lot of volality but eventually Bitcoin is skyrocketing soon to $20k and beyond.
I'm personally shorting the market from $12.5k - but I wouldn't recommend shorting if you don't know what you're doing; lots of wicks and whale liquidations. Be careful.
Bitcoin still super bullish this year after this correction.
Cheers,
Leb Crypto
Elliottwaveretracement

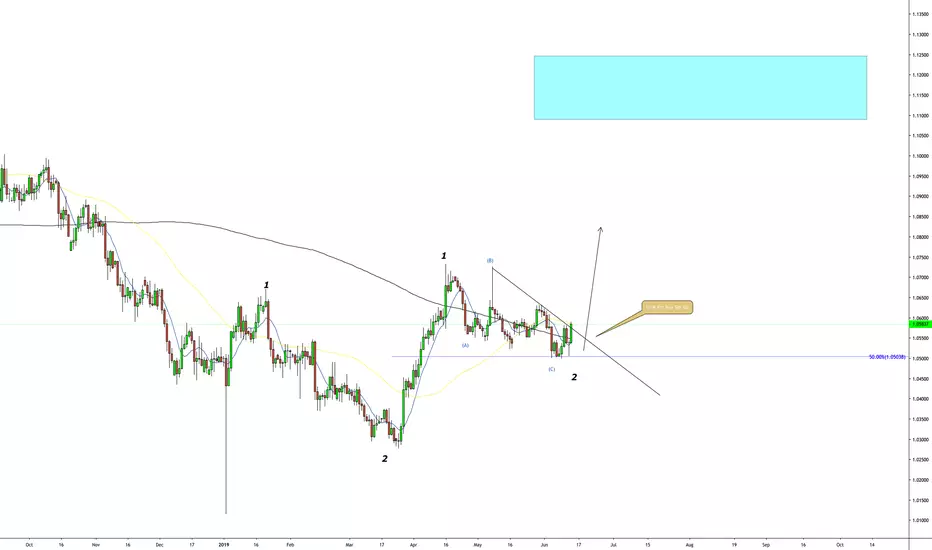
Elliott Wave View: GBPUSD Impulse Looking for Further UpsideShort term Elliott Wave view on GBPUSD suggests the rally from June 18 low (1.2505) unfolded as an impulse Elliott Wave structure. Up from 1.2505, wave ((i)) ended at 1.257 and wave ((ii)) pullback ended at 1.254. Pair then rallied higher again in wave ((iii)) towards 1.2727, wave ((iv)) pullback ended at 1.2641, and wave ((v)) ended at 1.2784. The 5 waves move higher ended wave A of higher degree. This suggests that the rally from June 18 low is unfolding as a zigzag in a higher degree. A zigzag has an ABC label and it is a 5-3-5 structure where wave A and C subdivide in 5 waves.
We have an impulsive 5 waves move from June 18 low which ended wave A of this zigzag. Wave B pullback is now unfolding as a zigzag Elliott Wave structure where wave ((a)) ended at 1.2661. Expect pair to bounce in wave ((b)) then do another leg lower in wave ((c)) to complete wave B correction. Afterwards, pair should resume the rally higher in wave C. We don’t like selling the pair. As far as pivot at 1.2505 stays intact, expect dips to find support in 3, 7, or 11 swing for further upside.

eur/usd Reverse symmetrical Triangle BreakoutEur/usd needs to re dip the lower trend line, forming a termination leading to break out north.

GBP?AUD Potential Sell Set Up Wave AnalysisLook for a Sell Off to create lower lows, I belive the current corrective structure is coming to an end

Oil Elliott Wave View: Impulsive Rally in ProgressOil (CL_F) rally from June 5, 2019 low is unfolding as an impulse Elliott Wave structure where wave 3 is currently in progress. In the chart below, we can see wave ((ii)) of 3 ended at 51.5, wave ((iii)) of 3 ended at 58.22, and wave ((iv)) of 3 ended at 56.79. Wave ((iii)) shows an extension which is typical in an impulsive structure. The internal of wave ((iii)) unfolded as an impulse of lesser degree. Up from 51.5, wave (i) ended at 54.38, wave (ii) ended at 53.28, wave (iii) ended at 57.98, wave (iv) ended at 57.04, and wave (v) ended at 58.22.
Near term, it broke above wave ((iii)) peak opening up now extension higher. While pullback stays above wave ((iv)) at 56.79, expect CL_F to extend higher. We don’t like selling Oil and expect dips to continue finding support in 3, 7, or 11 swing for further upside.

Ladder SHORT orders ETHUSDMy thoughts... Possible EW (3) correction incoming
Coin: ETHUSD
Xchange: bitMEX
Reason: RSI Div. + EW Wave count + RSI/stoch indicator
Ladder SHORT Orders 309-315
SL: Above 320
Targets R shown on Chart......
10X-25X Leverage
2%-5% acct balance
current price 311.34

Elliott Wave View Calling for More Upside in NasdaqNasdaq Futures (NQ_F) shows a higher high sequence from June 4 low, favoring further upside. Short term, rally to 7600.75 ended wave (1) and pullback to 7421.48 ended wave (2). Wave (3) rally is in progress as an impulse Elliott Wave structure. Up from 7421.48, wave ((i)) ended at 7536 and wave ((ii)) pullback ended at 7477.75. Wave ((iii)) is expected to end soon and the internal also subdivides as an internal of lesser degree.
Wave (i) of ((iii)) ended at 7541.5, wave (ii) of ((iii)) ended at 7509.25, wave (iii) of ((iii)) ended at 7721.75, and wave (iv) of ((iii)) ended at 7630. Then it ended wave (v) of ((iii)) at 7820 peak. Below from there wave ((iv)) should also be completed at 7707 low. Above from there the 5 waves move higher from June 13 low (7421.48) should soon end wave 1 at around 7847-7891. Then Index should correct cycle from June 13 low within wave 2 before the rally resumes. We don’t like selling the Index and expect the Index to continue finding support and extending higher as far as pivot at 7421.96 low stays intact. A break above April 25 peak (7879.5), if it happens, will bolster the bullish view in the Indices.

US Dollar(DXY) Sell Set Up Wave AnalysisThis week I will be looking for shorts in the US Dollar, A potential 3rd Wave to the downside. Wait for price to give us confirmation

Soybean Futures Buy Set Up Wave AnalysisLook for a Bullish wave to the upside, in either a wave 5 or wave c

USD/CAD Potential Short Set up Wave AnalysisLook for a correction back to the Orange Box, then a great sell set up

Elliott Wave View: Dow Jones Futures (YM_F) Has Resumed HigherDow Jones Futures (YM_F) broke above June 10 high (26289) suggesting that the next leg higher has started. The Index is now showing an incomplete sequence from June 3 low (24610), favoring further upside. Short term Elliott Wave view calls the rally to 26289 on June 10 as wave 1 and pullback to 25898 as wave 2. This indicates that the entire rally from June 3 low is unfolding as an impulse Elliott Wave structure. Wave 2 unfolded as a double zigzag where wave ((w)) ended at 26050, wave ((x)) ended at 26261, and wave ((y)) of 2 ended at 25898.
Wave 3 is currently in progress and subdivides as an impulse in lesser degree. Up from wave 2 low at 25898, wave (i) ended at 26153 and wave (ii) ended at 26001. Expect the Index to see a few more highs to end 5 waves up from 25898 low. This 5 waves up will end wave ((i)) of 3. Index should then pullback in wave ((ii)) to correct cycle from June 13 low before the rally resumes. We do not like selling the Index and expect buyers to appear as dips continue to hold above 25898 in 3, 7, or 11 swing

Elliott Wave View: Further Weakness in GBPUSD ExpectedShort Term Elliott wave view in GBPUSD suggests the decline from June 7 high is unfolding as an impulse Elliott Wave structure. Down from 1.276, wave (i) ended at 1.265 with internal as an impulse in lesser degree. Wave (ii) bounce ended at 1.276 as a zigzag Elliott Wave structure. Pair has now reached 200% extension within wave (iii) showing a typical extension within wave 3 of an impulse. Wave i of (iii) ended at 1.266, wave ii of (iii) ended at 1.2708, wave iii of (iii) ended at 1.257, and wave iv of (iii) ended at 1.2606.
Short term, wave v of (iii) can be complete already at 1.251 low, but so far it still does not have enough separation from the low. If pair breaks below 1.251, it doesn’t change the idea that wave (iii) should complete soon. As the third wave shows an extension, this suggests that pair should see further downside at least 1 more leg after a wave (iv) rally. Thus we don’t like buying the pair and expect pair to find sellers in wave (iv) bounce in 3, 7, or 11 swing as far as pivot at 1.276 stays intact.

Elliott Wave View: Apple (AAPL) Can See More UpsideShort Term Elliott wave view in Apple (AAPL) is calling the decline to 170.44 on June 4 as wave II. Wave III is currently in progress. Up from 170.44, Wave (1) has ended at 196.79 as a 5 waves impulse. Wave 1 ended at 184.99 and wave 2 pullback ended at 181.14. Wave 3 ended at 196, wave 4 ended at 194.57, and wave 5 ended at 196.79.
The stock is pulling back in wave (2) in 3, 7, or 11 swing to correct cycle from June 4 low. The internal of wave (2) is unfolding as a zigzag Elliott Wave structure where wave A of (2) should end with 1 more push lower into 188.46-184.42 area before a reaction higher should be seen. We dont like selling it and as long as pivot at 170.44 stays intact we expect it to extend higher.

Bearish credit call spread 85/87 June 28 for 1.16 creditTGT has clearly shown the first five parts of an elliot wave pattern, which indicate a peak and an ensued downtrend. This leads to a price target of $80 by June 27th. Max profit of $114/contract is reached at 84.72 and the breakeven is at 86.16. The maximum loss is $86/contract. This spread is 20 deltas negative, indicating our bearish sentiment. Technically, the bearish sentiment is further supported by a decreasing and negative MACD, a DMI- crossover of the DMI+, and the Parabolic Stop and Reverse indicator that switched to be over the candles.

AUD/NZD Buy Set Up!!! Potential Bullish 3rd Wave Wave AnalysisI am looking for a big push up in AUD/NZD, a 3rd wave of a 3rd wave= Money.
EUR/CHF Potential Sell Set Up Wave AnalysisLook for a break in trend line to give us more confluence of a bearish wave trend continuation

EUR/AUD Potential Long Term Sell Set Up Wave AnalysisWe could be near the end of a corrective structure that started in 2012, Look for signs of a sell off.


Elliott Wave View: Dow Jones Futures Correction to Find BuyersElliott wave view in Dow Jones Futures (YM_F) suggests that the decline to 24604 ended wave ((W)) on June 3. This decline ended the cycle from May 1 high as a 3 waves zigzag Elliott Wave structure. Wave ((X)) bounce is currently in progress to correct the cycle from May 1 high in 3, 7, or 11 swing. The internal of wave ((X)) rally is unfolding as a zigzag Elliott Wave structure. A zigzag is an ABC with 5-3-5 structure. Wave (A) of ((X)) is now in progress as a 5 waves impulse.
Up from 24604, wave 1 ended at 24938 and wave 2 pullback ended at 24684. Rally then resumes in wave 3 to 26085, wave 4 ended at 25974, and wave 5 ended at 26289. The 5 waves move higher ended wave (A) of higher degree. Short term, Index is in wave B pullback to correct cycle from June 3 low (24604) in 3, 7, or 11 swing before turning higher again in wave (C). We don’t like selling the Index. As the rally from June 3 low is impulsive, expect wave (B) pullback to hold above 24604 for at least 1 more push higher in wave (C).


Elliott Wave View Favors More Upside in Nike (NKE)Short term Elliott wave view in Nike (NKE) calls the rally from June 3 low unfolding as a 5 waves impulse Elliott Wave structure. Up from June 3 low, wave 1 ended at 78.58 and wave 2 pullback ended at 77.58. Wave 3 ended at 84.23 and subdivides as another impulse structure in lesser degree. Wave 4 pullback ended at 82.47, and wave 5 ended at 84.38 which also subdivides as an impulse in lesser degree. The 5 waves move higher ended wave (A) and the stock is now correcting cycle from June 3 low in wave (B)
The correction is proposed to unfold as a zigzag Elliott Wave structure. Potential area where wave (B) can end is 50 – 61.8% Fibonacci retracement of wave (A). This area comes at 79.69 – 80.54 where buyers can appear for more upside. We don’t like selling the stock.

Elliott Wave View: Further Strength in EURUSD Up from May 23 low, wave (i) ended at 1.1215 and wave (ii) pullback ended at 1.1115. Pair then resumes higher in wave (iii) to 1.13068, wave (iv) pullback ended at 1.12, and wave (v) of ((a)) ended at 1.1350. As wave (i) and wave (iv) overlaps, this is an example of a 5 waves leading diagonal.
Short term, pair is correcting the cycle from May 23 low within wave ((b)) in 3, 7, or 11 swing. If we assume that wave (b) is in place then potential target for wave ((b)) pullback can be measured as 100% Fibonacci extension of (a)-(b) which comes at 1.1264-1.1249 area. Buyers can appear from this area during the dips and pair can extend higher in wave ((c)). EURUSD should ideally see more upside against 1.11068 low in the sequences of 3-7 or 11 swings.

Short at the end of Wave 4NZDJPY has completed waves 1, 2, and 3 in its descent from 75.954. Wave 4 is forming and expected to retrace up to Fibo lvl 38.2 of Wave 3 (72.695). A short entry from there is possible with targets set at inverse Fibo levels 100, 123.6, and 161.8 of Wave 4 as shown on the chart.
Happy Trading
