USD/JPY Elliot Wave Buy Set UpThe correction appear to be over. Look for buying opportunities targeting the 112.000 area.
Elliottwaveretracement


S&P500: Extending Higher As An ImpulseHello Traders,
S&P500 short-term Elliott wave view suggests that the decline to $2803.34 low ended red wave 4 pullback. The internals of that pullback unfolded as Elliott wave zigzag correction. The lesser degree black wave ((a)) ended in 5 waves at $2820.5 low. Then the bounce to $2843.50 high ended black wave ((b)) bounce as a Flat correction. Down from there, the index completed the black wave ((c)) in another 5 waves at $2803.34 low.
Up from there, the rally higher is taking place as impulse structure with lesser degree cycles showing sub-division of 5 waves structure in each leg higher. It’s also important to note here that index is already into new all-time highs & both the sequence & right side tags are calling index for more upside. Above from $2803.34 low, the black wave ((i)) ended in lesser degree 5 waves structure at $2874 high. The pullback to $2846.25 low ended black wave ((ii)). A rally from there unfolding in another 5 waves structure within black wave ((iii)) with lesser degree cycles in blue wave (i), (iii) & (v) expected to unfold in 5 waves structure. We don’t like selling the index and expect buyers to appear in 3-7 or 11 swings against $2803.34 low in the first degree.

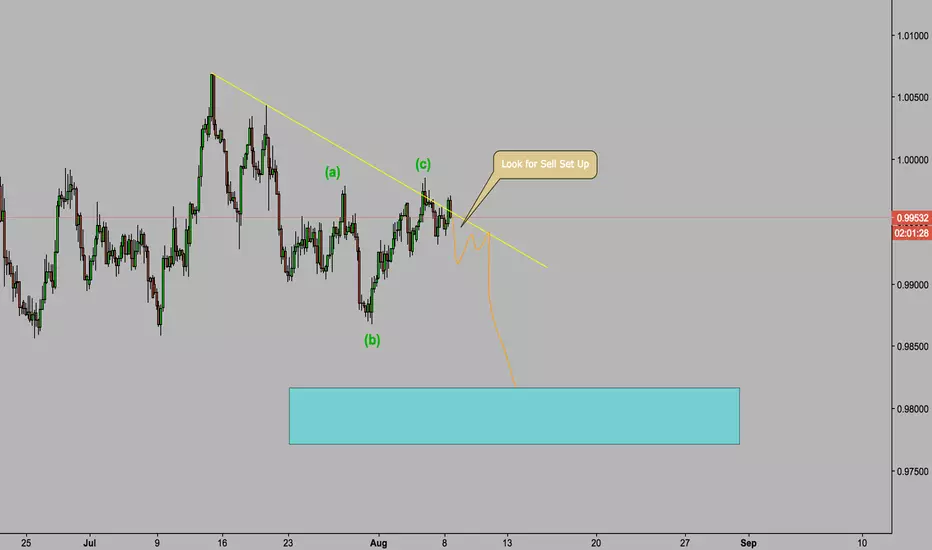
USD/CHF Elliot Wave Buy Set Up Swing TradeWatch for the correction to come to an end on the smaller time frames. Look for an impulsive wave to the upside follwed by an correction to get long on the Buy Set up.

IYR Elliott Wave Analysis: Tracking Recent Price ActionHello Traders,
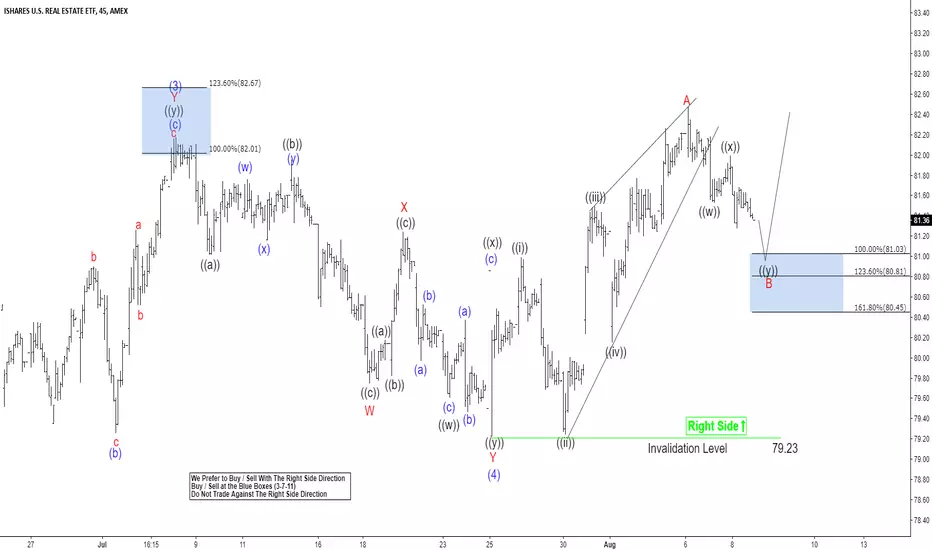
IYR ended the cycle from 03/23/18 (72.71) low at the peak of 07/06/18 (82.20) in blue wave (3). Below from there, the ETF ended the correction from 07/06/18 (82.20) peak in blue wave (4) at 79.23 low.
Up from there, the ETF ended the cycle from 07/25/18 low in red wave W at 08/20/18 (83.62) peak. The internals of that move unfolded as a Elliott Wave double correction where it ended black wave ((w)) at 08/06/18 peak (82.46), black wave ((x)) pullback at 08/13/18 low (80.55) and finally black wave ((y)) of red wave W at 08/20/18 peak (83.60). The ETF is currently in the progress of correcting the cycle from 07/25/18 low (79.23) in 3-7 or 11 swings in red wave X.
Near-term focus remains towards 81.74-81.48, which is 100%-123.6% Fibonacci extension area of black wave ((a))-((b)) to end black wave ((c)) of red wave X pullback. Afterwards, the ETF is expected to find buyers for red wave X higher ideally or should do a 3 waves reaction higher at least. We don’t like selling it into a proposed pullback as the right side remains to the upside.


EUR/GBP Elliot Wave Analysis Sell Set Up!Look for a impulse wave to the downside to break out of the corrective channel then a small correction for a sell set up!

Overview of market direction and condition.Long video, potential ides for this move in the dollar and yen pairs

EURUSD Elliott Wave Analysis: More Weakness ExpectedHello Traders,
EURUSD short-term Elliott Wave analysis suggests that the bounce to 1.1747 high ended red wave 2. Down from there, red wave 3 ended at 1.1299 low. The internals of that decline unfolded as impulse structure with lesser degree cycles are showing sub-division of 5 waves structure lower in it’s each leg lower i.e Black wave ((i)), ((iii)) & ((v)). While the sub-division in Black wave ((ii)) & ((iv)) unfolded in 3 wave corrective sequence.
Down from 1.1747 high, the initial decline to 1.1529 low ended black wave ((i)) in 5 waves structure. The bounce to 1.1627 high ended black wave ((ii)). Below from there, the decline to 1.1364 low unfolded in 5 waves structure & ended black wave ((iii)). Up from there, the 3 wave bounce to 1.1431 high ended black wave ((iv)). Then the decline to 1.1299 low ended black wave ((v)) & also completed the red wave 3 lower. Above from there, red wave 4 bounce remains in progress in 7 or 11 swings for the correction of 1.1747 high before further downside is seen provided the pivot at 1.1747 high stays intact. We don’t like buying the pair and prefer more downside against 1.1747 high in the first degree.

AUDUSD Elliott Wave View: More Downside Is ExpectedHello Traders,
AUDUSD short-term Elliott wave view suggests that the bounce to 0.7455 high ended blue wave (B). Down from there, the pair has broken to new lows confirming the blue wave (C) lower. The internals of the decline is unfolding as impulse where red wave 1, 3 & 5 are expected to unfold in 5 waves structure. While red wave 2 & 4 can be can be any 3 waves corrective pattern i.e either double, triple three etc.
Down from 0.7455 high, red wave 1 is proposed complete at 0.7201 low. The internals of that decline showing sub-division of 5 waves structure in lesser degree cycles. Where black wave ((i)) ended in 5 waves structure at 0.7431. The black wave ((ii)) bounce ended at 0.7445. Then black wave ((iii)) ended at 0.7249 low in lesser degree 5 waves structure. Up from there, the bounce to 0.7299 high ended black wave ((iv)). Below from there, the decline to 0.7201 low ended black wave ((v)) in lesser degree 5 waves structure and also completed red wave 1. Above from there, the pair is doing a red wave 2 recovery & expected to fail in 3, 7 or 11 swings as far as a pivot at 0.7455 high stays intact for further downside. We don’t like buying the pair & prefer more downside against 0.7455 high.

GBPUSD Elliott Wave View: Calling For More DownsideHello Traders,
In this short-term analysis, we will have a look GBPUSD.
Short-term Elliott wave view suggests that the rally to 1.3217 high ended red wave 2 bounce. Down from there, red wave 3 was taking place as impulse structure with lesser degree cycles are showing sub-division of 5 waves structure lower in it’s each leg lower i.e black wave ((i)), (( iii 0.00% )) & ((v)). While the sub-division in black wave ((ii)) & ((iv)) unfolded in 3 wave corrective sequence.
Down from 1.3215 high, the initial decline to 1.3081 low ended black wave ((i)) in 5 waves. Up from there, the bounce to 1.3172 high ended black wave ((ii)) in 3 swings as Elliott wave zigzag . Below from there, the decline to 1.2722 low unfolded in 5 waves & ended black wave ((iii)). Above from there, the bounce to 1.2826 high ended black wave ((iv)) in 3 swings as zigzag . The current view is suggesting that it ended black wave ((v)) of red wave 3 and the pair is expected to do now a red wave 4 bounce in 3, 7 or 11 swings before further downside is seen. We don’t like buying it and prefer more downside against 1.3217 high in the first degree.


DAX Elliott Wave Analysis: Bounce Can Be TemporaryHello Traders,
In this short-term analysis, we will have a look at the German DAX Index.
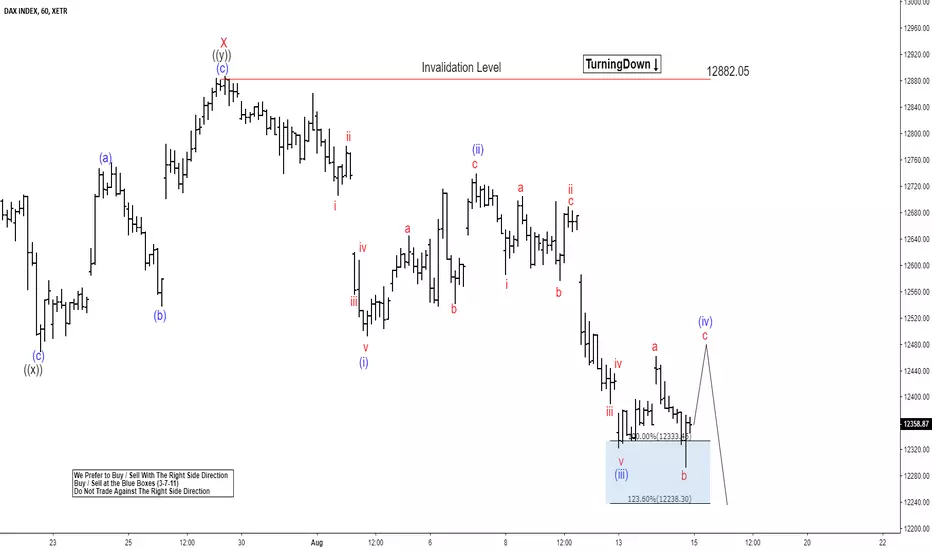
DAX short-term Elliott wave analysis suggests that the rally to 12882.05 high ended red wave X bounce. The internals of that bounce unfolded as Elliott wave double three structure where black wave ((w)) ended at 12640.87. Black wave ((x)) ended at 12468.68 and black wave ((y)) of red X ended at 12882.05 high.
Down from there, DAX is currently suggesting that it is unfolding as a potential 5 waves structure. Where blue wave (i) ended at 02/08/18 low (12491.53), blue wave (ii) pullback at 07/08/18 peak (12740.66), and blue wave (iii) at 08/13/18 low (12321.45). Currently, it is in the progress of making a pullback in blue wave (iv) before extending 1 more leg lower in blue wave (v) before a 3 waves bounce higher can be seen. We don’t like selling it.
XLK Elliott Wave Analysis Suggesting More UpsideHello Traders,
In this Elliott Wave analysis, we will have a look at the Technology ETF.
The ETF ended the cycle from 06/28/18 low in red wave 1 at the peak of 07/25/18 (74.26). The internals of red wave 1 unfolded as a 5 wave Elliott Wave impulsive structure. Where black wave ((i)) ended at 06/29/18 peak (70.08), black wave ((ii)) pullback at 07/02/18 (68.73). Followed by an extended black wave ((iii)), where the internals also unfolded in a 5 waves structure. Black wave ((iii)) ended at 07/13/2018 peak (72.72) and black wave ((iv)) pullback at 07/16/2018 (71.68) followed by black wave ((v)) of red wave 1 which ended at 07/25/18 peak (74.24).
Below from that peak, the correction in red wave 2 ended at 07/30/18 low (70.30). The internals of red wave 2 unfolded as Elliott Wave Flat structure where it ended black wave ((a)) at 07/26/18 low (72.68), black wave ((b)) pullback at 07/26/18 peak (73.35) and black wave ((c)) of red wave 2 at 07/30/18 low (70.30). Up from there, it ended the cycle from 07/30/18 low at the peak of 08/09/18 (73.91) in black wave ((i)). Below from there, it is currently in the progress of correcting the cycle from 07/30/18 low in 3-7 or 11 swings before moving higher again.
Near-term focus will be on the 100%-123.60% equal legs extreme area of 72.45-72.15 from 08/09/18 peak where we expect a reaction higher for new highs or at least a 3 wave’s bounce. We don’t like selling it and prefer more upside as long as the pivot at 68.28 low in our distribution system stays intact.

EUR/AUD Elliot Wave Sell Set Up Corrective StructureLook for the corrective structure to end soon and price to break out impulsively to the downside targets

USD/JPY Elliot Wave Analysis Watch for price to breakout of the corrective channel for a buy set up to finish the Flat correction then the sell set up after the structure is complete


Elliot Wave Analysis USD/JPY Corrective Wave Structure ExplainedWatch as I explain some basic Elliot Wave Concepts of Corrective Formations and anticipating the next waves. I Also breaks down the idea of an IF-Then-Thought-Process using Elliot Wave and reacting to price.

WHITHER DJIA?! MOON SHOT OR FISH TANK!?! COMPARE TO MAY CHANNEL After Tuesday's short squeeze a lot of us got stopped out and irritated bears are wondering; "WTH is it DOING?!"
After I calmed down a bit, licked my wounds and smoothed out my fur, took a hard look at the chart. Then shorted again today.
Pattern now unfolding looks a heckofalot like May's behavior after the runup three months back. Now Tues looks like a BullTrap and yet another fakeout squeeze.
Notice the same 'double-top' action, short-squeeze after first downtrend fakeout, then a descending triangle leading to the sheer drop.
Significantly, May's pullback was 0.50 Fibo only and did not test the channel bottom. That came later, in the June Swoon.
Elliot wave theory 'alternating wave hypothesis' suggests that a shallow wave is followed by a deep strong trough, in turn by a shallow wave.
Maybe bullhockey, but after the strong cup-and-handle breakout in July I wouldn't bet on a really steep/deep decline. Could happen but...?! Possibly a .382 Fibo = 25020.
Strong support now at the former resistance level could springboard the index up to next bullish impulse, note horizontal arrow > support tested, retested in cuphandle.
If S1 breaks: S2 at 24844 (Fibo 0.50); S3 at 24668 (Fibo 0.618; tested in the cup); S4 at 24418 (Fibo 0.786, bottom of the cup), which lands squarely on the lower trendline.
Notice: Height of triangle in May = depth of drop; if we get that again in August, Dow might retrace to 0.382 Fibo and bounce. Don't get squeezed- watch it real close...
Also noteworthy: one page contributor has observed the market highs/lows have coincided with Moon phases - high 24585 was at Full Moon 07/26/18; look for a low around the New Moon on Friday, 10 August, eh?! Maybe silly but there it is...
Test of bottom trendline would be a long drop, and seems unlikely now, but the damned thing has already done the impossible, so don't count it out.
Other similarities suggesting imminent corrective wave: 'exhaustion gap' up on Tues followed by rapid retracement; a 'shooting star' Weds attempt to recover to Tues HOD but fell short at 25480, rejection leading to strong selloff end of day; low volume on up days, increasing volume on down days; RSI: Neutral. August is tied for weakest month of year with October. BUT August is also often a 'pivot month' in which the trend reverses. SO; whither Dow? Maybe a little off the top please, then resume the Moon shot...
Good luck traders!
> "Going to the Moon... after a brief detour through Pandemonium and Nether Regions"

OIL Elliott Wave Analysis: Extending to the DownsideHello Traders,
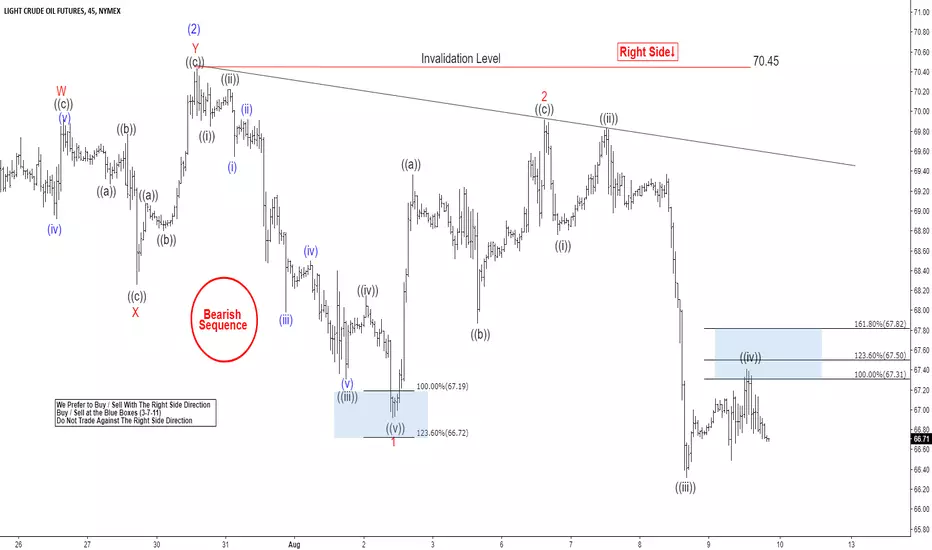
Short-term Elliott wave analysis suggests that the bounce to $70.44 high ended blue wave (2). The internals of that bounce took place as Elliott wave double correction where red wave W ended in 3 swings at $69.92. From there, the pullback to $68.26 completed the red wave X in 3 swings. Then a bounce higher to $70.44 high ended red wave Y in another 3 swings & also completed blue wave (2).
Down from there, the decline is taking place as Elliott wave impulse within blue wave (3) lower with the sub-division of 5 waves structure in red wave 1, 3 & 5. The initial decline from $70.44 high to $66.92 low ended red wave 1. The lesser degree cycles within that decline also unfolded in 5 waves structure & ended black wave ((i)) at $69.91. Black wave ((ii)) ended at $70.22, Black wave ((iii)) ended at $67.31 low, black wave ((iv)) bounce ended at $68.15 and black wave ((v)) of red 1 ended at $66.92 low. Above from there, the bounce to $69.92 high ended red wave 2.
The internals of red wave 2 unfolded in 3 swings as Elliott wave zigzag correction where black wave ((a)) ended in 5 waves at $69.36. Black wave ((b)) ended at $67.87 low and the bounce to $69.92 high ended black wave ((c)) of 2. Down from there, red wave 3 remain in progress in another 5 waves and as far as bounces fail below $69.92 high and more importantly the pivot from $70.45 high stays intact instrument is expected to see more downside. We don’t like buying it as the right side tag is lower.
IYR Elliott Wave Analysis: Pullback can Provide Buying ChanceHello Traders,
In this Elliott Wave Analysis, we will have a look at the Real Estate ETF (IYR).
IYR ended the cycle from 03/23/18 (72.71) low at the peak of 07/06/18 (82.20) in blue wave (3). Below from there, the ETF ended the correction from 07/06/18 (82.20) peak in blue wave (4) at 79.23 low. Up from there, it broke already to new highs, confirming that the next extension higher has started.
Near-term IYR ended the correction from 07/06/18 (82.20) peak in blue wave (4) at 79.23 low. The internals of blue wave (4) unfolded as Elliott Wave double correction which ended red wave W at 07/18/18 low (79.76), red wave X pullback at 07/19/18 peak (81.26) and red wave Y of blue wave (4) at 07/25/18 (79.23).
Up from there, the ETF ended the cycle from 07/25/18 low in red wave A at 08/06/18 (82.50) peak. The internals of that move unfolded as a leading diagonal where it ended black wave ((i)) at 07/26/18 low (81.01), black wave ((ii)) pullback at 07/30/18 low (79.24), black wave ((iii)) at 07/31/18 peak (81.51), black wave ((iv)) at 08/01/18 low (80.15) and finally black wave ((v)) of red wave A at 08/06/18 peak (82.50). The ETF is currently in the progress of correcting the cycle from 07/25/18 low (79.23) in 3-7 or 11 swings in red wave B.
Near-term focus remains towards 81.03-80.81, which is 100%-123.6% Fibonacci extension area of black wave ((w))-((x)) to end red wave B pullback. Afterwards, the ETF is expected to find buyers for red wave B higher ideally or should do a 3 waves reaction higher at least. We don’t like selling it into a proposed pullback as the right side remains to the upside.
Elliot Wave USD/CHF Potential Sell Set UpI believe price have completed an Flat correction now watch for an impulse to the downside then a correction to get Short.
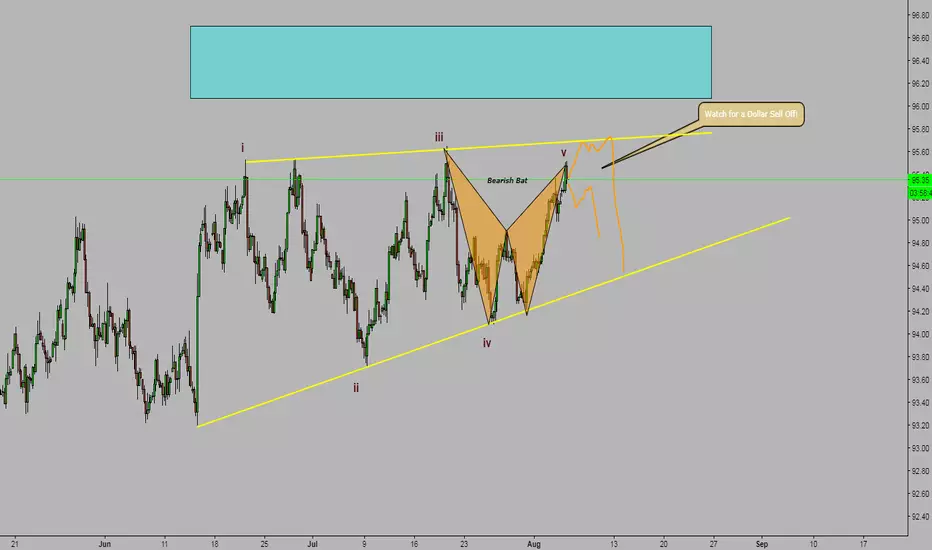
Elliot Wave DXY Dollar Sell off Set Up Ending DiagonalThere is a strong possibility that we will see a US Dollar Sell off. We have a completed Bearish Bat and price is at a strong level of Supply. Also price is taking the shape of an Ending Diagonal Elliot Wave formation. I am getting out of my long positions where I have been buying the Dollar. Watch for this set up!