HEAD AND SHOULDER IN BANKNIFTYHEAD AND SHOULDER IN BANKNIFTY.
This is not a trading idea but and educational thing to know...!
Thanks
Elliottwaveretracement

EWT – Is Natural Gas Prepared for a Reversal?In our previous article, we discussed impulsive wave C and its continuation. On 20 January 2023 , Price achieved our all given targets.
Click here -
-----------------------------------------------------
Timeframe :
MCX Natural gas has accomplished the corrective wave B and started falling for impulsive wave C. Price has given a reversal from previous wave C, but it is no conclusive evidence that it has completed wave c.
When it comes to confirmation, Traders should watch the level of 313 . If the price breaks out the 313 , it will enter into the parallel channel. Traders can buy for the following targets: 321 – 340 – 366 .
Don’t forget prices are moving outside the channel, which is a negative point for traders. Bearish continuation is possible if the price sustains below wave (4).
I will update further information soon.

BTC ZigZag Confirmation pendingLong term zigzag is about to be confirmed within the next month. We need a higher low, followed by a break of the local high to confirm this thesis.

Correction until March and then Bottom 6.25kI think we haven’t reached the EW bottom from the all time high but due to this quick spike we are in a bull trap correction. This is how I see it playing out before ultimately coming back down to possibly 6.25k. My next level up is around 26,5

AUDJPY SELLAudjpy in the 4 th wave structure , abc correction , a cute impluse ride is going to begin towards the downside :) let's see how it plays out


AUDCAD :Elliot Analysis 4hr 340 pip Hello guys. According to the Chart of AUDCAD all of things be clear and it's not to describe any word.

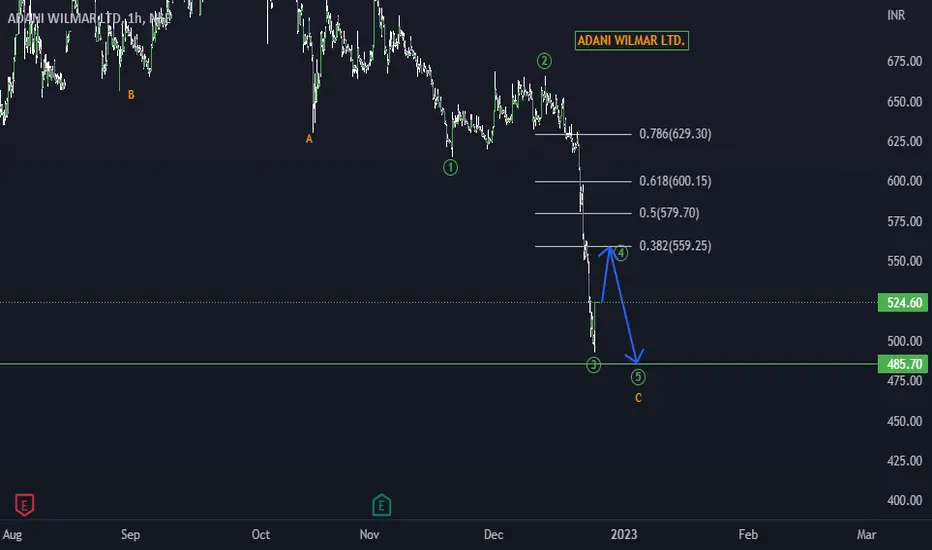
The pullback in Adani Wilmar Ltd may be short lived.The pullback in Adani Wilmar Ltd may be short lived.
Adani Wilmar Ltd looks in final stages of correction.
Yesterday move was 3rd of C wave and today's move is 4th of C wave.
The current upside may be up to 559-60.
We can go long in AWL near 485 with minimum of Risk.
Wait and watch...! 485-486.
Regards
NIFTY 50 Elliott wave viewHey guys !
Please check out the latest count in nifty as per Elliott wave theory. The nifty look in a retracement for last impulsive move from the lows of Jan 2022 and to the top of 1st December 2022. In my view the nifty has completed its wave 1 downwards and retracing for wave 2 upside, if it retraces upto 61.8% then we may start falling from 18679 that is the level of 61.8% of wave (i) downwards.
All counting are marked on the chart. This is strictly for educational purpose.
Your inputs are highly appreciated.
Thank you.

TQQQ bullish scenario This is the bullish scenario for TQQQ i think we will hit the support at A but a reversal www.tradingview.com could take place at that point

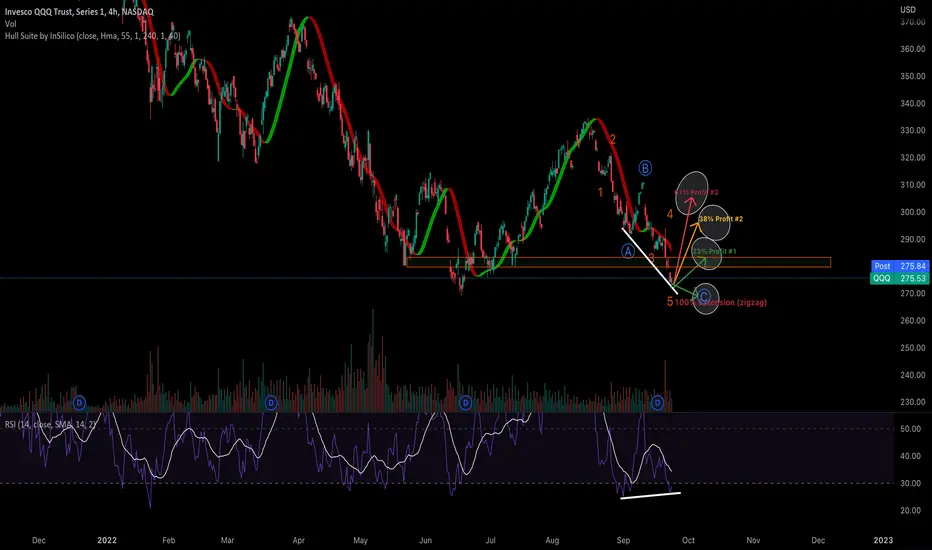
QQQ reversal soon?www.tradingview.com [/urlOk so with the divergence on the 4 hr it is very possible wave 5 is complete, But we have a zigzag formation that has not been completed yet, C will mark the spot at 100% extension, if we were to reverse here these are some levels to watch. I know most people are bearish and so am i BUT the market has never tanked when people expected it too, that's the only thing keeping me a little bullish, also a lot of people are shorting the market so it would be a perfect time to make a big squeeze,
OKBUSDT : Elliot Waves analysis DailyHello friends, as it is clear from the chart of this cryptocurrency (OKB exchange), the chart shows the formation of descending wave C after waves A and B, and so far waves 1 and 2 have been formed, so we are looking for a sharp drop for wave 3. It is possible. The news of the bankruptcy of this exchange may be a help for its downfall.

XAUUSDSomething like this loading in my mind on gold ! dump is incoming , ! let's see how it plays out !!

Gold/XAUUSD Elliott wave analysisGold is Short till spotted area in the chart.
Wave 1 scenario is more probable.

LTIM: Elliott Wave ViewHey Guys !
Hope you all doing well, I really was busy in last 1 month and could not upload my views on the stocks.
Today seen the chart of LTIM (Larson and Toubro Infotech: Mindtree).
It had finished its 5 wave rally near 7588.80 on Jan 04.2022. Being in correction for the entire 2022, now it seems, it has completed its correction near 3733.30 on May 26.2022 (more than 50% from the all time high). Keeping that low as a reversal point I found a diagonal structure formed from May 26 2022 to Nov 15 2022, I have counted them as a five wave structure.
To me it looks, it already have corrected about 61.8% of the move from May 26 2022 to Nov 15 2022. In a diagonal structure we assume that a correction of nearly 61.8% to 78.6 % is a healthy correction.
So guys we can further see 4081.50 level if it correct 78.6% but in my view it seems it has given the signal of reversal.
My invalidation point will be 3733.30 that is the low of 26 May 2022.
This analysis is only for educational purpose any losses will be sole responsibility of the traders/investors.
Thank you for watching this chart. if you liked the analysis please hit boost button.
Regards

Depth of corrective waves. Elliott Wave.Elliott Wave Guidelines:
Depth of Corrective Waves
Understanding Elliott Waves is much more then the basic rules and 3s and 5s. A largely underused aspect of Elliott Waves is the Elliott Wave Guidelines. These go beyond the guidelines for each specific pattern and are meant to assist in determining the most probabilistic wave pattern. This is just the primary guideline of this larger Elliott Wave guideline.
If you have found this inspiring/helpful, please consider a boost and follow! Also, check out the links in my signature to get to know me better! Cheers!

OFSS counter trend rally OFSS is in counter trend rally as a wave ABC, in which wave A and wave B are completed and now possibly we are ready to unfold wave C of B retracement in daily time frame.
Price is in upper part of Bollinger band in daily
Macd in daily positive crossover and Uptick
Macd in weekly positive crossover and Uptick
Rsi in daily above 60 uptick
Dmi adx also positive in daily time frame
Most traders treat trading as a hobby because they have a full-time job doing something else. However, If you treat trading like a business, it will pay you like a business. If you treat like a hobby, hobbies don't pay, they cost you....!
Disclaimer
I am not sebi registered analyst
My studies are Educational purpose only
Please consult your Financial advisor before trading or investing
I am not responsible for any any kind of profit or loss

NAS100 Develops Aggressive Bearish CD leg
GLOBALPRIME:NAS100
TRADE PLAN
INSTRUMENT: NAS100
TIMEFRAME: H4
DESCRIPTION
Looks like the market develops a Bullish BAT pattern.
A plan is to trade CD leg as it develops.
Entries and take profit levels depicted on the chart.
DISCLAIMER:Charts are educational not investment recommendations

Apple W X Y Correction Apple seems to be in a complex W X Y correction at the moment based on the Elliott waves. We saw the current top of Apple stock on Dec 13, 2021 at $181. Since then, we have been in a correction that has reached almost -30% at its lowest point. But is that it for Apple or does it go even further south?
The top so far was the end of wave (3) in the Intermidiate Cycle. We are probably not at the end of a wave 1, as the correction has been rather sideways, so the market emotion seems to be mostly still positive at Apple. Theoretically, wave (4) could have already found its low at $129 and we have been in an upward movement again since then.
However, since Apple shows some weaknesses again at the end of this movement and the bears still have a strong presence in the market, the approach of another low is quite likely. If we are really in a W X Y correction, it is quite possible and likely that the extension of 1.618 or 1.786 is approached. For Apple, this would be a trend reversal area between $126.57 and $121.07. However, if the low above the 129$ holds, we are now already in the 3 of the wave (v) of the III and prices of over 211$ are possible in the medium term.
How can I tell which path will occur?
If Apple sustainably exceeds $157.76, a bullish move is quite likely. We will have a final confirmation at the resistance of 176.20$.
In the long term, values of 275$ are quite possible before the next major correction. So a price range of almost 60% starting from the current price.
Long term view:

AAPL: Elliot Wave Price ActionHello friends, after retesting the base, Apple returned to the top and could not complete the failure, so it is expected to test the higher level.

MASKUSD: Elliot Wave 15minHello friends. According to chart we see the correction "abc" to reach the 2.66 price and then start downtrend.be profit... like and share.
Thanks..

In terms of Elliot waves, three scenarios can be considered for The first scenario is to start the upward movement from now
In the second scenario, we can move up from now on, but in the future we will see weakness in the upward direction and we will move down again within 5 waves (flat correction pattern will be formed).
In the third scenario, we have to move down through 5 waves, of which 3 waves have been completed so far and we are now in wave 4. So we have to have another downward wave. The maximum amount of this decrease is up to the level of 14 thousand dollars.
Which scenario do you agree with?

GBPUSD Triangle range?
Triangles are said to be most difficult to forecast.
Easier to think 12345 then ABC retrace comes. looks like we are in the B wave (possibly triangle pattern).
