Silver market catches airSilver is performing magnificently, exactly in the momentum moves envisioned by the Elliott waves. At the moment, we are in the wave (iv) of the . The wave (iii) we have completed at the high of $ 21.3 A slope of almost 19% in less than a week. Where else is there something like that?
We reach the end of wave at least at the 1.618 extension at 22.135$, but also the 200% extension at 23.12$ can be reached easily.
Often the fifth waves reach the 1 extension of the wave, which is approximately at 22.8$. So, an overshooting wave can be expected according to the current structure. Good for all who are invested in silver.
The (iv) should bottom at the 0.382 retracement at $20.020 and then extend the last impulse wave before we correct again in the .
Elliottwaveretracement

Adani WilmarAdani Wilmar wave analysis:
Adani wilmar is doing well in terms of waves.
So far we have done wave 1, wave 2 also looks completed.
Now we are in a non-convincing up move but it looks like adani wilmar is making space for upward move.
Investor can invest on advice of their financial advisor.
This chart is not a trading/investing advice.
Please ask your experts for any such activity.
Every level which has its importance is depicted on the chart, you may ask for any doubt thereon.
Thank you
Regards

BTC Prediction, Bearish!?!if it is in a zig zag correction then it will do something like this. Most likely however, wave 3 will be longer etc and the first 5 wave move is just an estimate of the usual fib points each wave reaches. The whole zigzag will probs reach 0.5 of larger wave 1, which we will then see btc impulse down quite hard i presume if this is all true.
what are your thoughts?

Elliott Wave Theory & BTC Decline/Bottom...??Haven't published in a while, and hardley ever use Elliott Wave as a trading hedge, but after some research , AND I SHOULD HAVE FINISHED THIS LAST NIGHT BEFORE TODAY'S DROP! I have found several ways to measure the BTC Bottom.
80%-85% drawdown from ATH on every bear market = $13175
Re-test last Bull Run highest Monthly close = $14000
Then there is the Elliott Wave Theory... 5 waves, with 3 larger down and 2 up like in the chart.
Text Book Wave Theory states 1 and 5 are same percentage drawdown. This chart is -50%....
and 2 and 4 should be same percent bounce up.
We have that confirmed at +43% & +45%
Wave 3 down should be the biggest percent down...confirmed at -60%
Zoom out to the 2Wk or the Monthly chart and you can easily see the wave counts and the similarities in the waves.
Also play with the Chart Above to read stats
Another way to estimate Elliot wave #5 down is to use a Fib Retracement from the previous low of #3 to the High of #4 extensions should be downward.
The traditional wave #5 falls to the range between the 1.272 and the 1.414 ...Highlighted in the chart
Now combine all the stats abd the 5 Day BBWP turning up and Stochastic turning down ...BTC should go lower
Wave #5 should also have 3 inner waves, down first...Today's draw, possibly a bit more, then a bonce up and then further down to the area...
where ALL HIGHLIGHTS CROSS ON CHART
between $14600 & $15600
also be prepared for the 1.618 to be a wick at the 85% in the 13K bracket where the monthly closing high of the 2018 bull run hit
Look at world markets and the DIXY too and OIL costs, the FED all that BullShit...they want all markets lower and more people unemployed and spending less money(ramble)
We'll see how this pans out and revisit in a few weeks

GOLD - Long-term buy opportunity (end of ABC in primary degree)
Hello traders, today we will provide a long-term trading idea. It is that long-term that you could use it as an investing idea and buy gold (the asset, not the derivative) and hold it.
The chart shows you the corrective pattern that started in July 2020 is in the last stages and it can be ending soon. The price is now in wave 5 in the intermediate degree (blue), which will end the whole corrective structure ABC in the primary degree (green) and after that, we expect the motive bullish wave 5 in the cycle degree (orange) will start.
We will be monitoring this asset when the targeted price for this correction to end is reached (1672 is the level). From this point, we expect that the gold will end the corrective cycle at any time and will start a rally. The zone where this turn would happen is from 1671 to 1373. It is a huge zone, this is due we are dealing with a daily time frame structure and even though the size of the zone is large, it is also the potential target. We cannot define precisely the target yet but it would be above the 2200 level.
We do have a trading system that reduces a lot the size of the zone (not the target, therefore, the R:R ratio increases a lot). If you have a trading system (supply and demand zones, volume profile, set of rules of indicator…) you can apply it when the price is inside this green zone and the chances the trade will succeed will increase a lot.
Important note: it is a daily zone, use the signals that trigger the trade according to it (a 5 minutes signal probably will not be strong enough to turn a daily structure)
Reasons why we believe it is going to work:
1- The Corrective structure is clear and the chances that this ABC structure becomes an impulse and stops us out are, at this moment, low. We will monitor it in any case and update you.
2- The USD cycle- The USD is approaching the end of a cycle where it has been dominated by USD strength. When this cycle ends, a cycle where the USD is going to be weaker will start and this will help all the commodities priced in USD, and of course, gold is one of them, to have a bullish cycle that could be pretty powerful. This trade is long-term, so we should not expect a rally in gold in the following days, it can take a few weeks for the gold to end the corrective structure and also for the dollar to end the bullish cycle.
3- The FIAT currencies situation. Central banks have been continuously printing money which has devaluated, at least in common people’s perception, the value of the currencies. This can push investors and common people to buy gold to try to keep their savings protected from a potential hyperinflation of the currency of their savings.
4- Gold is not infinite– The quantity of supply of gold is not infinite and it is difficult to be massively manipulated. Therefore, gold will always have value and these supply constraints will make the gold more difficult to have a significant collapse in the price. In addition, gold has the perception of a value preservation asset. So, in case of an economic crisis (which is predicted in some parts of the world), it can increase the demand for gold.
Always keep in mind that risk management is, at least, as important as the entry-level or the SL. Remember the quote “If you do not manage the risk, you will not have any risk to manage”
The market is always repeating the same type of defined structures. There are only two main wave types: the motive wave and when the motive wave ends it starts a corrective wave. Within them, there are only 3 motive waves structures (Impulse, leading diagonal, and ending diagonal) and 5 main types of corrective structures (ABC, WXY, Flats, triangle, WXYXZ (triple correction))
Learning them and being able to spot them in the price action graphs will completely change the way you trade as these structures will provide entry point areas, invalidation levels, and targets for the trade.
Have a safe and profitable trading day
Please feel free to express your ideas and thoughts in the comment section.
DISCLAIMER: This analysis is not intended to encourage any buying or selling of any particular securities. Furthermore, it is only the explanation of what we are going to do and it should not be a basis for taking any trade action by an individual investor. Therefore, your own due diligence is highly advised before entering a trade.

Long term prediction for TQQQ Long Term prediction for TQQQ , risky making a prediction this far out but with total world fundamentals being negative i don't see us returning into a bull market BUT there is a bullish scenario in this TA but im waiting on a few things to unfold before posting, PLEASE if your a expert at elliots wave theory and u have pointers please let me know. Thanks! www.tradingview.com

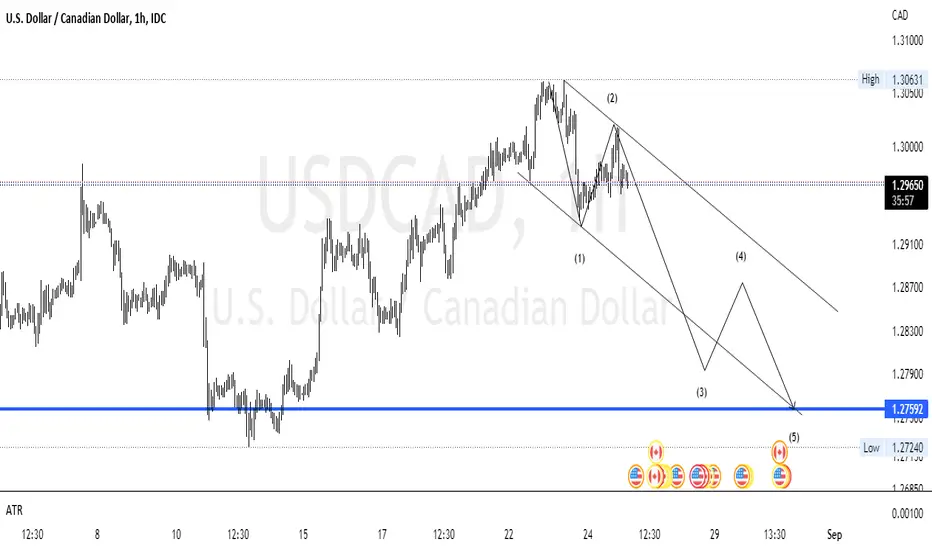
USDCAD: Elliot Wave 1hrAccording to Elliott's view, we seem to be in a five-wave c-wave and I expect this range to move.
ETHEREUM Has Turned Into A WXY and this is what it means... Welcome to NewWave Traders
Here you will find that I use Elliott Wave as my main pattern identification system, however I pair it up with 3 other components to create the NewWave System that allows me to navigate the market the same way, thus providing consistency in my trading results, confidence in my execution and makes trading much more enjoyable and reliable.
Follow my trade ideas and I'll be keeping them updated weekly every Monday for #BTC and #ETH and Every Friday for #Altcoins.
Today's chart is on Ethereum. It was climbing impulsively, but the last leg it printed with a hard rejected made a 7 swing pattern shifting it to a wxy as the top no longer qualifies for being an expanded B wave. The rejection was hard enough to be seen as impulsive, which places high probability on it being the first wave of a larger pattern.
As such, I'm looking for a larger B wave rally to show bullish strength as we can then consolidate sideways with higher probability vs. A shallow rally that gets rejected under the .618 fib retracement and the red supply block which then places more weight on the impulse down printing.
As of this analysis I think the green ABC will be the one to play out, but the inflection point between the 2 counts is still a bit away and we'll know more on the retracement in the short term.
See my signature below on how to connect with us further to help you with your trading.

🟩GMTUSDT BUY SPOT☑️GMTUSDT
🟩Buy spot at 1
✅Target
1.30
1.75
Share your opinion in the comments and support the idea with Like.
Follow me on tradingView, if you don't want to miss my next analysis or signals.
Thanks for your support!

EURUSD (Primary wave 4)This is the
Primary wave 4 of wave 3 (particularly the C wave)
Expecting
target 1 1.04
target 2 1.06
Then continuing for Primary 5
Note: All 12345ABC start with the Primary Cycle

Elliot Wave on Bitcoin Bitcoin entered a distribution zone(down flag formation) again. It has a higher chance of breakout down again to complete an Elliot Wave Trend.
(Not investment advice)

Elliot wave TheoryJust an idea, speculation. This could indicate another push down but the macd is still strong and it is above 50 so this can very much be wrong.

BTC more dump then to the moon 90k...BTC in big impulsive waves to the up side it start before covid drop and after covid we pushed up in big wave 3 and it finished
now we in wave 4 correction and it took the shappe off expanded flat correction
the expanded flat made from 3-3-5
we finishd the first 3 wave from 65k to 30k then we finished the next 3 waves from 30k to 69k and now we in 5 waves down i expect more down side then we will see btc make a new all time hihg ,
( we don't want btc to break the 13900 or this will change the plan )
========================================================
things are bullish for me ,
RSI MACD Else
USD will have one more push up then it will crash again ,


Silver XAG/USD - LongLooking at the daily chart on Silver, we are currently trading in the 5th wave of a decline. While some short-term weakness is possible towards 18.45/18.18, we recommend buying at these levels for a move back towards 21.68 and 22.70. The bullish RSI divergence confirms our view as well.


LUNCBUSD RALLY UPDATEWave degree appears dynamic at this point.
From June 8th 2022 low of 0.00004123 to June 29th high of 0.00016663 is 5 waves up- wave I of 3.
decline from June 29th high to July 4th low is a rather corrective than impulsive looking like a zigzag 5-3-5- wave II of 3.
Price above 0.00014298 July 1st high would suggest wave III of 3 is underway provided July 4th low of 0.00010100 remains intact.
Disclaimer: We accepts no liability whatsoever for any loss or damage that may result, directly or indirectly, from any forecast or opinion, information or omission, whether negligent or otherwise, within this report

Bearish Count on BitcoinLooking for feedback and tips on this BITSTAMP:BTCUSD count. Also see my bullish count below.

Bitcoin Cycle Count and ForecastI'd love some feedback on this count
Potential double zigzag in play on COINBASE:BTCUSD

$NNDM ~ Nice...As shown in previous update, correction continues and expect lower prices as shown. Possible opportunity soon but not yet. Will be interesting soon and will continue to track closely.

$CLSK ~ Interesting...As shown in previous update, correction continues and expect lower prices as shown. Possible opportunity soon but not yet. Will be interesting soon and will continue to track closely.

$UBER ~ Where's the bottom...As shown in previous update, correction continues and expect lower prices as shown. Possible opportunity soon but not yet. Will be interesting soon and will continue to track closely.
